This is the second post in a series based on data collected by FFT on the GCSE grades which secondary schools in England proposed for their pupils. For more details on the data collected and the overall findings, read the first post in this series.
We saw in our first post that the GCSE grades proposed by secondary schools this summer tended to be higher than those awarded by examination in 2019.
This was the case in all subjects, but more so in some than others. For instance, the average proposed grade in computer science was 5.4 in 2020 – that is, between a grade 5 and a grade 6 – compared to an actual grade of 4.5 in 2019 for the same schools.
In fact, the subjects with the largest changes between actual 2019 grades and proposed 2020 grades tended to be those subjects which have historically been graded more severely.
To show this, we’ll go back to this blogpost from last year, where we looked at whether some qualifications were scored either too generously or not generously enough in school performance tables in 2018.
Among other things, the post showed that pupils tended to achieve lower grades in modern foreign languages and computing relative to their English language and maths grades. By contrast, grades achieved in art and design tended to be higher.
An update for 2020
We’ll repeat the same calculations for 2020: firstly, calculating an average grade in English language and maths for each pupil. We can then use this as a benchmark to compare attainment in their other subjects. For example, we can calculate the average grade of all pupils entered for GCSE computer science and compare this to the average grades for these pupils in English and maths, seeing which is higher.
The chart below shows the result of doing this.
It shows that, based on teachers’ proposed grades, computer science, modern foreign languages and statistics still tend to be harshly graded in 2020 relative to English and maths.[1] But some of the other subjects graded more severely than English and maths in 2018, such as music, and design and technology (D&T), were graded less severely by teachers in 2020.[2]

Now let’s look at this same information in a different way. We’ll calculate the change in grading severity between 2018 and 2020. In other words, the differences between the two bars in the chart above.
The chart below shows this change on the vertical axis. The horizontal axis shows the relative severity of a subject in 2018 compared to English and maths (the blue bars from the chart above).

This chart perhaps makes it clearer that, relative to English and maths, schools proposed higher grades in 2020 than in 2018 in the subjects that were most severely graded in 2018.
In some subjects, like business studies and D&T we might suppose that only having a single year of data in reformed GCSEs might be a factor. All other things being equal, you would expect the second cohort of pupils taking an exam to do a bit better than last year’s, as teachers have an extra year of experience under their belts. (An approach called comparable outcomes is normally applied to exam results to account for this and ensure that results are broadly similar.)
By contrast, the relative severity of preliminary centre assessement grades in science, English literature and art and design was broadly similar to 2018.
Revised grades
It is clear that some schools made use of the statistical moderation service that FFT offered to revise their grades before submitting them to the exam boards. More than 1,000 schools (over half of all participants) sent more than one file of preliminary grades. This means we can look at changes between the first file and the final file.
Overall, in all subjects, 15% of pupils’ grades were amended. In 10% of cases they were lowered following the initial submission and in 5% of cases they were raised. It was in the most severely graded subjects where more grades were lowered, as shown in the next chart.
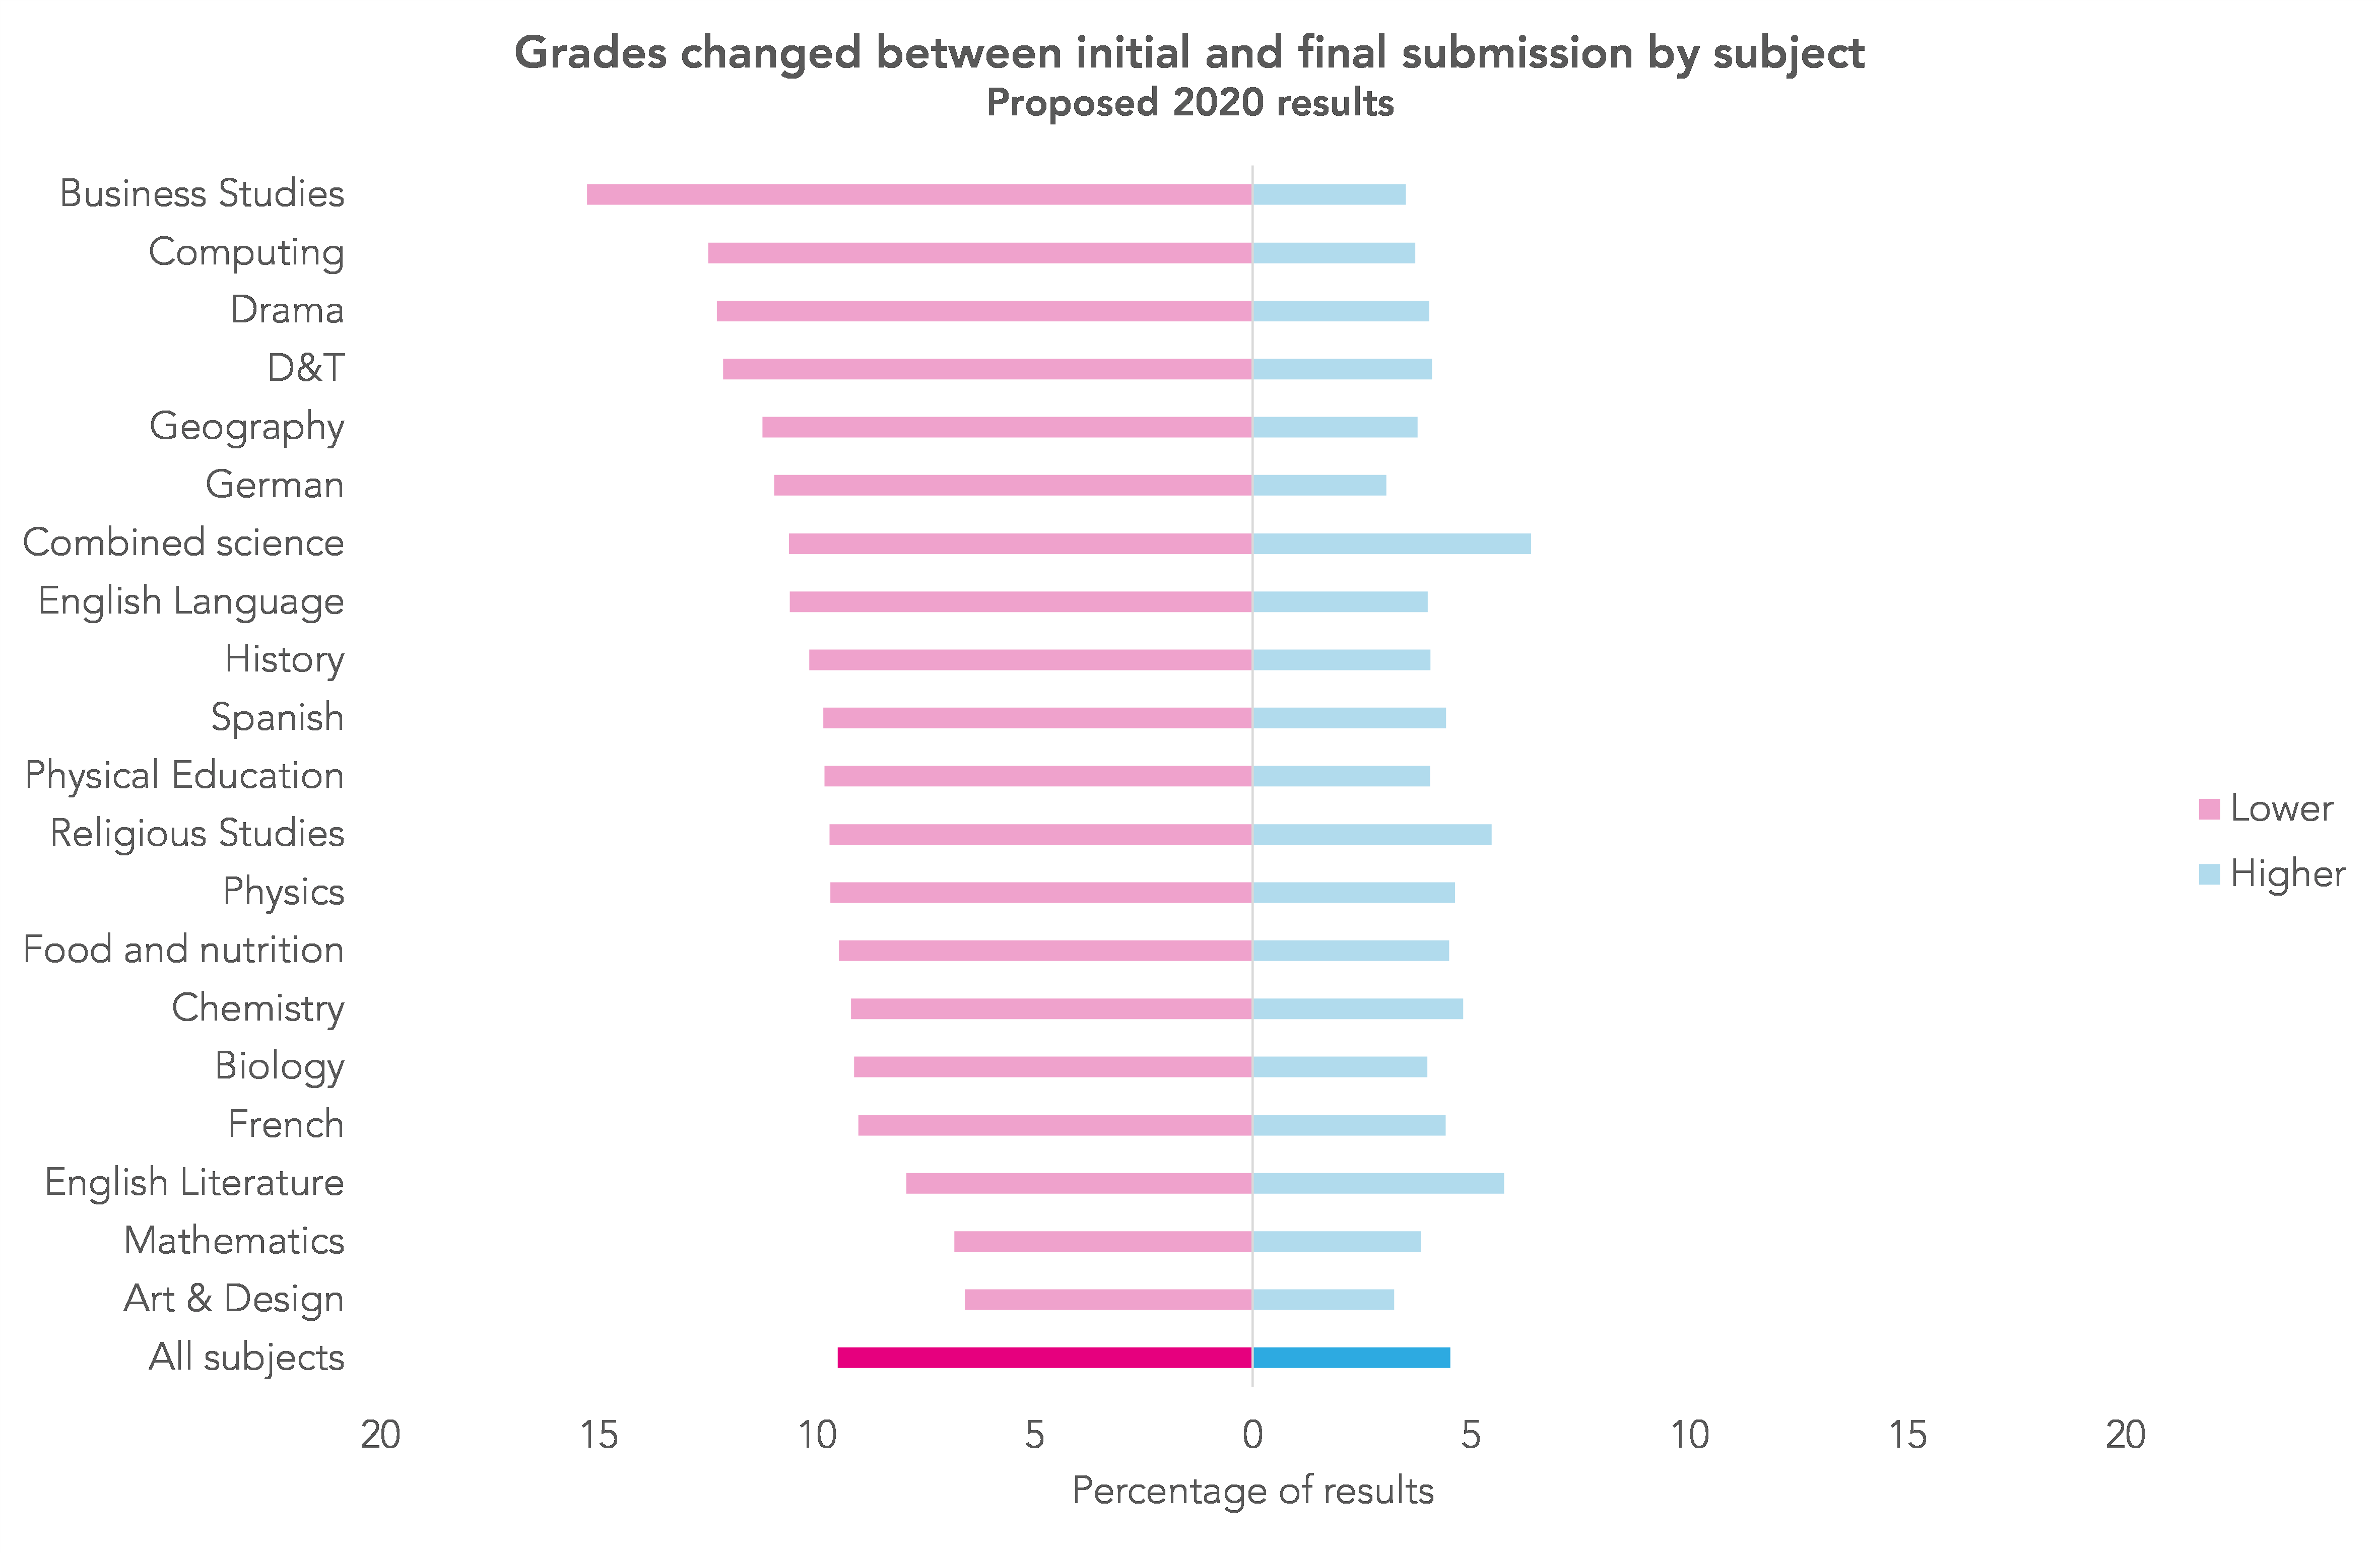
It’s fairly clear that Ofqual’s approach to statistical moderation will have more of an effect in some subjects than in others. Although it seems it is the Secretary of State’s intention is to bring back exams next year, if this approach does have to be adopted again next year then providing schools with more information on the severity of grading in particular subjects would be helpful.
Now read the next post in this series.
Want to stay up-to-date with the latest research from FFT Education Datalab? Sign up to Datalab’s mailing list to get notifications about new blogposts, or to receive the team’s half-termly newsletter.
1. As published here, Ofqual will increase grades awarded in GCSE French and German this summer.
2. We should say that 2018 results for D&T were based on old (A*-G) GCSE specifications.


You cannot co.pare one years grades with another . It depends on the cohort . Some years kids are brighter , more adaptable and have a different attitude to work than some other years . Some year groups just have a greater number of brighter kids .
I would agree with you if looking at year-on-year differences for a single school. However, we’re looking at almost 2 thousand schools here and we wouldn’t expect much difference across so many.
With the greatest of respect to the authors, you cannot compare a pupil’s performance in one subject to their performance in another as their aptitudes are so variable across a range of subjects. It is like comparing apples and citrus fruit! You already mention that over time teachers’abilities to deliver a subject in a new exam system improves with experience. As mentioned in another comment, cohorts of children can differ vastly in ability too so a year on year comparison is not an accurate measure. Look at the statistical measures we have seen for Covid …. some have been widely out; they are models to act as guidance and drive future actions but are not definitive and accurate. Different theories underlie different statistical models and you could go on and on tweaking children’s exam results beyond all recognition of their actual performance on the day. How is this fair to our children? They work hard and it seems to me that the system is set to finding ways to minimise their performance more than to assist them. For me, the parent of one of this year’s GCSE candidates who has worked hard, this is an argument to scrap GCSE exams altogether as a meaningless measure of a child’s performance. I know statistics is meant to assist us to predict and make sense of our world but when you start altering actual scores on paper to fit a statistical model it becomes a nonsense to me and unfair to the children. The only good thing about exams is that they might allow a child to confound teacher expectations and shake up incorrect assumptions and prejudices about which children will do well … unconscious and unintended prejudices. I feel queasy at the prospect of my child’s future chances being determined by some kind of a statistical lottery, including factors like perceived rank in a classroom.