This blogpost is part of FFT’s 2020 Secondary Results Service. Participating schools can now download their first GCSE Summary Analysis from the ‘Special reports’ area of FFT Aspire
Last week we had a look Key Stage 4 data we had collected from schools to assess the impact of this year’s GCSE awarding arrangements on disadvantaged pupils.
Limitations of the data notwithstanding, we were cautiously optimistic that the attainment gap in two key threshold indicators (achieving grade 4/5 or above in English and maths) had narrowed slightly.
Of course, what we would really like to know is how the disadvantage gap would have looked if exams had taken place. This we will never really know.
Another way of looking at the results actually awarded though is to look at changes in within-school gaps. Do we see any evidence that disadvantaged pupils have fared less well this year taking account of the schools they attend?
The problem(s) of within-school gaps
Ordinarily, we would avoid looking at within-school gaps for a whole range of reasons summarised by Becky Allen in this blogpost. However, in the absence of any better data at this moment in time, we’ll give it a go.
One of the issues with within-school gaps is that even if all schools closed their gap, a national gap might still exist. This is because disadvantaged pupils are not evenly distributed around schools.
Here’s an example to demonstrate this. Imagine that a local authority has just two schools. All the disadvantaged pupils in the LA go to School A. Even if disadvantaged pupils have the same level of attainment as other pupils at School A, an LA gap would still persist if attainment at School B was higher.
So in this post, rather than compare the LA (or national) average for disadvantaged pupils with the LA (or national) average for other pupils, I’m going to calculate a different comparator. This is the average for other (non-disadvantaged) pupils at each school weighted by the number of disadvantaged pupils. This means less weight is given to schools with smaller numbers of disadvantaged pupils, such as grammar schools.
Attainment gaps taking account of school attended
Here’s an example. Across the five schools in the table below, the average Attainment 8 English score among disadvantaged pupils was 10.4. This compares to 13.0 for other pupils, a difference of 2.6 points. However, the largest of the school gaps was just 1.2 points, at School C.

This apparent anomaly arises because schools vary in terms of the numbers (and proportions) of disadvantaged pupils. A total of 95 pupils (47%) at School B were disadvantaged, compared to 20 (13%) at School E.
Instead we can calculate another comparator figure that takes account of these differences.
In the table above, column 6 multiplies together the figures in column 1 (the number of disadvantaged pupils) and column 4 (the Attainment 8 English score for non-disadvantaged pupils). These values are then summed in the final row of column 6. This value is then divided by the total number of disadvantaged pupils (the final row of column 1) giving a value of 11.3. The attainment gap taking account of school attended is therefore 0.9 points (11.3- 10.4).
Comparing 2019 and 2020
Using the same data as in the blogposts referenced above, we have final 2020 GCSE data for 1,200 schools.
We can calculate the average Attainment 8 score for each of English and maths at each school, for disadvantaged pupils and other pupils, and compare these to published 2019 data for the same set of schools.
We can also calculate a non-disadvantaged pupils comparator taking account of school attended , using the method described above. This is the comparator shown on the charts below.
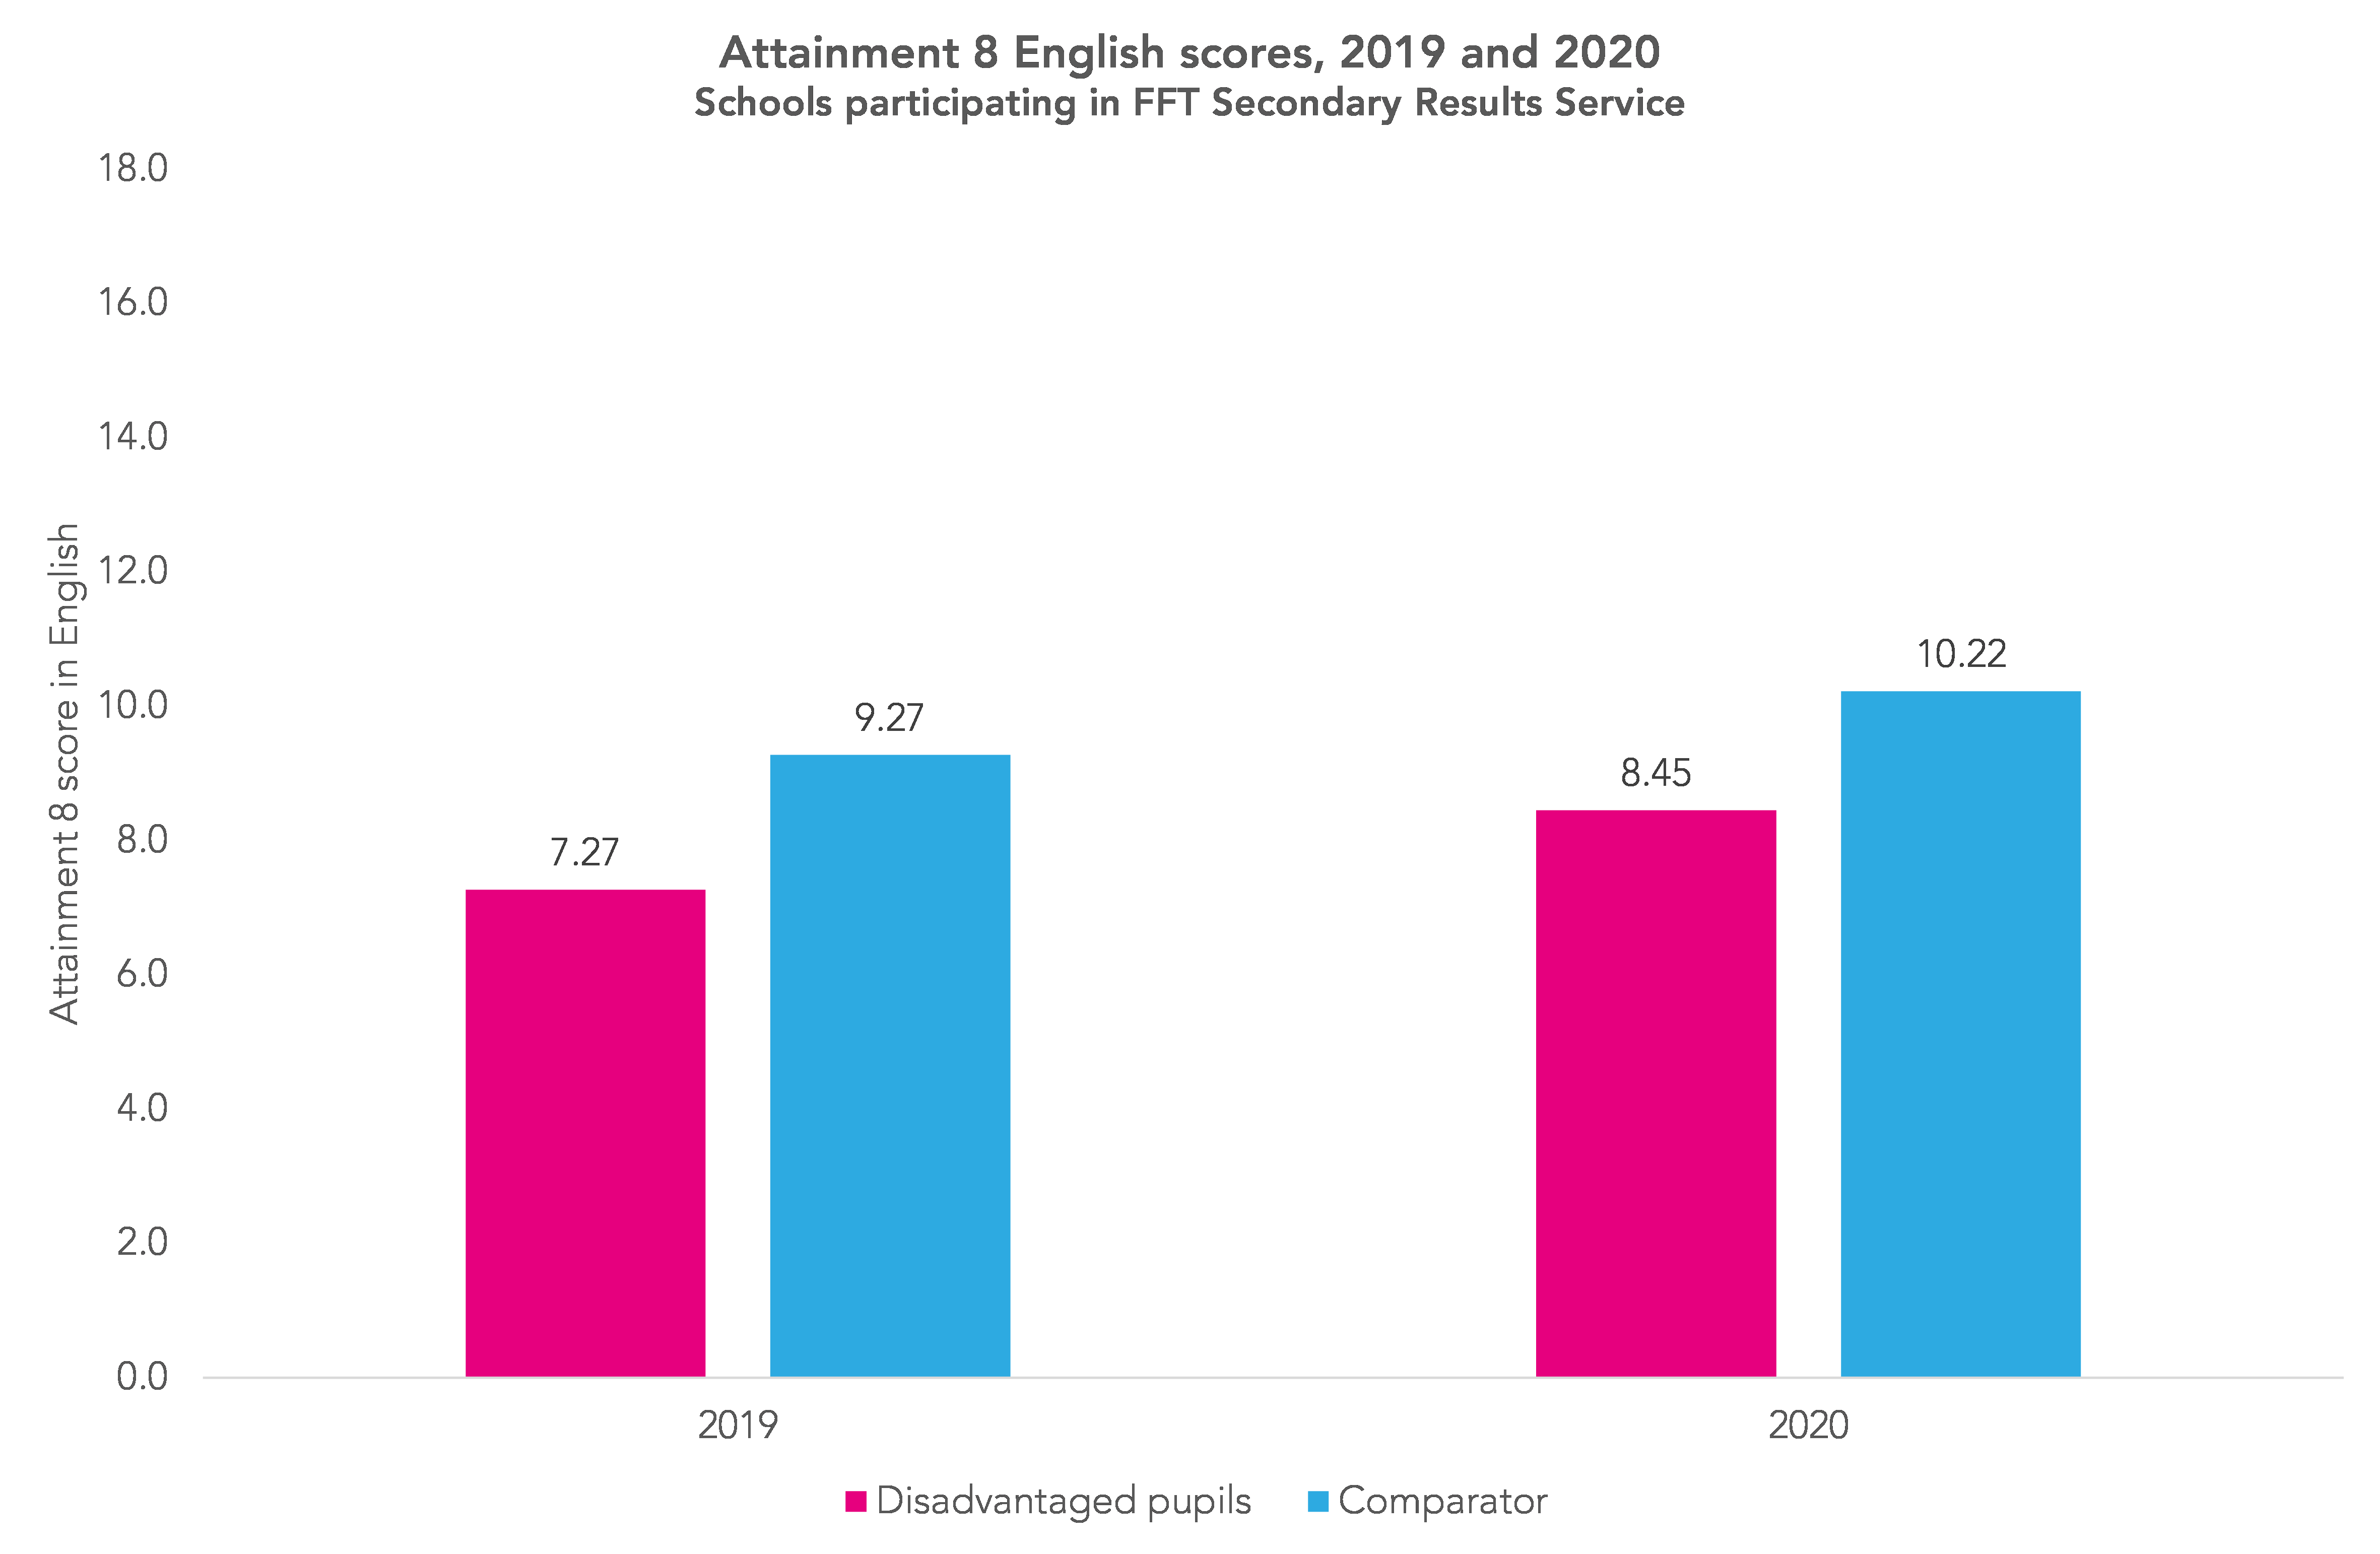

In both English and maths, and taking account of school attended, attainment increased by a slightly greater margin among disadvantaged pupils than for our non-disadvantaged pupils comparator.
So based on this evidence from imperfect data, it looks like within-school disadvantage gaps narrowed slightly as a result of this year’s arrangements. But we will wait for more detailed data to become available before being confident.
(We can’t rule out that these findings are due to differences in group composition between 2019 and 2020. As we wrote here, free school meals eligibility has been increasing in recent years due to changes to eligibility criteria.)
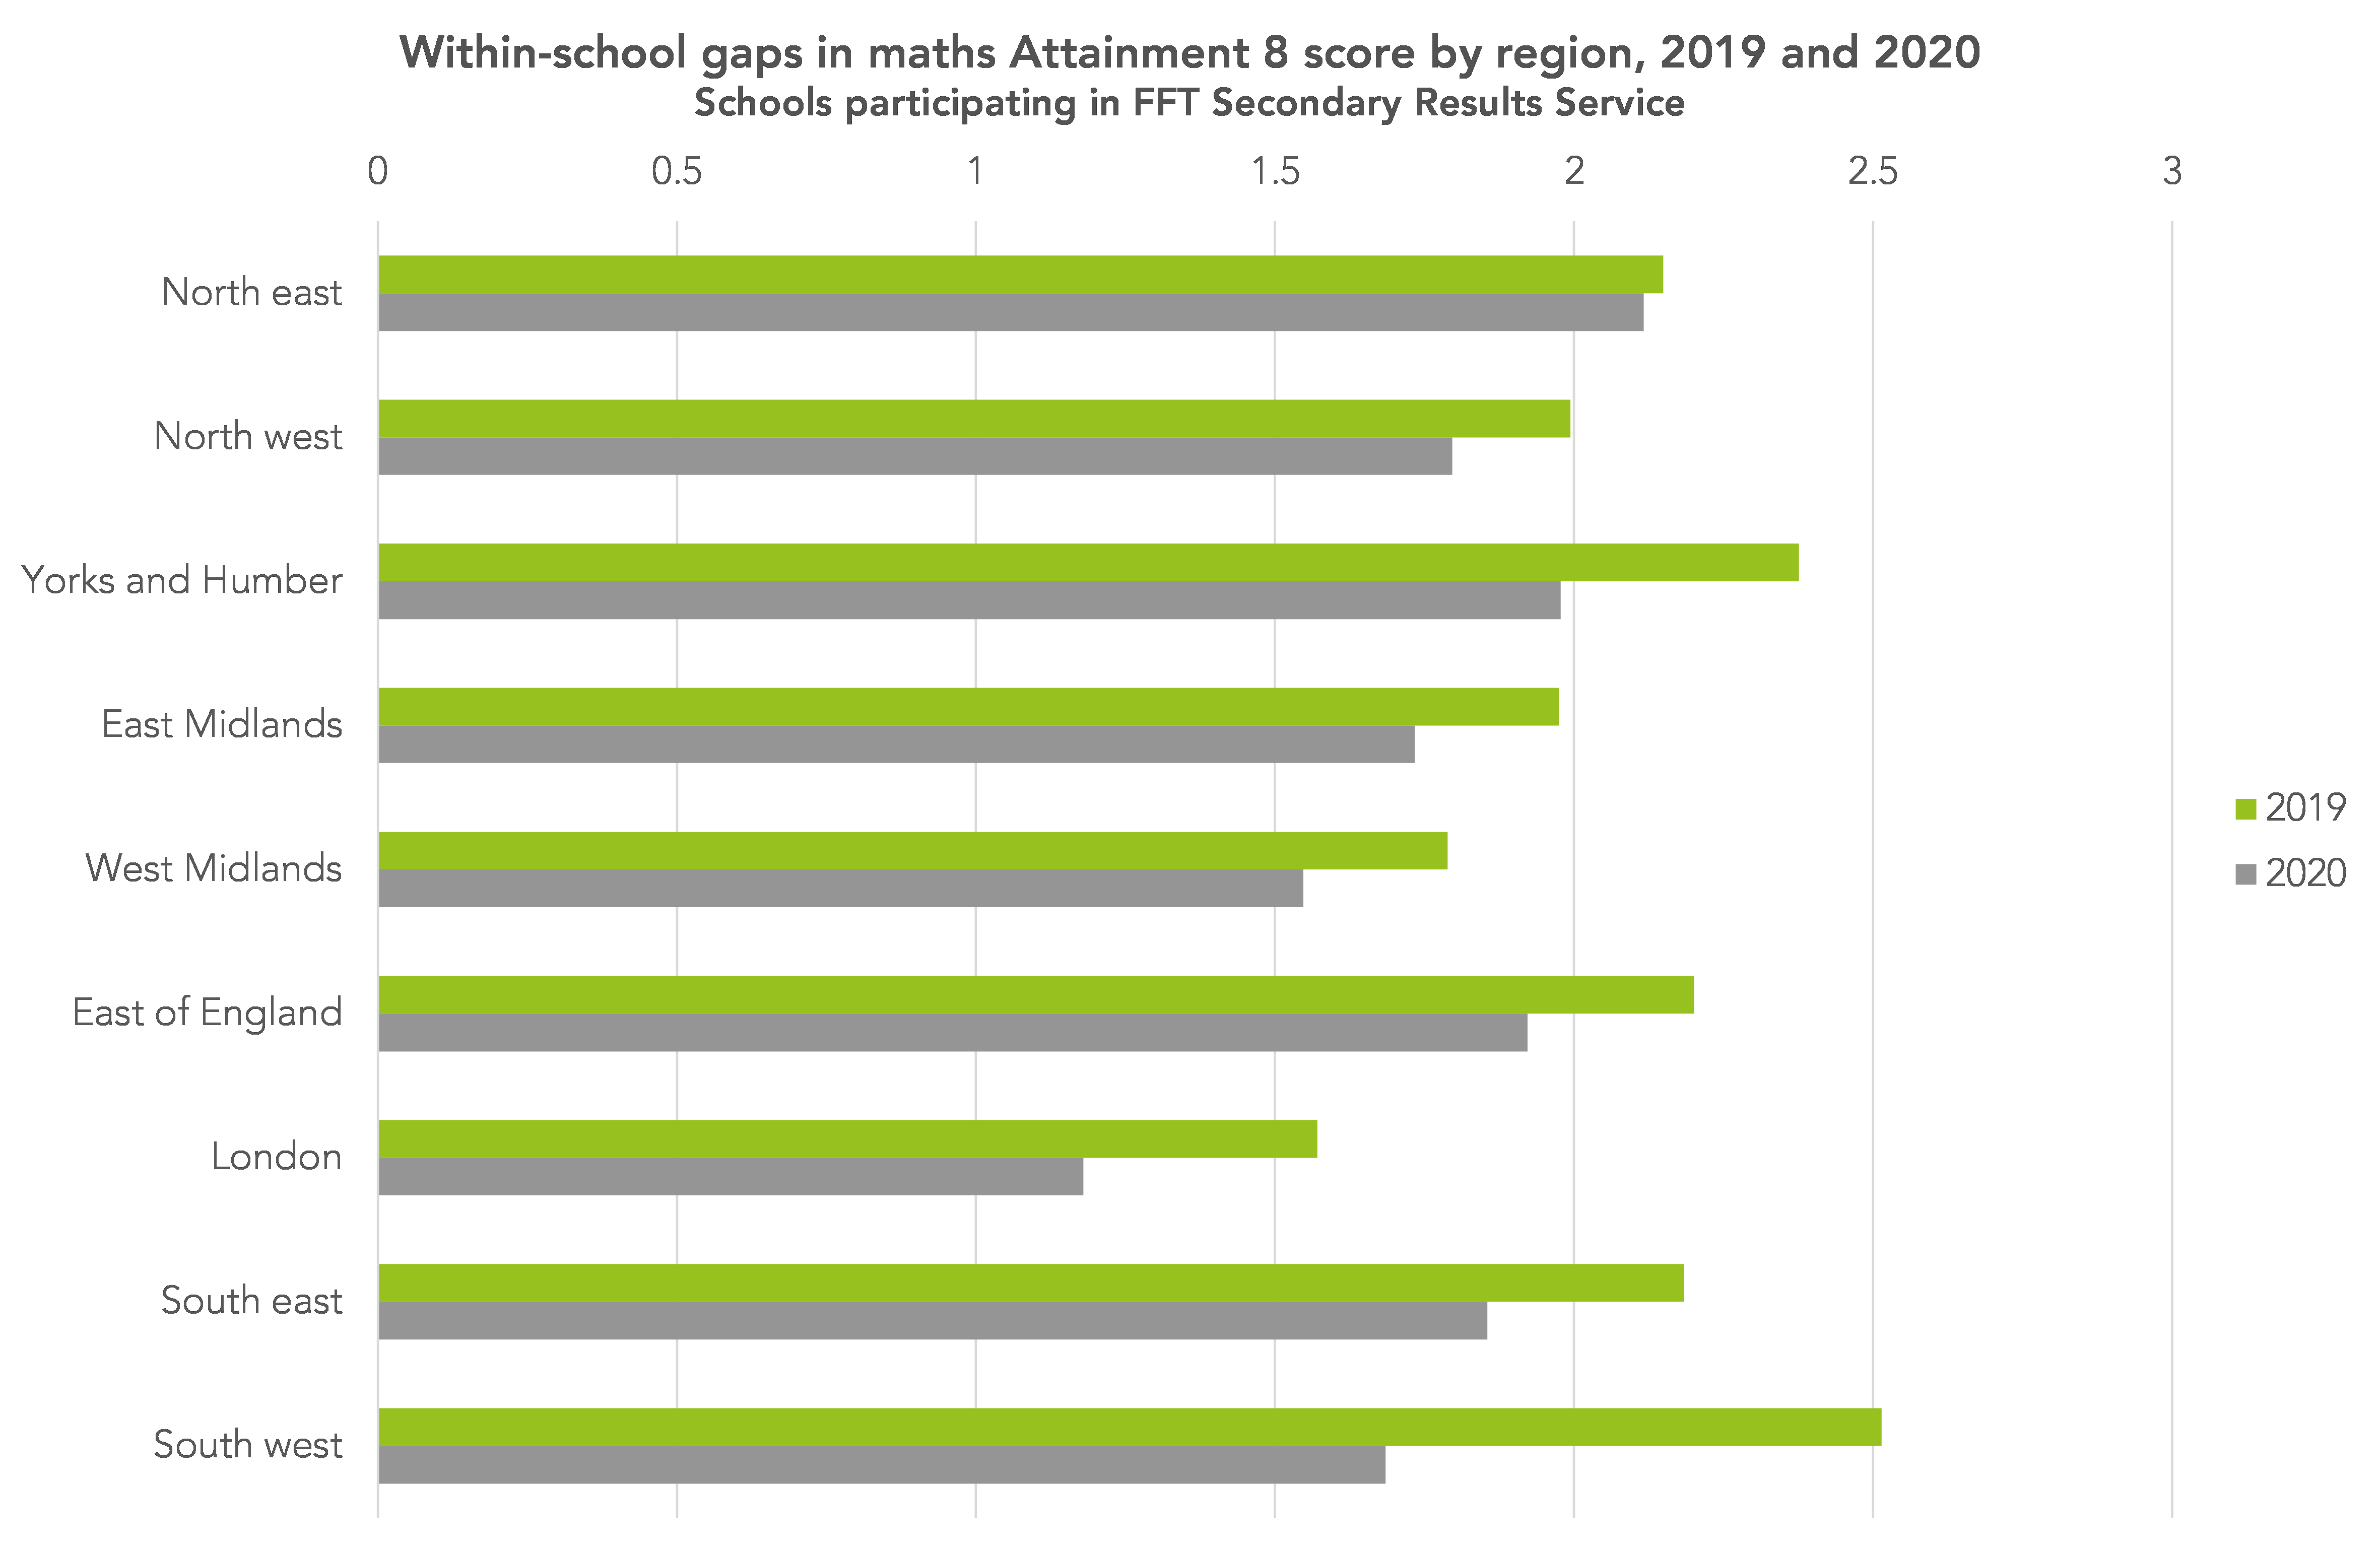
Within-school gaps by region
Finally, a quick look at results by region. Curiously, within-school gaps narrowed by a much greater margin among schools in the south west in our sample. Yet barely changed at all among schools in the north east.

Want to stay up-to-date with the latest research from FFT Education Datalab? Sign up to Datalab’s mailing list to get notifications about new blogposts, or to receive the team’s half-termly newsletter.


Leave A Comment