Attention at the moment is rightly focused on minimising the effects of learning disruption due to Covid, for example through the National Tutoring Programme. This aims to make high quality tutoring available to disadvantaged young people.
Yet even before Covid, there were variations in attainment with respect to pupil characteristics.
The low attainment of some groups is widely recognised and reflected in policy – for example the Pupil Premium is the government’s mechanism for trying to raise the attainment of disadvantaged pupils.
However, there are other low-attaining groups. Although it has been known about for years, the attainment of black Caribbean pupils at Key Stage 4, particularly in maths, appears to have gone under the policy radar somewhat in recent times.
Attainment at Key Stage 4
For this blogpost, we’re going to look at attainment at Key Stage 4 between 2015 and 2019.
Around 7,000 pupils classified as black Caribbean reach the end of Key Stage 4 in state-funded schools each year, around 1.3% of the national cohort. These pupils are highly clustered geographically, with 62% attending schools in London.
And, as we showed for a previous cohort, we should recognise here that around 10% of black Caribbean pupils who enter the state-funded mainstream sector in Year 7 have left it by the end of Year 11 for a variety of reasons including exclusion, managed moves and emigration, compared to an average of 7% for all pupils.
Among those reaching the end of Key Stage 4, the percentage of black Caribbean pupils achieving a grade 9-4 in GCSE maths (A*-C up to 2015/16) has been falling, as the chart below shows. This figure stood at 53% in 2019, compared to 70% of other pupils.

In English language, attainment has also been declining, but the attainment gap is somewhat narrower. In 2019, 58% of black Caribbean pupils achieved a grade 4 or higher compared to 69% of other pupils.

Since 2016, the Department for Education has published Progress 8 scores, which summarise overall Key Stage 4 attainment taking account of pupils’ prior attainment at the end of Key Stage 2.
These scores are published by ethnicity in DfE statistical releases, but the published data does not include separate scores for the English and maths components of Progress 8. I have calculated these – shown in the charts below.[1]
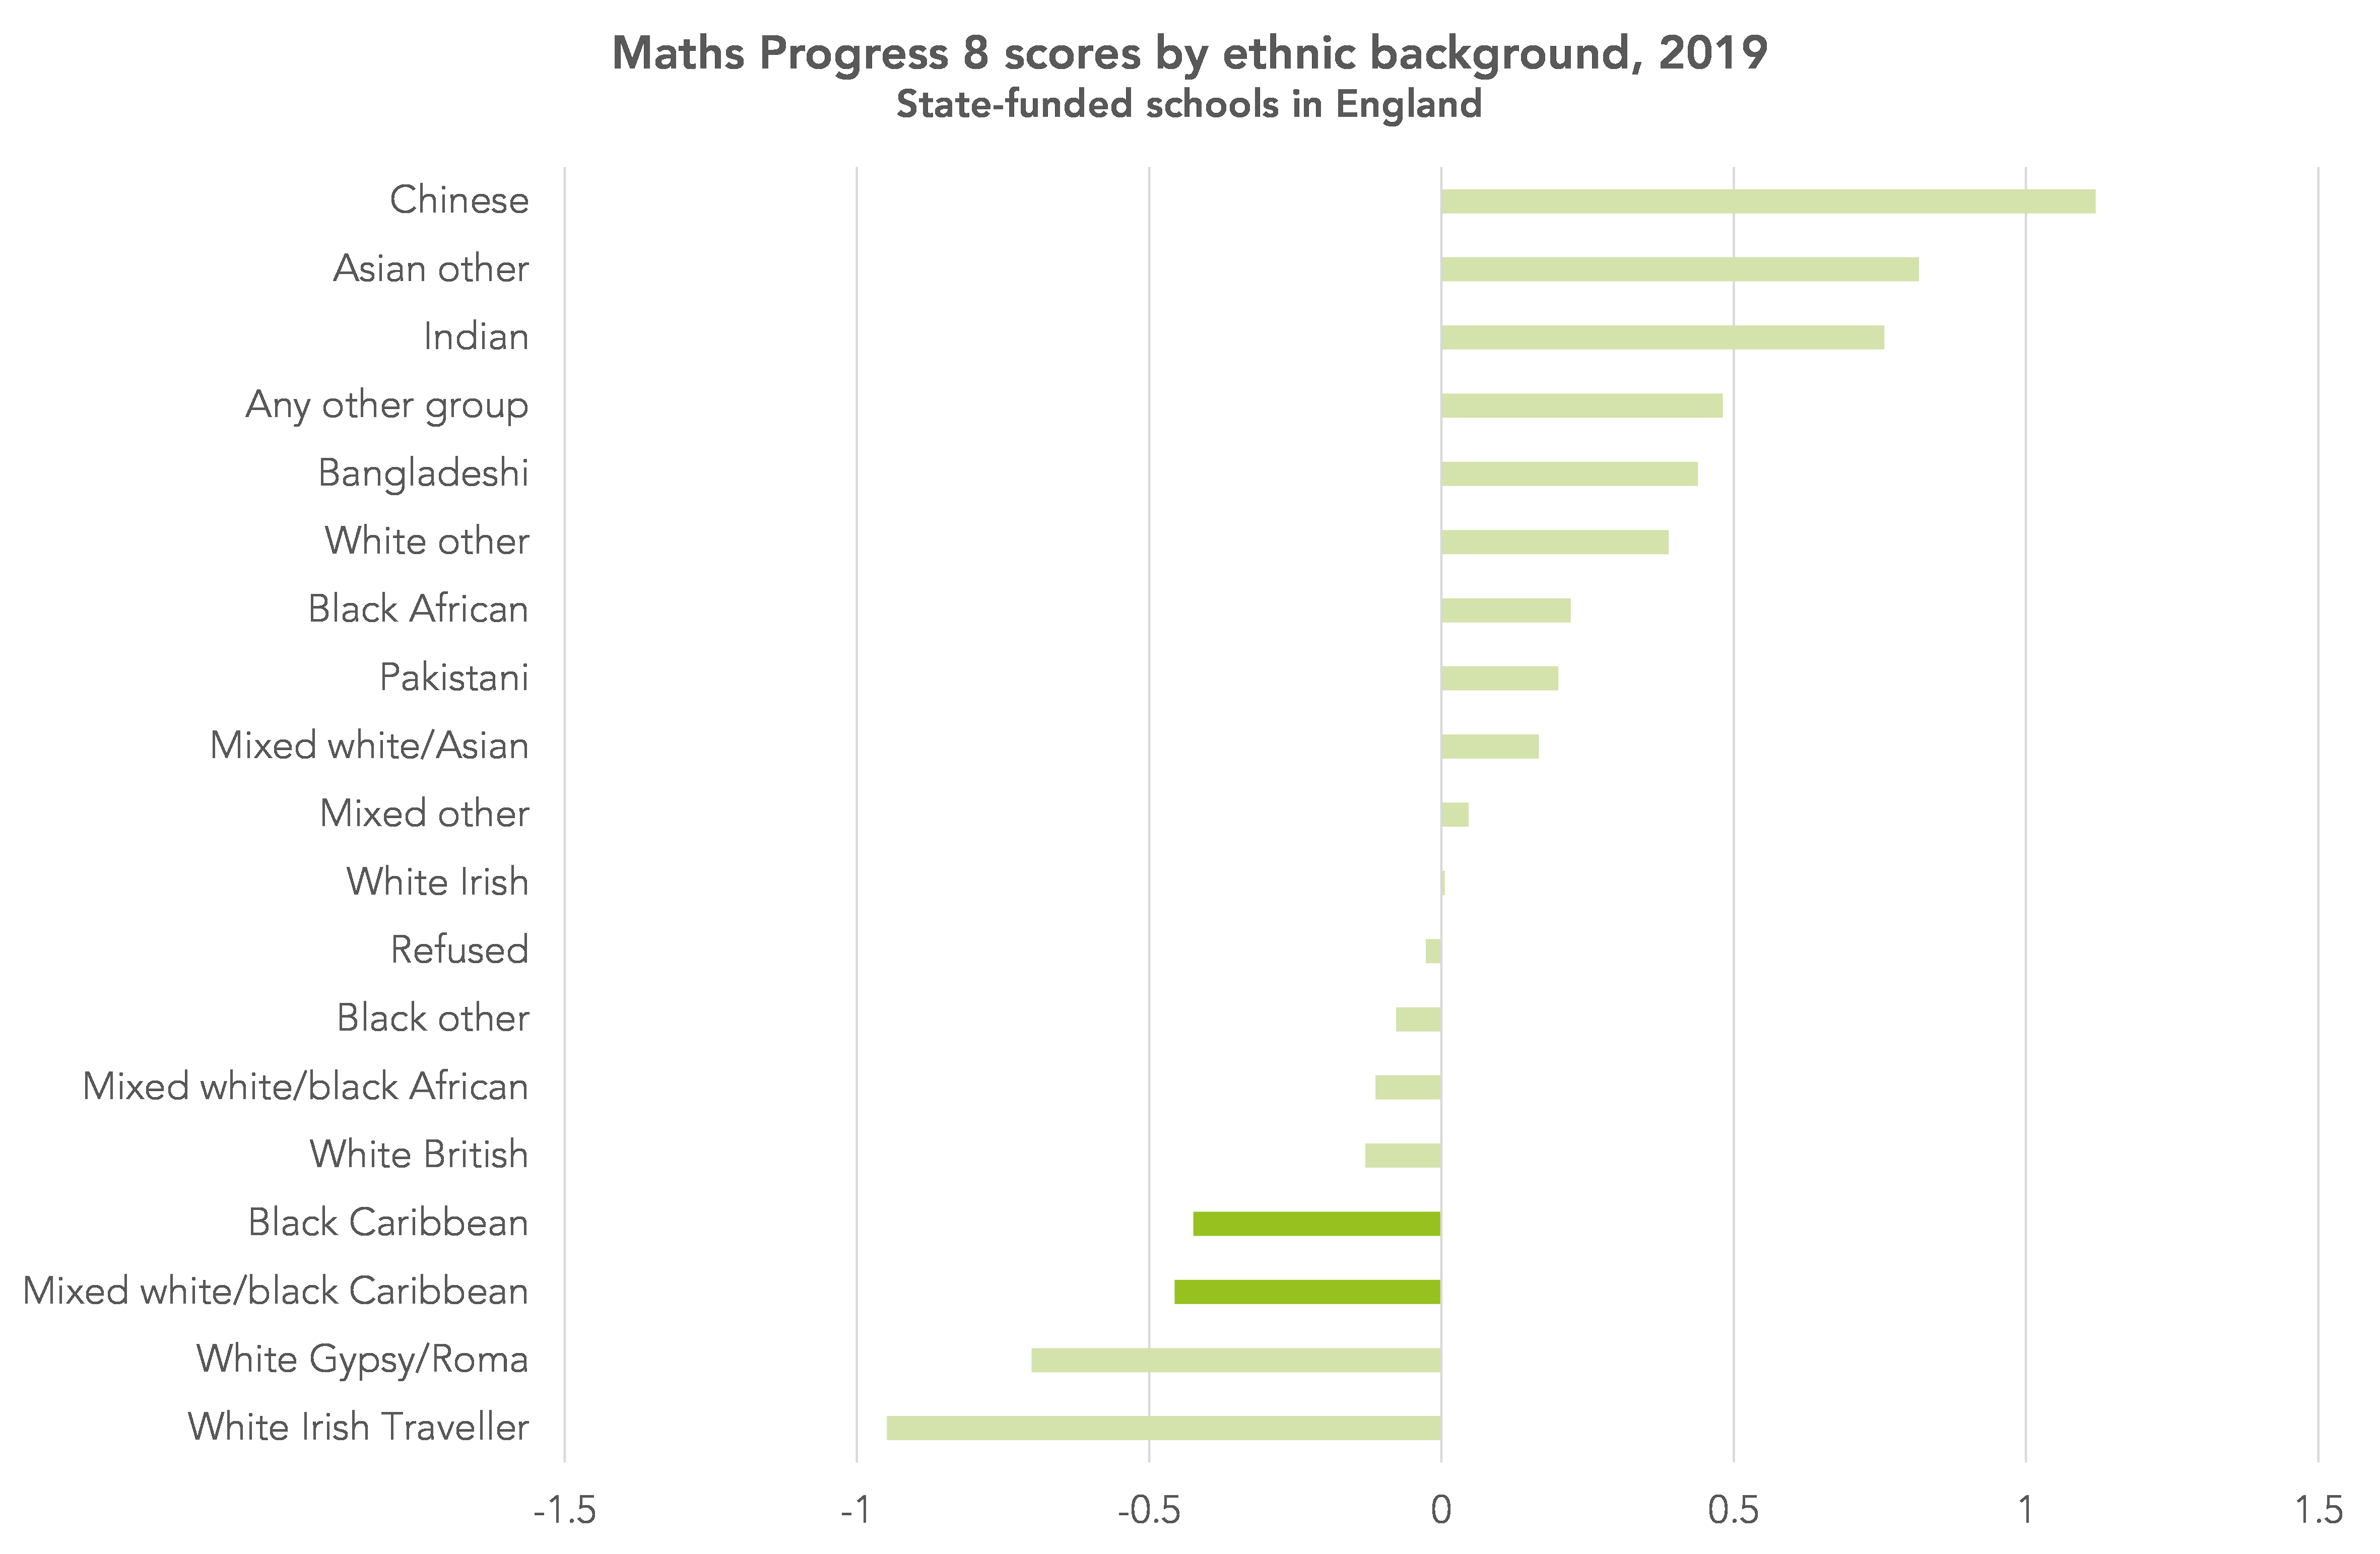
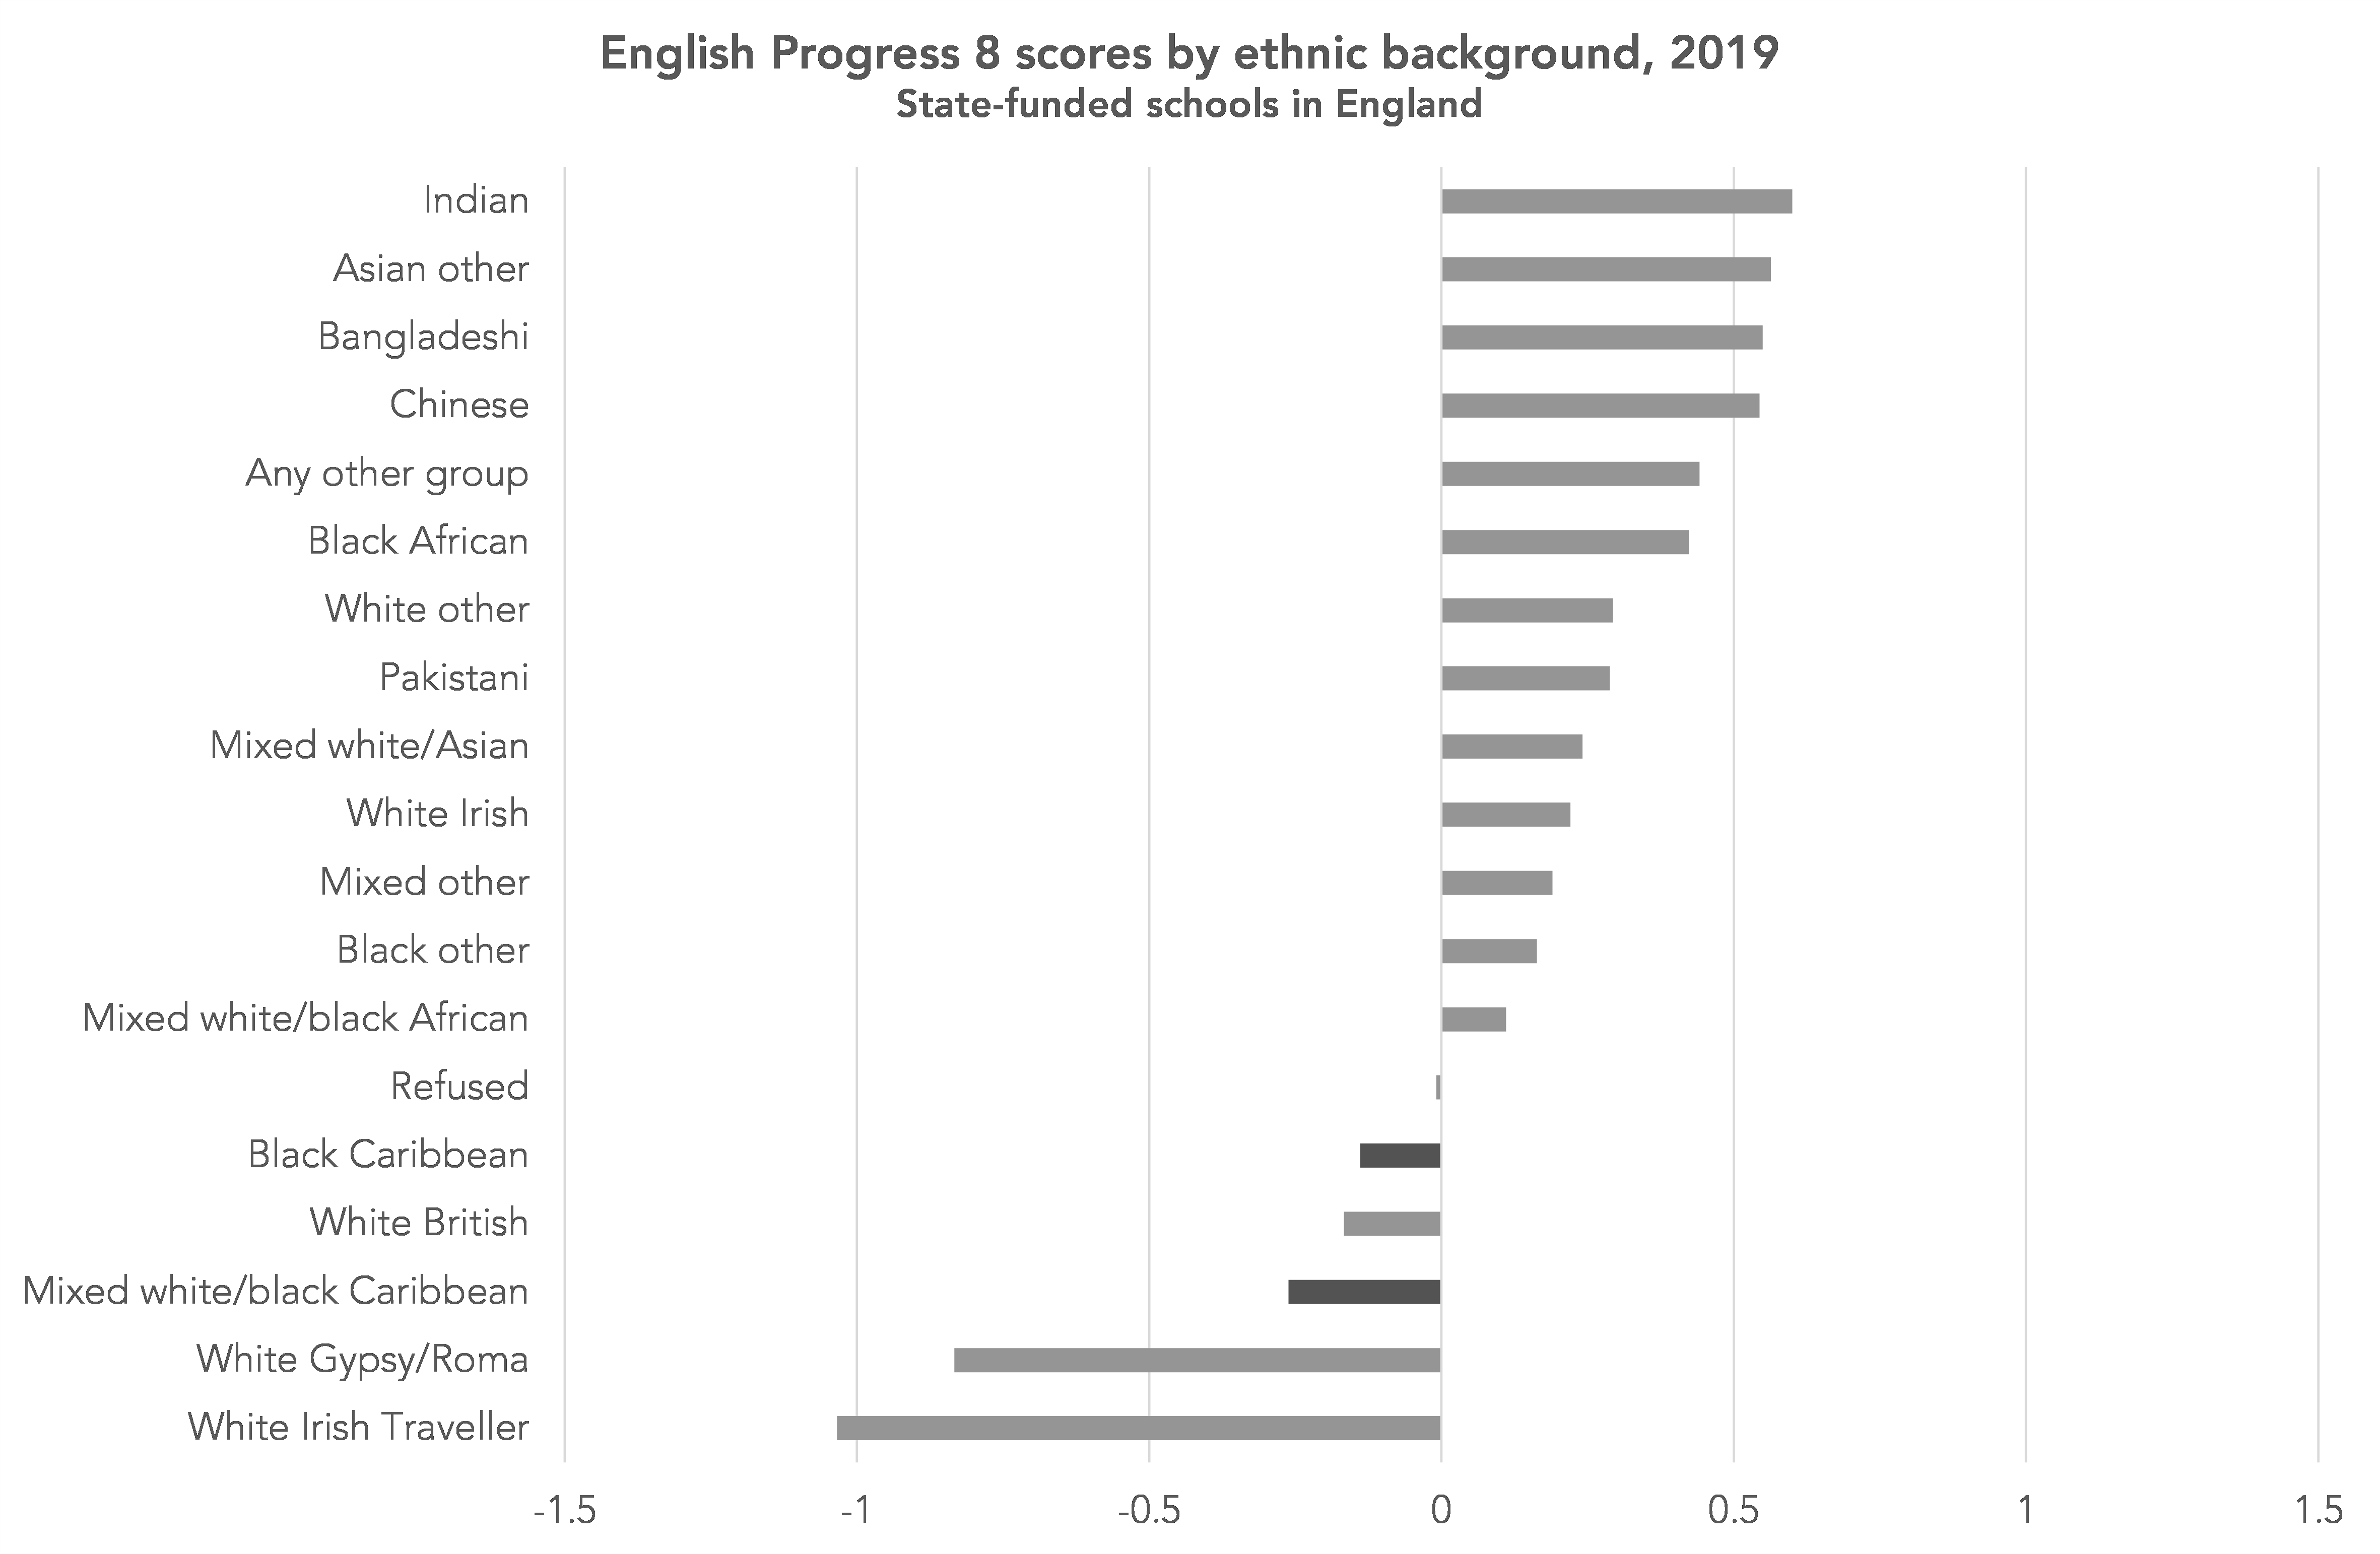
Progress 8 scores are lowest among pupils classified as Irish Traveller or Gypsy/Roma. However, the average maths Progress 8 score for black Caribbean and mixed white/black Caribbean pupils is also very low – something which is not visible in the published DfE statistics. This suggests that pupils from these groups are tending to fall behind pupils with similar Key Stage 2 attainment during their secondary education.[2]
Controlling for disadvantage
In 2019, 49% of black Caribbean pupils were classified as disadvantaged at the end of Key Stage 4 compared to 25% of other pupils.
The Progress 8 calculations do not take account of disadvantage, nor a variety of other factors that are associated with Key Stage 4 attainment such as gender, first language and month of birth.
For the 2019 cohort, we’ve therefore controlled for these factors, in addition to Key Stage 2 attainment, and have looked at GCSE maths grades.[3]
The resulting averages for these adjusted maths Progress 8 scores are presented in the table below for each ethnic group. Given the geographical clustering of black Caribbean pupils, separate averages are shown for schools in London and the rest of England.

This shows that, even accounting for additional factors, the attainment in maths of black Caribbean pupils and mixed white/black Caribbean pupils is lower than that of other pupils with similar Key Stage 2 attainment and characteristics.
This is the case in both London and elsewhere. The differences shown are equivalent to between one-sixth and one-fifth of a grade to the ‘average’ pupil. (The table also shows marked differences in the attainment of Pakistani pupils in the capital and elsewhere as we showed in a previous blogpost.)
What next?
Various reasons have been proposed for the sustained low attainment of black Caribbean pupils (see here for example) – and the findings here suggest that the gap is widening.
Currently, there are no national strategies or funding mechanisms specifically aimed at the improving the attainment of this group of pupils, although a large proportion will be covered by Pupil Premium funding.
Until 2011, the ethnic minority achievement grant provided funding to raise the attainment of black and minority ethnic pupils. However, since 2012 this has been rolled into general school funding. Additional funding is made available for young people with English as an additional language for three years from first entering the state-funded system, but this applies to very few black Caribbean pupils.
Of course, whether funding mechanisms are necessary or sufficient to solve seemingly intractable low attainment is a fair question. Effective strategies for improving attainment are also needed.
On a positive note, there are some schools which appear to be more effective in achieving good outcomes for black Caribbean and mixed white/black Caribbean pupils. Perhaps the answer to this problem could be found within them.
Want to stay up-to-date with the latest research from FFT Education Datalab? Sign up to Datalab’s mailing list to get notifications about new blogposts, or to receive the team’s half-termly newsletter.
1. Figures that we produce will be based on slightly different numbers of pupils to the DfE’s own figures. This is due to slight differences in the datasets that the DfE provide to researchers. We have also imputed ethnic background for pupils for whom it was recorded as “not obtained” by referring back to earlier records in school census where a known ethnicity was recorded.
2. Pupils of black Caribbean background tend to have lower prior attainment as well. Among the 2019 cohort, the mean KS2 fine grade was 4.57 compared to a national average of 4.76.
3. We control for Key Stage 2 attainment in maths, difference between Key Stage 2 reading and maths scores, gender, first language (English/other), percentage of school career eligible for free school meals, year of entry into the state-funded school system in England and month of birth.
We’ve use a pupil’s full school history to identify the year they entered the state-funded school system, to calculate the percentage of terms they were eligible for free school meals (see here for more information) and also to determine whether they had ever been classified as having a first language other than English (see here for more information).


Leave A Comment