Aspire Attendance Tracker
Schools can track, analyse and compare their attendance data against 1,000s of other FFT schools using Aspire Attendance Tracker.
Log in to Aspire to access Attendance Tracker – log in here.
Not an FFT Aspire user? Learn more here.
Back in September, the Sunday Times ran an article that 135,000 pupils hadn’t returned to school following the Summer holidays.
This claim was subsequently investigated and found to lack important context by Full Fact.
The source of the figure was the Commission on Young Lives who wanted to highlight a level of “unexplained absence” because published data on absence lacks any information on persistent absence.
So we’re going to fill in this information gap in this post (and a follow-up post about absence in primary schools).
The data we’ll use is from 2,400 secondary schools subscribed to Aspire Attendance Tracker, around 70% of all state-funded secondary schools in England.
Overall picture
Firstly, let’s look at the distribution of pupils by % of sessions missed and see how it compares with last year and pre-pandemic[1]. To do this, we divide pupils into three groups: those who have missed at least 10% of sessions so far this year, those who have missed at least 20%, and those who have missed at least 30%.
We show the results when COVID-isolation absences are included (the light shading) and excluded (the dark shading)[2].

Broadly, we see a welcome fall in the numbers of students who missed lots of school compared with last year. This is due to a big reduction in pupils required to self-isolate. But a rise in non-COVID-isolation absences (which includes pupils off sick with COVID) means that there were still more pupils with high absence rates than pre-pandemic.
For example, 14.3% of pupils have missed at least 20% of sessions so far this year, the equivalent of at least a day a week. Excluding COVID-isolation absences, this figure is 10.3% – still more than double the 4.7% seen in Autumn term 2019.
If we scale these numbers up to the full population of pupils in Years 7 to 11 then 438,000 pupils have missed at least 20% of sessions so far this year.
Differences by year group
Now let’s look at this year’s data by year group. Here, we’ll focus on pupils who missed at least 20% and 30% of sessions so far this year.

As is usually the case, Year 7 have by far the lowest proportion of pupils with very high absence rates, and Year 11 have the highest.
8.7% of Year 7 pupils missed at least 20% of sessions and 2.5% missed at least 30%. In Year 11, 17.6% of pupils missed at least 20% and 7.6% missed at least 30%.
Differences by region
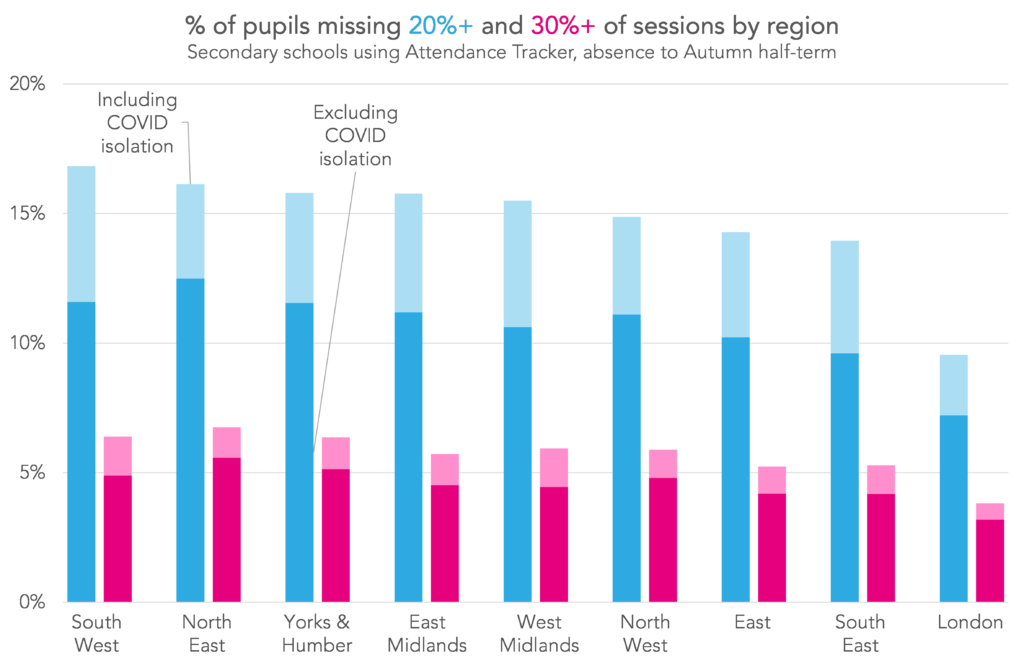
Pupils in London secondary schools were by far the least likely to have missed large amounts of school, with 9.5% of pupils missing at least 20% of sessions and 3.8% missing at least 30% of sessions.
By contrast, pupils were most likely to miss at least 20% of sessions in the South West, and to miss at least 30% in the North East.
In general, the proportion of pupils with high absence rates was between 40% and 75% higher outside the capital than in.
Differences by pupil group
Turning now to vulnerable groups of pupils: those eligible for free school meals at any point during the last 6 years (FSM6) and those with special education needs (SEN) who receive additional support (SEN K) or have an Education, Health and Care Plan (EHCP) in place (SEN E).
Here, we’ll add in the proportion of pupils who missed at least 50% of sessions, i.e. were off school more than they were in.
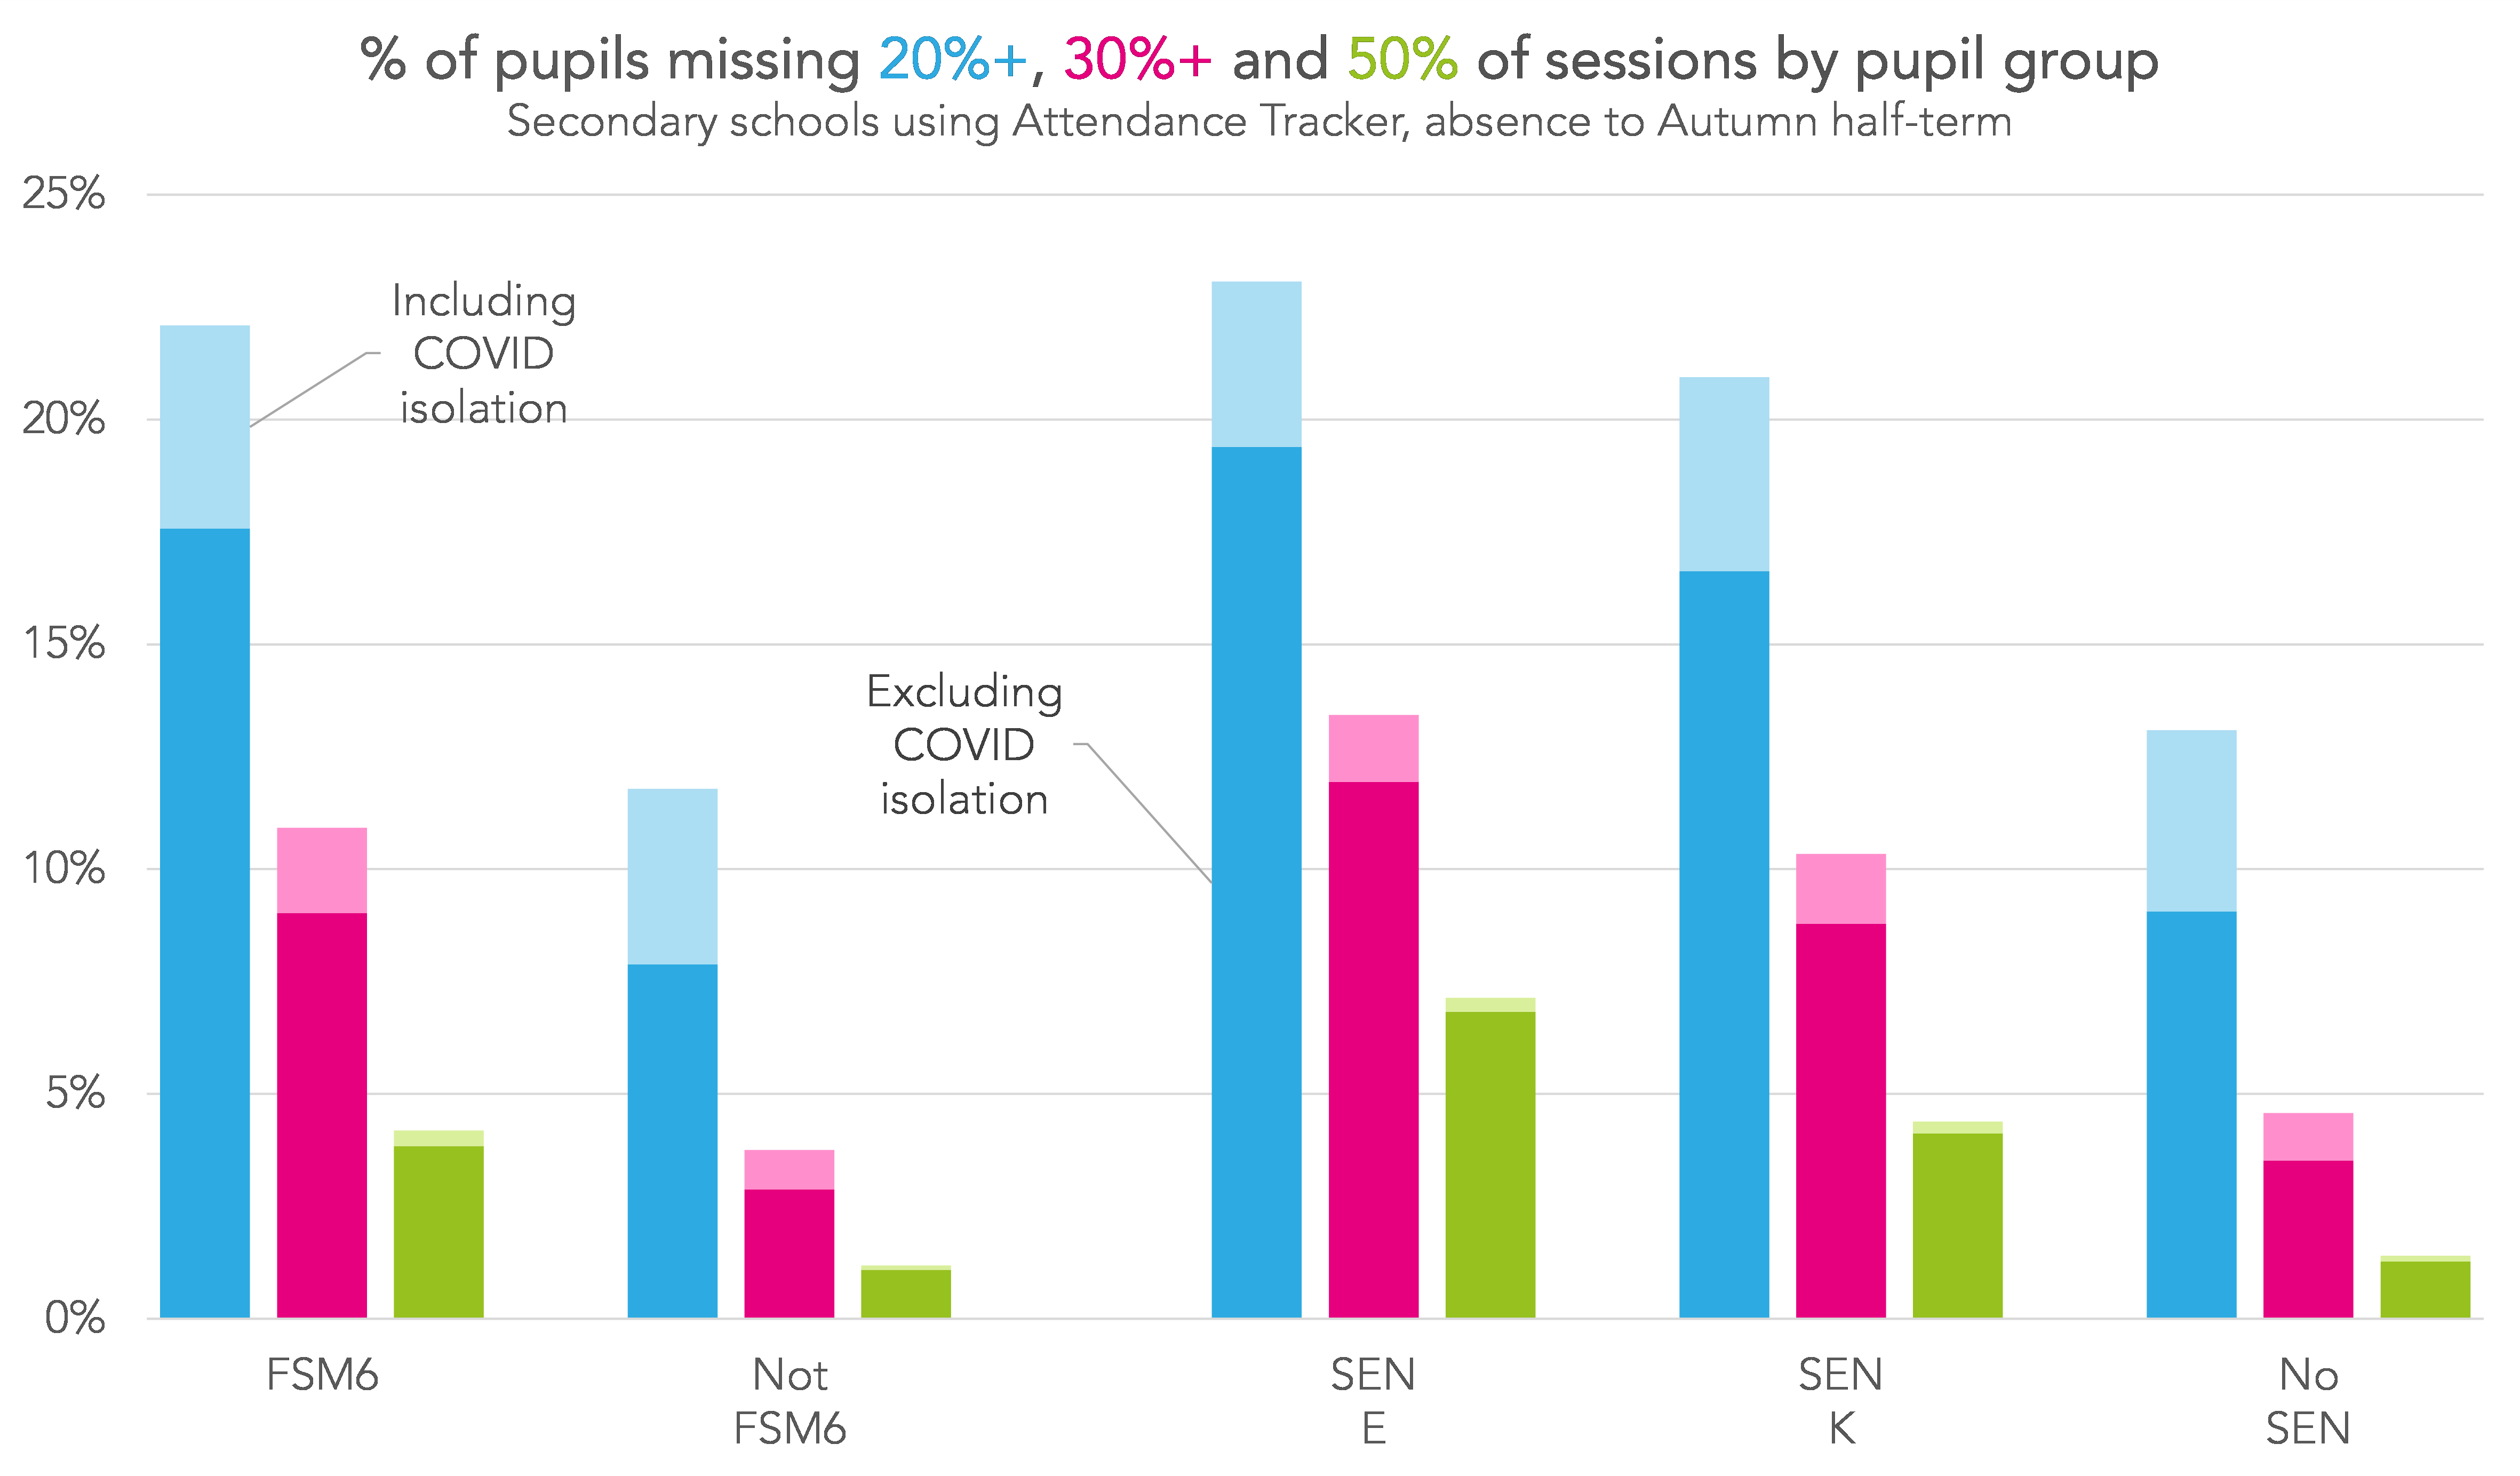
As expected, vulnerable groups of pupils were more likely to have high levels of absence than their peers.
10.9% of FSM6 pupils missed at least 30% of sessions while only 3.8% of other pupils did. That’s three times as many.
Particularly worrying is the proportion of SEN pupils with an EHCP who have missed at least 50% of sessions. 7.1% were in this bracket – five times as many as pupils with no SEN (1.4%).
Reasons for absence – the 20%+ group
So we’ve seen that the proportion of pupils missing a lot of school in the first half-term this year was higher than pre-pandemic. To finish, we’re going to dig into the reasons behind these absences.
Here we show the absence reasons recorded for the group of pupils who missed at least 20% of sessions excluding COVID isolation. We divide the absences into authorised and unauthorised, and compare with the absence codes recorded for 2019’s Autumn term persistent absentees[3] (the bars in lighter shading).
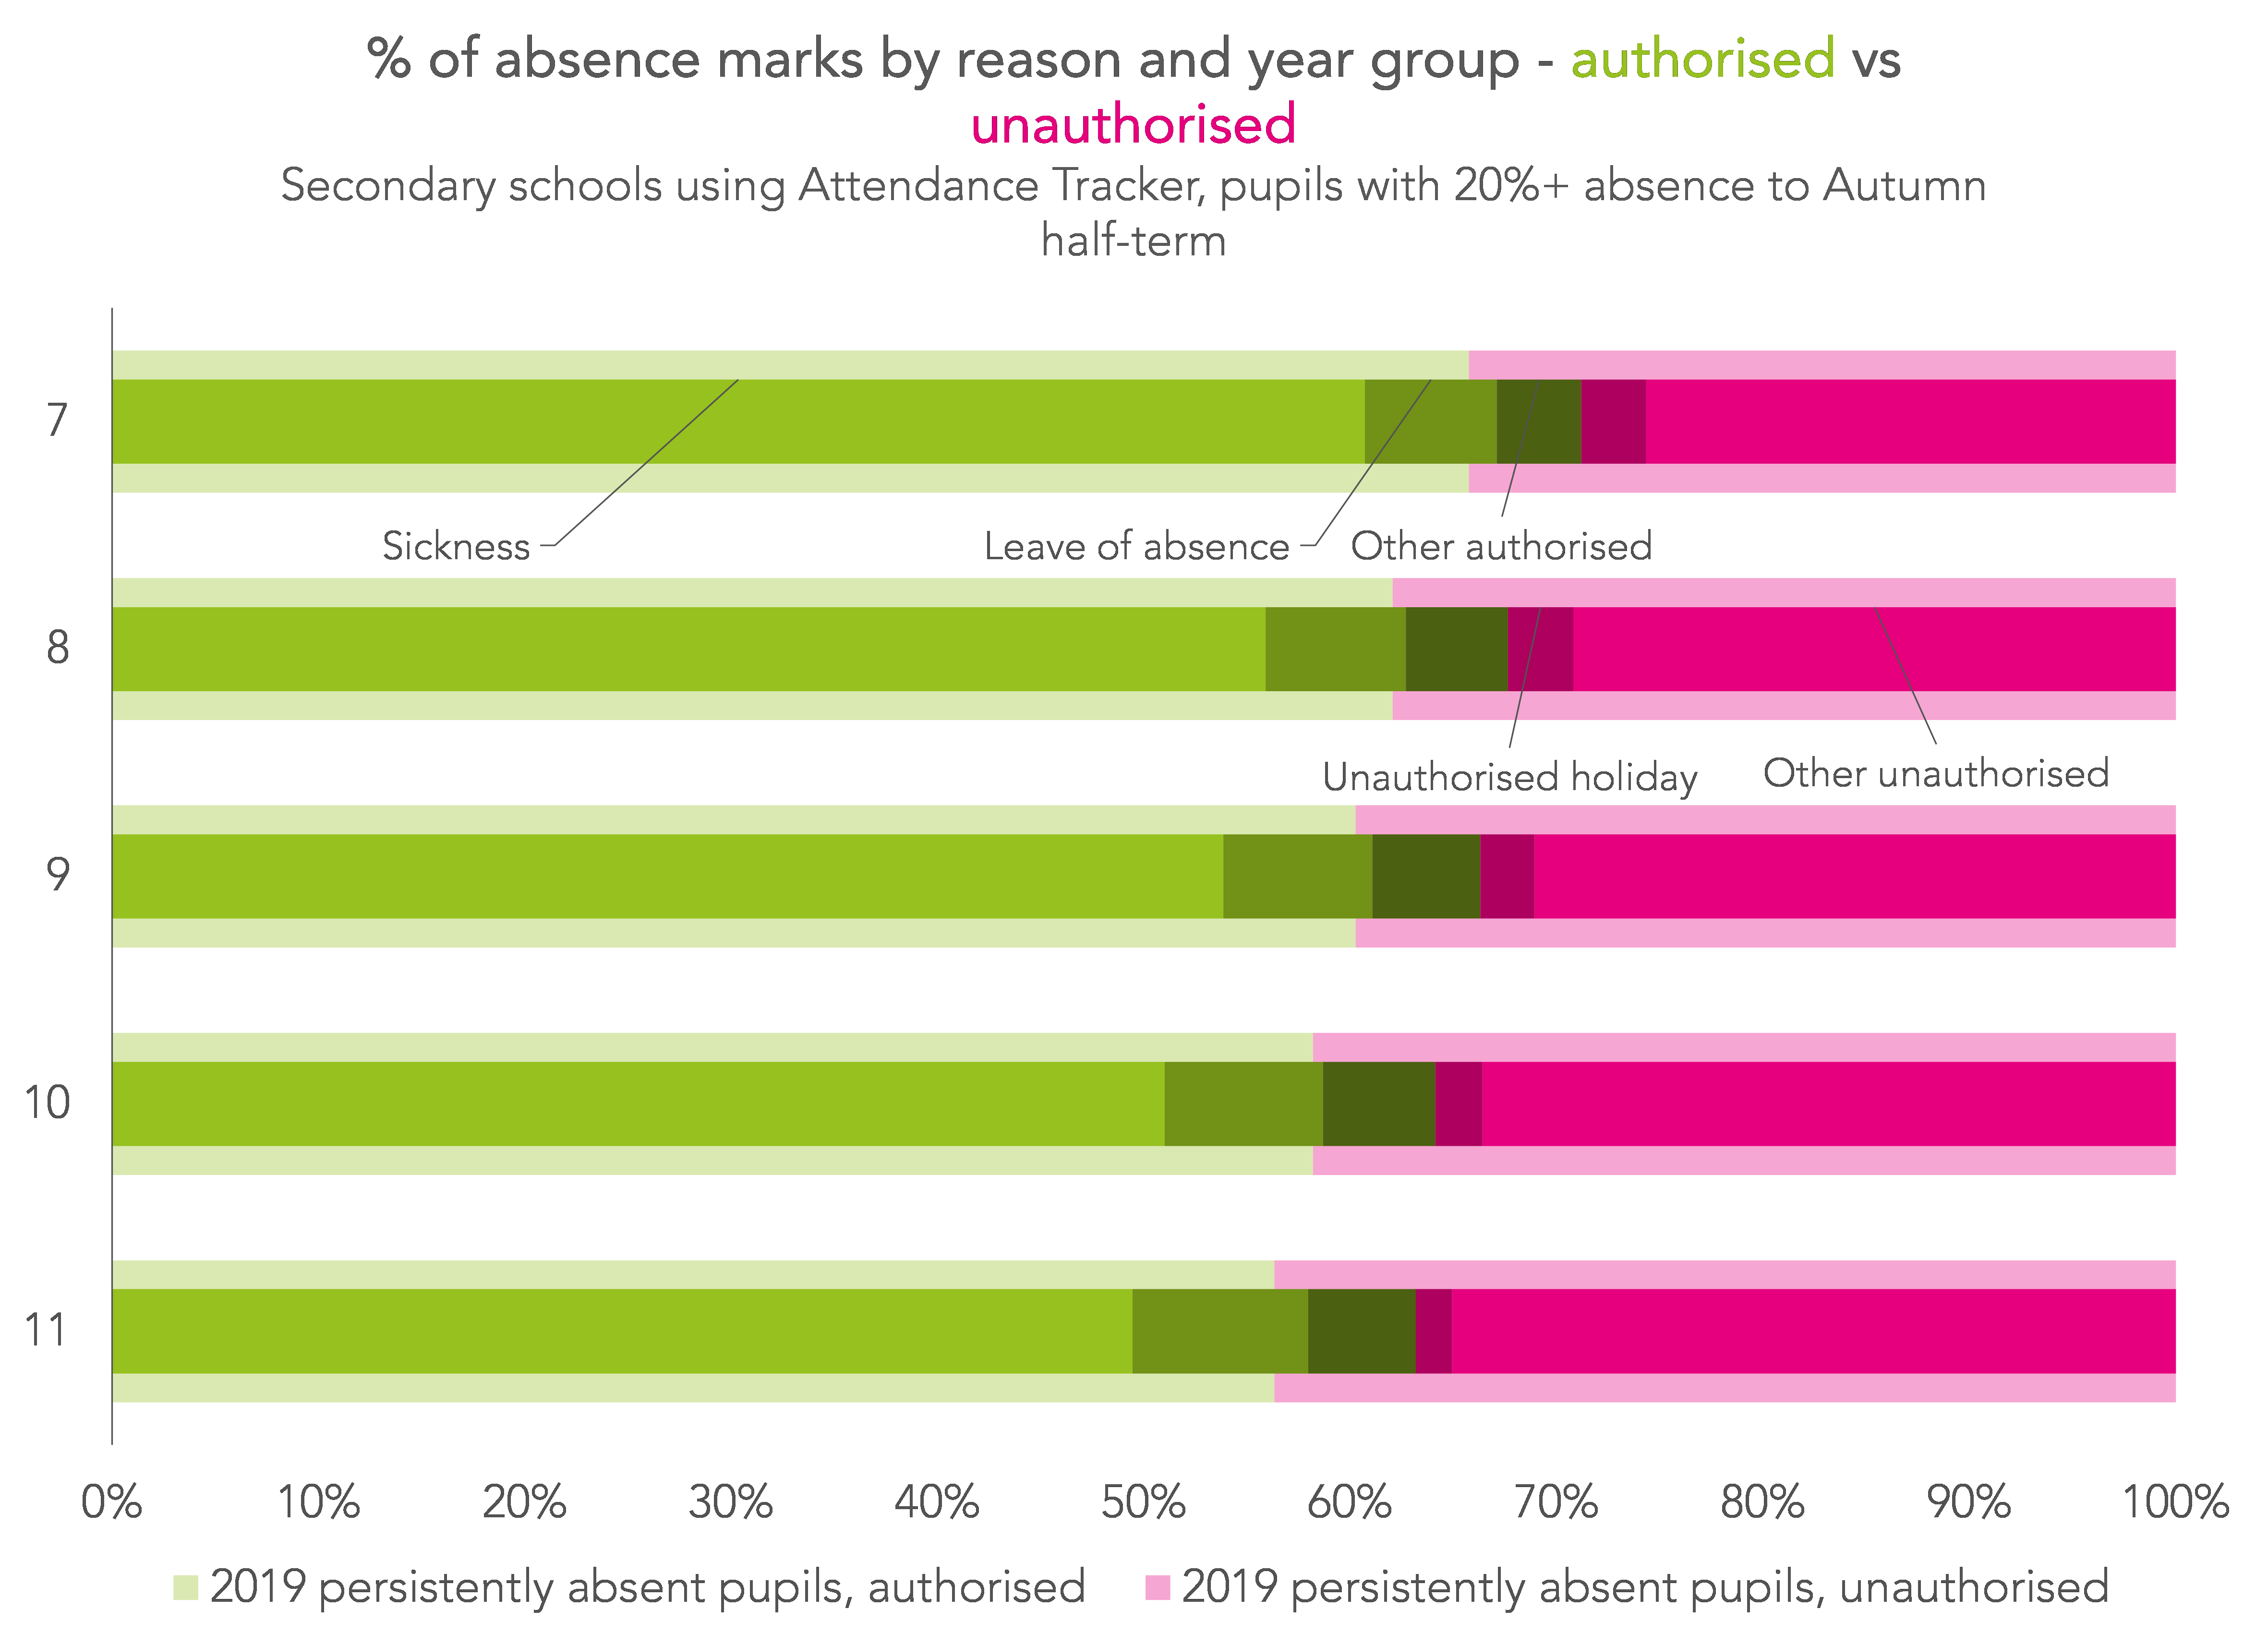
Usually the proportion of absences which are unauthorised increases with year group (true for persistent absentees as well as the wider school population) and we see the same pattern for these pupils this year too.
Compared to the breakdown of absence for persistent absentees in 2019, a greater proportion of absence this year was authorised. This is almost certainly due to a higher rate of sickness absence due to positive COVID cases.
Summary
There have been lots more pupils missing a lot of school so far this year than pre-pandemic, particularly pupils in vulnerable groups.
It looks like this is result of COVID directly causing increased sickness, rather than indirectly causing more unauthorised absence.
14% of pupils in Years 7 to 11 have missed at least 20% of sessions so far this year. However, it’s still relatively early in the school year (even though it might not feel like it). We may find that figures to date have been driven by large numbers of pupils with a single period of absence due to COVID.
What we don’t yet have a handle on is the number of pupils who are missing school for reasons other than COVID, e.g. anxiety. To do this we would need to distinguish illness related to COVID from other recorded illness in the data. Although new attendance codes for COVID illness were introduced they do not appear to be widely used within schools.
Now read the accompanying post on persistent absence in primary schools.
1. First half-term of last year, the whole of Autumn term 2019 for pre-pandemic
2. Attendance code “X” used for pupils who isolating without a positive test result (if they test positive, their absence is marked as sickness from the date of their test result). In previous blogs we’ve referred to these as “COVID-related” absences. Here we’re trying “COVID-isolation absences” to avoid confusion.
3. Persistent absence is defined as missing more than 10% of sessions. The % of pupils in the PA group in 2019 is similar to the % of pupils who missed 20%+ of sessions so far this year, so we think they’re equivalent enough to compare their reasons for absence.


This is why children should not be expected to sit formal examinations this year. They have not spent a full year at school since the end of year 8. Boris Johnson needs to rethink his heartless decision to use this year’s school leavers as guinea pigs to massage his ego. The Government have not handled this situation effectively.