This post is a follow up to a post about gender balance at A-Level. Read the first post here.
Much is written (including by us) about gender balance at A-Level. But the topic of gender balance in vocational qualifications is perhaps more neglected.
This is partly because data on A-Level entry numbers, broken down by gender [1], is published annually by JCQ while similar data on BTECs isn’t made publically available. In this post, we have used data from the National Pupil Database (NPD), which is available to researchers subject to an in-depth application and approval process.
We will recreate the analysis that we recently carried out on gender balance at A-Level for BTECs, although with one caveat. The earlier post looked at data from 2017-21. But the most recent year available in the NPD is 2020, so in this post we’ll look at data from 2016-20 instead.
Some background
Before we begin, it’s worth noting a couple of points.
Firstly, there are various types of BTEC at different levels and of different sizes. Here, we are focusing on Level 3 BTECs. These include, for example, the BTEC National Certificate, the National Extended certificate, the National Diploma and the Extended Diploma – these qualifications are the equivalent of half, one, two and three A-Levels, respectively.
In this post, we’ll be focusing on the number of students who chose to study a subject, regardless of the size of the qualification.
Secondly, many BTECs are ineligible for inclusion in school performance tables, following reforms that came into force in 2018. Many schools continue to offer these legacy qualifications.
Later on, we’ll look at whether there are gender differences in students choosing to study BTECs that are not eligible for inclusion in the performance tables.
The most popular BTEC subjects
Let’s start by looking at the most popular subjects for male and female students in 2020.
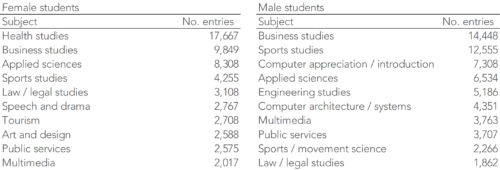
While some subjects – like business studies, applied sciences and sports studies – are popular with both male and female students, there are still some striking differences. Health studies and the arts are much more popular with female students, while computing and engineering are more popular with male students.
Gender balance in 2020
The chart below shows the gender balance for BTEC subjects in 2020.[2] We should note that slightly more male students take BTECs than female students – in 2020, the cohort was 48% female. This is shown on the chart as a dotted line.

Graphic design and music studies are very close to the overall cohort in terms of gender balance, at 48% and 45% female, respectively. But many other subjects are not so well-balanced.
The most disproportionately female subject is health studies, at 94% female. We saw earlier that this subject was the most popular choice for female students in 2020 while for male students, it didn’t even make the top ten.
At the other end of the scale, 92% of engineering studies students were male, as were 89% of those taking studying for an award in computing / IT advanced technician or construction technology.
Has gender balance improved?
Next, we’ll take a look at how gender balance in individual subjects changed between 2016 and 2020. The gender balance of the overall cohort remained between 47 and 48% during this period.
The chart below allows you to explore the gender balance of every BTEC subject [3] between 2016 and 2020.
Changes in disproportionately female subjects
The subjects with the highest proportion of female students – health studies and animal management – had similarly low levels of male students in 2016 as in 2020. But balance has improved in some cases.
Both tourism and photography increased their proportion of male students over this period. Tourism moved from 77% female to 73%, and photography from 73% to 68%.
But both speech and drama and law / legal studies increased their proportion of female students – this despite the fact that the proportion of male students taking BTECs rose. In speech and drama, the proportion of female students increased from 71% to 75%, and in law / legal studies it rose from 59% to 63%.
Changes in disproportionately male subjects
The biggest change in an individual subject was in graphic design. In 2020, 48% of graphic design students were female – almost exactly the same as for the cohort, as noted above – while in 2016, it was just 40%.
Other subjects in which gender balance improved include music technology and sports studies. In 2016, 82% of music technology students were male, compared to 77% in 2020. In sport studies, the figures are 79% in 2016 and 75% in 2020.
However, in all three of these subjects, the differences are mainly driven by fewer male students choosing to study the subject rather than more female students choosing to do so.
The most disproportionately male subject – engineering studies – saw its proportion of male students fall slightly from 94% in 2016 to 92% in 2020. Computer appreciation / introduction, on the other hand, increased its proportion from 83% to 87%.
What about legacy qualifications?
Finally, we observed some gender differences in whether students studied a legacy qualification – that is, a BTEC that’s no longer eligible for inclusion in school performance tables. In the bulk of this post, we’ve looked at all BTECs, regardless of whether or not they are eligible for inclusion.
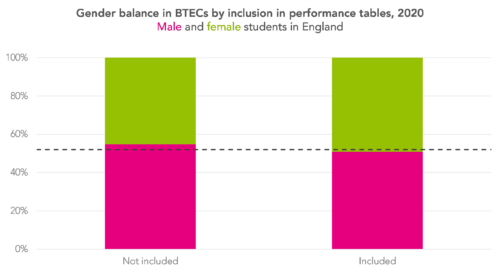
Overall, 52% of BTECs are taken by male students, as indicated on the chart above with a dashed line. But 55% of legacy qualifications are taken by male students, compared to 49% of BTECs that are eligible for inclusion in performance tables.
In summary
There certainly are differences between the genders when it comes to subject choice at BTEC. If anything, these differences are more extreme than those seen at A-Level.
While some subjects have improved their gender balance over the last few years, others have gone the other way.
Only time will tell how the introduction of T-Levels will affect the picture.
[1]: Both the JCQ data and the NPD include data on ‘gender’ rather than ‘sex’, in both cases with a binary male/female definition. Therefore, in this post we refer to ‘gender’ to be consistent with the source data, although arguably ‘sex’ might be the more appropriate term. As far as we’re aware, data on identities other than male/female is not available at present.
[2]: Excluding those with fewer than 100 entries from either male or female students.
[3]: Excluding those with fewer than 100 entries from either male or female students in every year from 2016-20.
Want to stay up-to-date with the latest research from FFT Education Datalab? Sign up to Datalab’s mailing list to get notifications about new blogposts, or to receive the team’s half-termly newsletter.


Leave A Comment