This year marks 30 years of Ofsted.
So this seems as good a time as any to look at how schools’ inspection outcomes have changed over time.
School inspection existed before Ofsted but inspection as we know it, with a common framework and published reports, were introduced in 1992.
If you poke around the Ofsted website you’ll find published reports dating back to the early part of this century. I don’t know if the earliest reports exist in a digitised form somewhere but I wouldn’t be surprised if they do.
In this blogpost we’ll take a look at schools’ chronologies of overall inspection results. This is not quite as easy as it sounds as we get into a philosophical and legal tangle about what a school is. More of that later.
Data
Ofsted publishes management information on inspection outcomes for state-funded schools every month.
We have been compiling these extracts for some time. The earliest data dates back to the start of the 2005/06 academic year. This period covers just over half of Ofsted’s lifetime.
The most recent file of data published by Ofsted [1] contains data on almost 22,000 currently open schools.
For each of these schools, we build up a history of overall graded inspection outcomes from the start of the 2005/06 academic year. Throughout this period, schools have been graded on a scale from 1 to 4.
However, these outcomes have been achieved under different inspection frameworks. Most crucially, the meaning of the grades has also changed. From 2012, the meaning of grade 3 changed from satisfactory to requires improvement.
For each school, from the date of the first inspection we observe until the end of January 2022[2], we calculate the number of days they were judged to be outstanding, good and less than good [3].
We then classify schools according to their inspection history using the following mutually exclusive categories:
- Never good
- Mostly less than good
- Mostly good
- Always good
- Always outstanding
- New (never been inspected)
- Merged schools (see below)
Outstanding schools were exempted from routine inspection in 2010 until last term. Consequently, there are a number of schools in the always outstanding category that have not been inspected for many years. Early signs are that it is tough to maintain the outstanding rating.
When is a school a new school?
The difficult bit of this exercise is consistently identifying a school over time.
Although this has always been an issue, it has become increasingly frequent since the advent of academisation.
Let’s take an example of a community school judged inadequate that closes and re-opens as a sponsored academy. There is a new governing body, a new leadership team and (in the early days of the Academies programme at least) new buildings.
However, the pupils (largely) remain the same.
Legally, the school is a new one. A new school identifier (URN) is issued and the school starts afresh without any inspection history. More on this can be found here. However, since 2018 Ofsted has included inspection judgments of predecessor schools in their statistical publications.
For the purpose of this blogpost, we link together the inspection histories of schools with their predecessor school(s). We leave aside schools which have undergone a merger with one or more other schools. This largely follows the approach of Ofsted has taken since 2018 to their reporting of inspection outcomes.
In most cases, URNs change when two schools merge. However, sometimes one school incorporates another and the URN of the former does not change. These sorts of cases are difficult to deal with and we’ll return to this later.
School inspection histories
Now let’s look at some numbers.

Of all the schools open in January 2022, 38% of schools were found to have always been judged good or better since 2005/06. This includes 6% of schools which had always been outstanding over this period.
A slightly higher percentage of secondary schools (8%) were always outstanding although a slightly lower percentage (34%) had always been good (including always outstanding).
Nursery and special schools were more likely than primary and secondary schools to have always been judged good or better.
369 schools (less than 2%) have never been judged to be good or better.
Almost 400 schools were classified as mergers. These are schools with previous inspection histories that have joined together. With infinite time and snacks I could probably disentangle some of these.
Just over 300 schools (1%) were new, in other words had yet to be inspected.
Leaving aside the new schools, there are other schools which have only ever had one full inspection since 2005/06. This includes schools opened relatively recently and schools which were judged outstanding and for which the routine inspection exemption applied for most of the period we are looking at.
If we only include schools with more than one full inspection, our results change slightly. The number always judged outstanding falls from 1,281 to 743 and the number less than good from 369 to 327.

Regional differences
Below we show the percentage of schools always judged good or better for primary and secondary schools by region.

44% of primary schools in London and 43% in the North West have always been judged better than good. This compares to 28% of primary schools in the West Midlands and 32% in the East Midlands.
London also leads the way for secondary schools. 50% have always been judged good or better. This compares to 23% in the North East and Yorkshire and Humber [4] and 28% in the West Midlands.
The chart also reveals larger differences in Ofsted ratings between primary and secondary schools in the north compared to other regions.
Disadvantage
No analysis of Ofsted inspection judgments can be complete without considering their association with school-level measures of disadvantage.
For this, we use the percentage of pupils eligible for free school meals in January 2021.
There are some limitations with this.
Firstly, we’re looking at inspection histories between 2005 and 2021 and the rate of disadvantage at any particular school may have changed substantially during this time. We looked at how eligibility changed at small area level between 2002 and 2016 in this blogpost.
Secondly, changes to free school meal eligibility in recent years affect its comparability to previous years.
These issues notwithstanding, there is a clear social gradient between school inspection histories and school-level disadvantage.
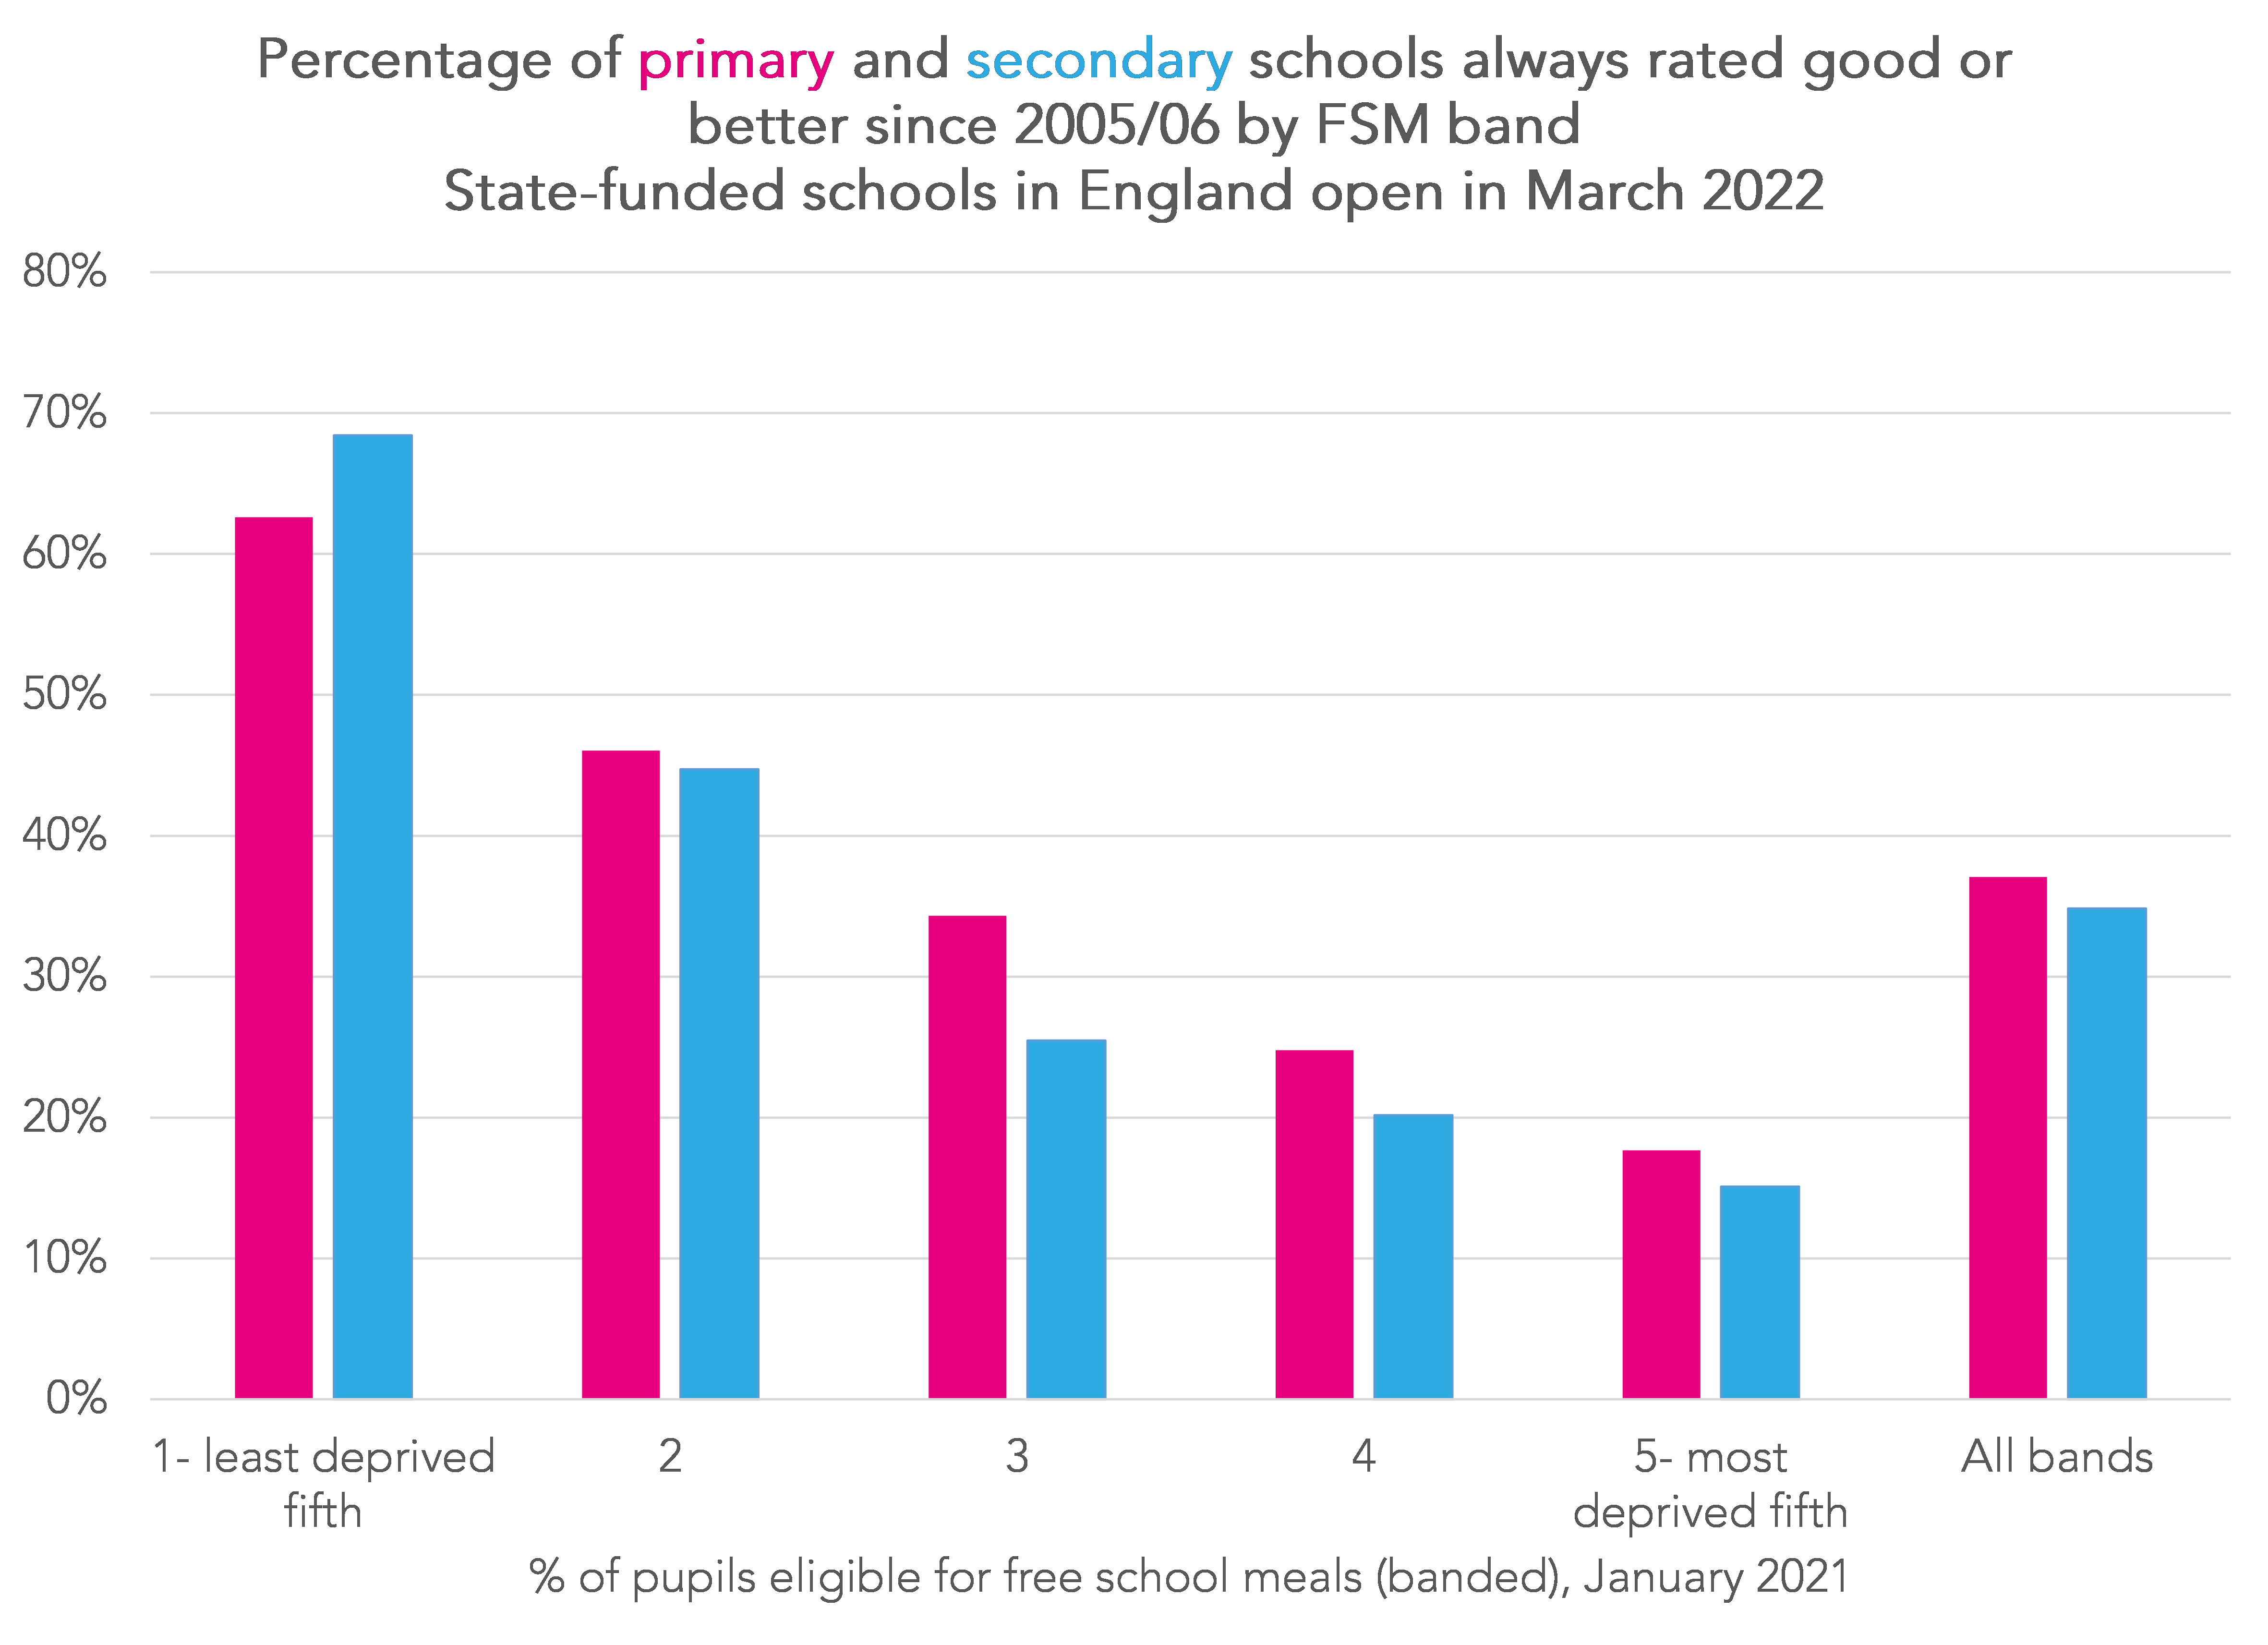
68% of schools in the least deprived fifth of secondary schools have always been rated good or better. This compares to 15% of schools in the most deprived fifth.
In fact, as Table 4 of the appendix shows, there were almost as many secondary schools in the most deprived fifth that have never been judged good or better (13%).
School type
Finally, we show a breakdown of historic inspection outcomes by current school governance in Table 5A of the statistical appendix. This will have changed for many schools since 2005 (and particularly since 2010 when academy conversion became possible).
Some schools, particularly free schools, studio schools and university technical colleges, are relatively recent introductions to the English education system and so would not have been open in 2005. As a consequence, in Table 5B we filter out schools that had not already been inspected by September 2010.
This shows that there are 266 schools that have never been judged good or better and which were first inspected prior to September 2010. Most of these (203) are now sponsored academies.
This seems to be a reasonably large reduction since Ofsted identified 490 “stuck” schools in its 2018 annual report and which we looked into here.
Summing up
There have been four inspection frameworks for schools since 2005.
Over that period, 38% of currently open schools have always been judged to be at least good overall. This includes 6% of schools which have always been judged outstanding but which, until recently, have been exempt from routine inspection.
Questions about the fairness of inspection outcomes for schools with disadvantaged intakes are not new. Ofsted attempted to defend their judgments here.
But it does seem to be the case that despite the changes to the inspection framework over the years, schools with the least disadvantaged intakes tend to be more likely to have always been judged good or better.
- As at 28th February 2022
- The most recent inspection contained in the Ofsted management information data took place on 27th January 2022
- This includes schools graded satisfactory, requires improvement and inadequate
- Ofsted combines these two regions in their statistical publications
Want to stay up-to-date with the latest research from FFT Education Datalab? Sign up to Datalab’s mailing list to get notifications about new blogposts, or to receive the team’s half-termly newsletter.


What about EAL. I suspect that might be an influence in London especially? I could theorise that deprivation + EAL makes for a better performing school while deprivation with low EAL makes for worse?
As I retired from HMI in 2003/4 my knowledge is far from up- to-date. However, prior to that date, my colleagues and I informally noted the lack of HMI and AI experience of good quality early years education. We questioned as to whether judgements in that age grouping were somewhat generous as a result. Your data suggests that this may still apply.
To tell the truth, school inspections perform a really significant function and it is really important to value their contribution because it affects our life to a great extent. It is wonderful that Ofsted publishes management information on inspection outcomes for state-funded schools every month because it is so important when school inspections have a serious approach to their work and perform their responsibilities at a high level. Also, these data contribute to better functioning of schools and increase the probability that staff will not be negligent about their work. Of course, the percentage of currently open schools judged to be at least good overall is quite controversial, but indicates that we have a great deal of truly decent schools. I really hope that this figure will only increase with years and we will see a huge breakthrough in the future.
Any idea how I can get the date of an ofsted inspection? – I have the name of the school and I know it was November 2003. I need the date to correct an issue with my employment history.
Hi Erika. You should be able to get the date from here: https://reports.ofsted.gov.uk. If you look up the school name it’ll show you all of the inspection reports, with dates, since the school opened.