Last week saw the publication of national Key Stage 2 results for the first time since the pandemic.
At the headline level, these showed a dip in attainment at the expected standard in maths and writing. Perhaps unexpectedly, attainment in reading increased slightly.
But what do we make of it?
Are the differences compared to 2019 small enough to resolve themselves over time with a little additional support? Or do they reveal a significant problem that needs to be urgently addressed?
I can’t promise to answer this but we can have a go at thinking about it.
Data
As part of FFT’s 2022 Early Results service, we collected Key Stage 2 results from over 1,000 primary schools. Of those, almost 700 had previously shared their data with us when the assessments were last carried out nationally in 2019. There were around 36,000 pupils in each cohort.
In the analysis that follows, we use scaled scores from tests in reading and maths, and teacher assessments in writing. As per Performance Tables, pupils who are not tested due to working at lower levels are allocated default scaled scores ranging from 61 to 79 based on teacher assessment. Teacher assessments are also assigned notional scores.
Pupils who score 100 or above are denoted as having achieved the expected standard. Pupils who score 110 or above (or classified as “Greater Depth than Expected” in writing) are considered to have achieved a higher standard. Pupils who are absent or not tested for a variety of other reasons are counted as if they hadn’t achieved the expected standard in line with School Performance Tables[1].
Results
First of all let’s look at average attainment in the 700 schools for which we have 2019 and 2022 data.
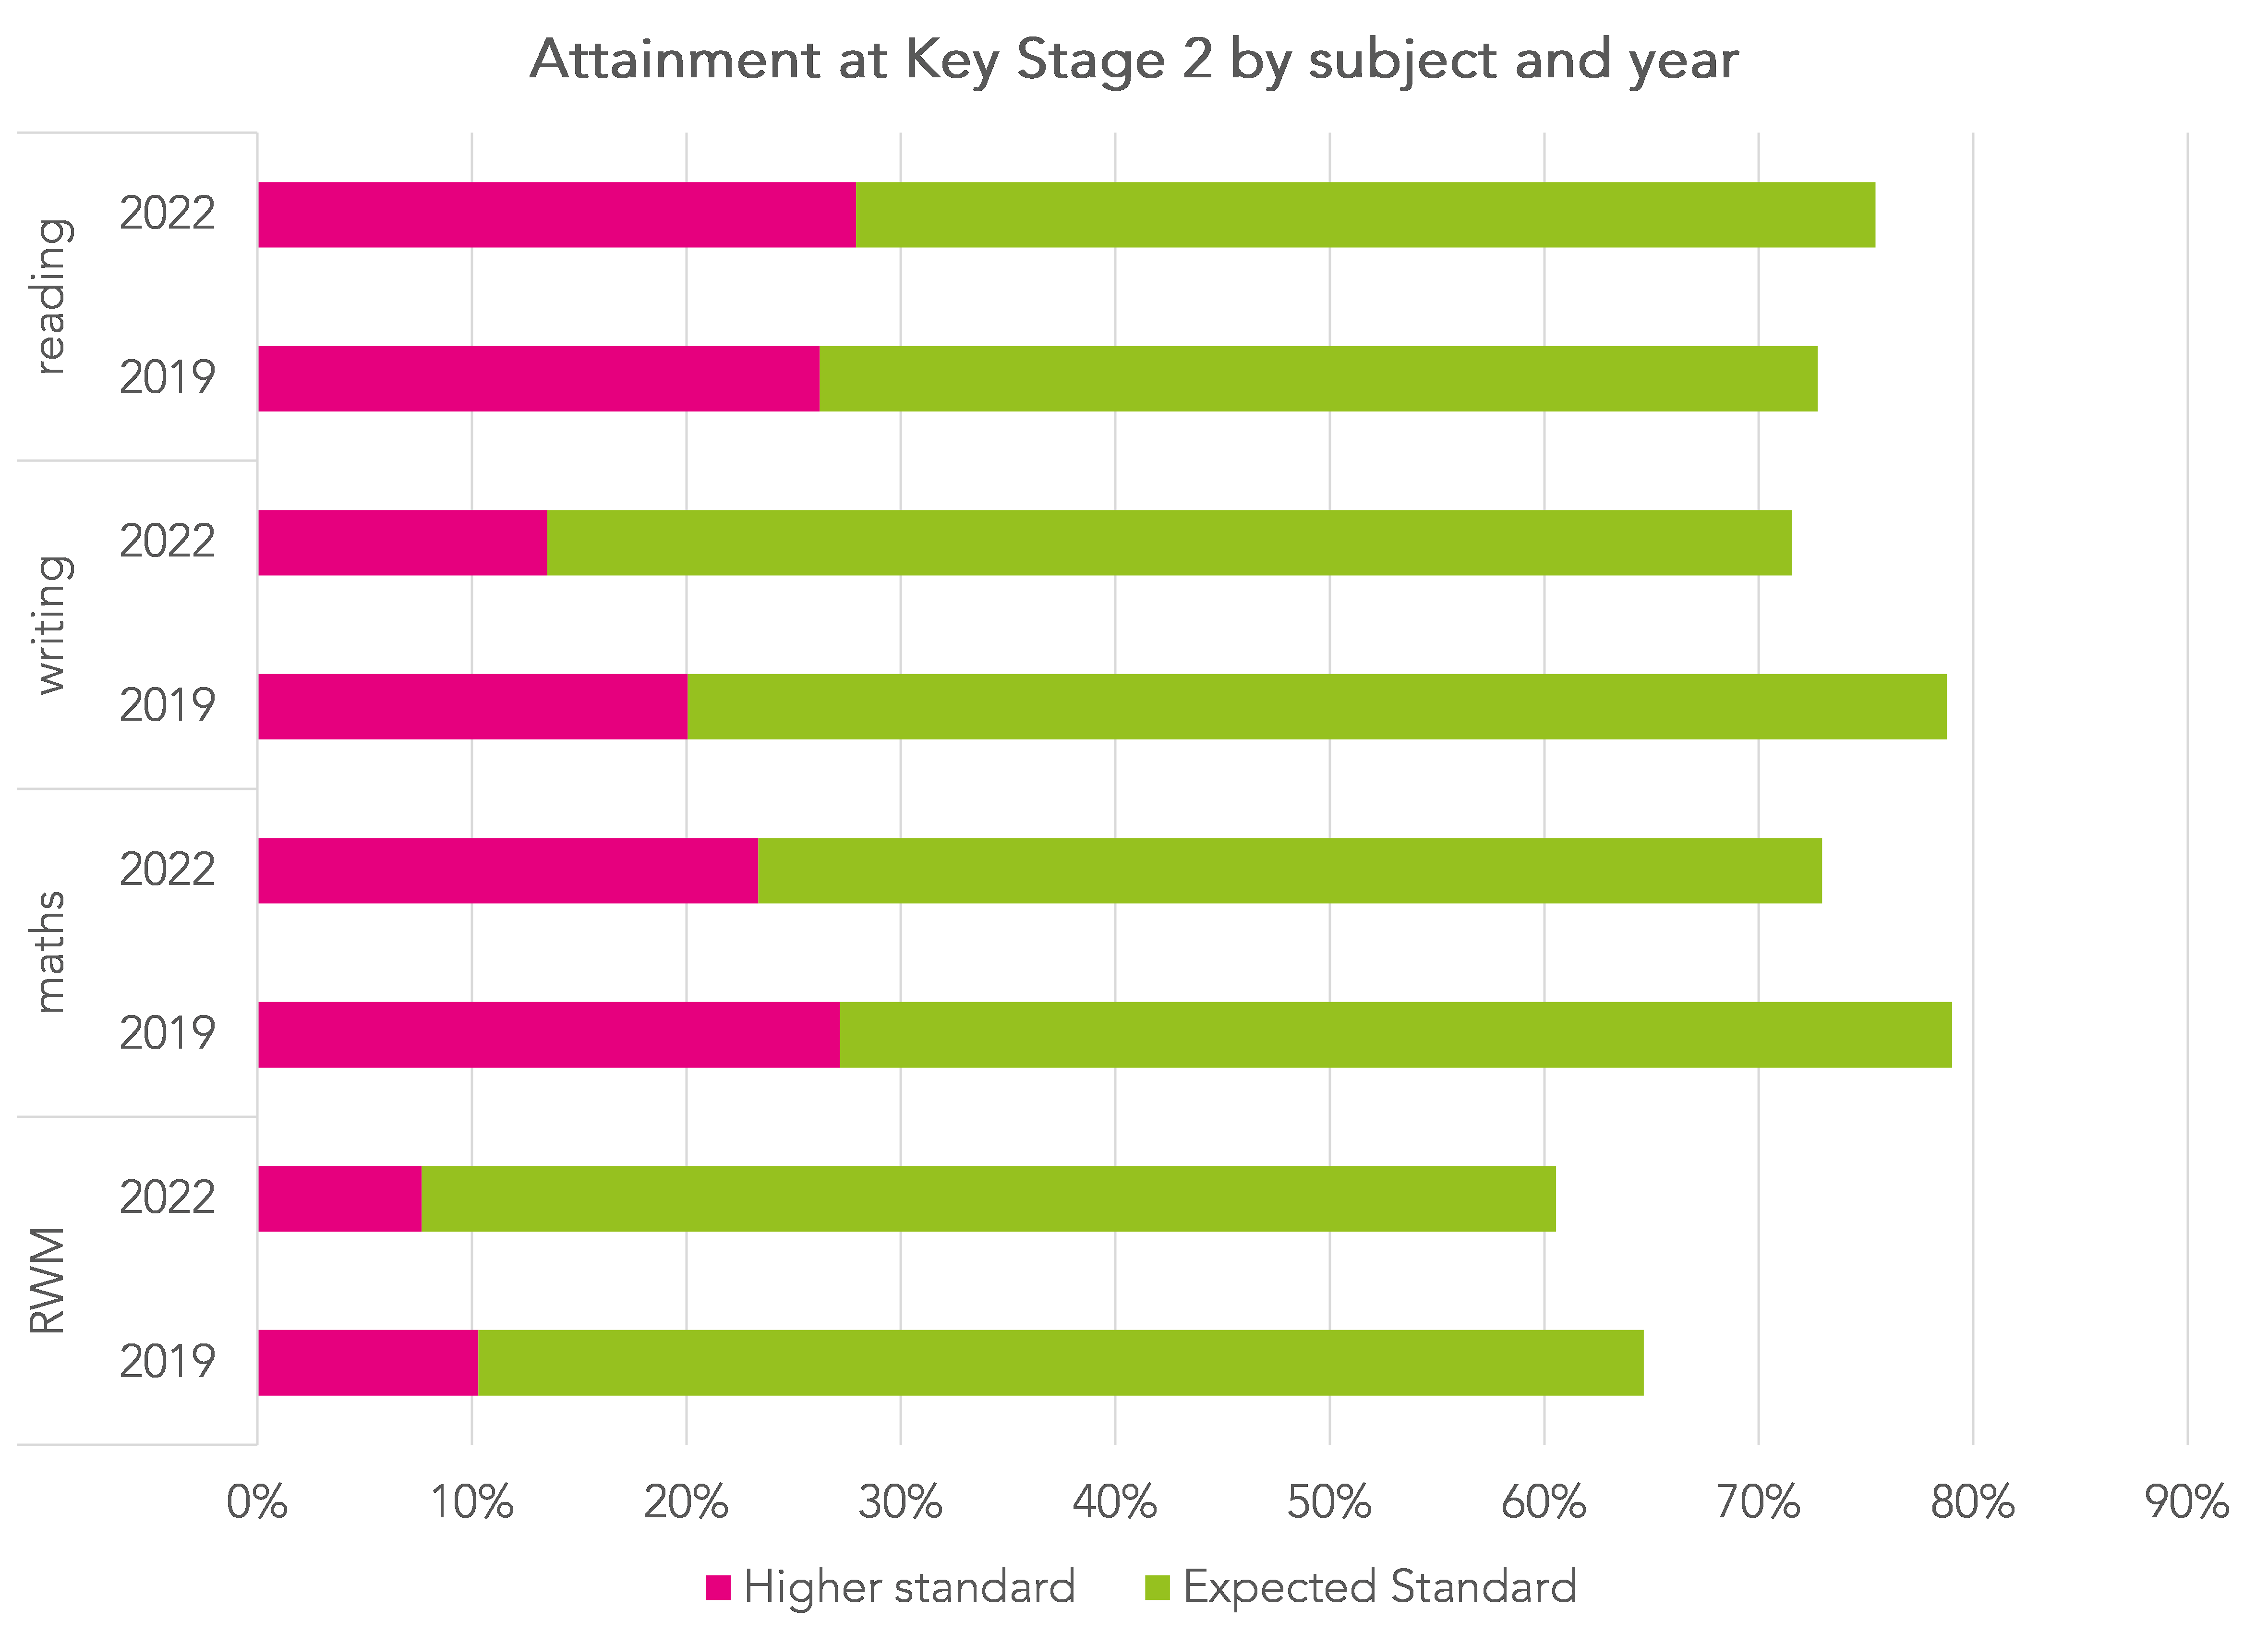
Attainment at the expected standard (or above) at this set of schools in 2022 was slightly higher than the national average:
- Reading 75% (national 74%)
- Writing 72% (national 69%)
- Maths 73% (national 71%)
- Reading, writing and maths 61% (national 59%)
However, attainment was almost identical to the national average in 2019:
- Reading 73% (national 73%)
- Writing 79% (national 79%)
- Maths 79% (national 78%)
- Reading, writing and maths 65% (national 59%)
Therefore we need to bear in mind the slightly higher level of attainment at these schools in 2022 when thinking about differences compared to 2019.
For completeness, here are the figures for the higher standard at these schools compared to 2019 (national figures not yet available):
- Reading 28% (2019 26%)
- Writing 14% (2019 20%)
- Maths 23% (2019 27%)
- Reading, writing and maths 8% (2019 10%)
Distributions of test scores
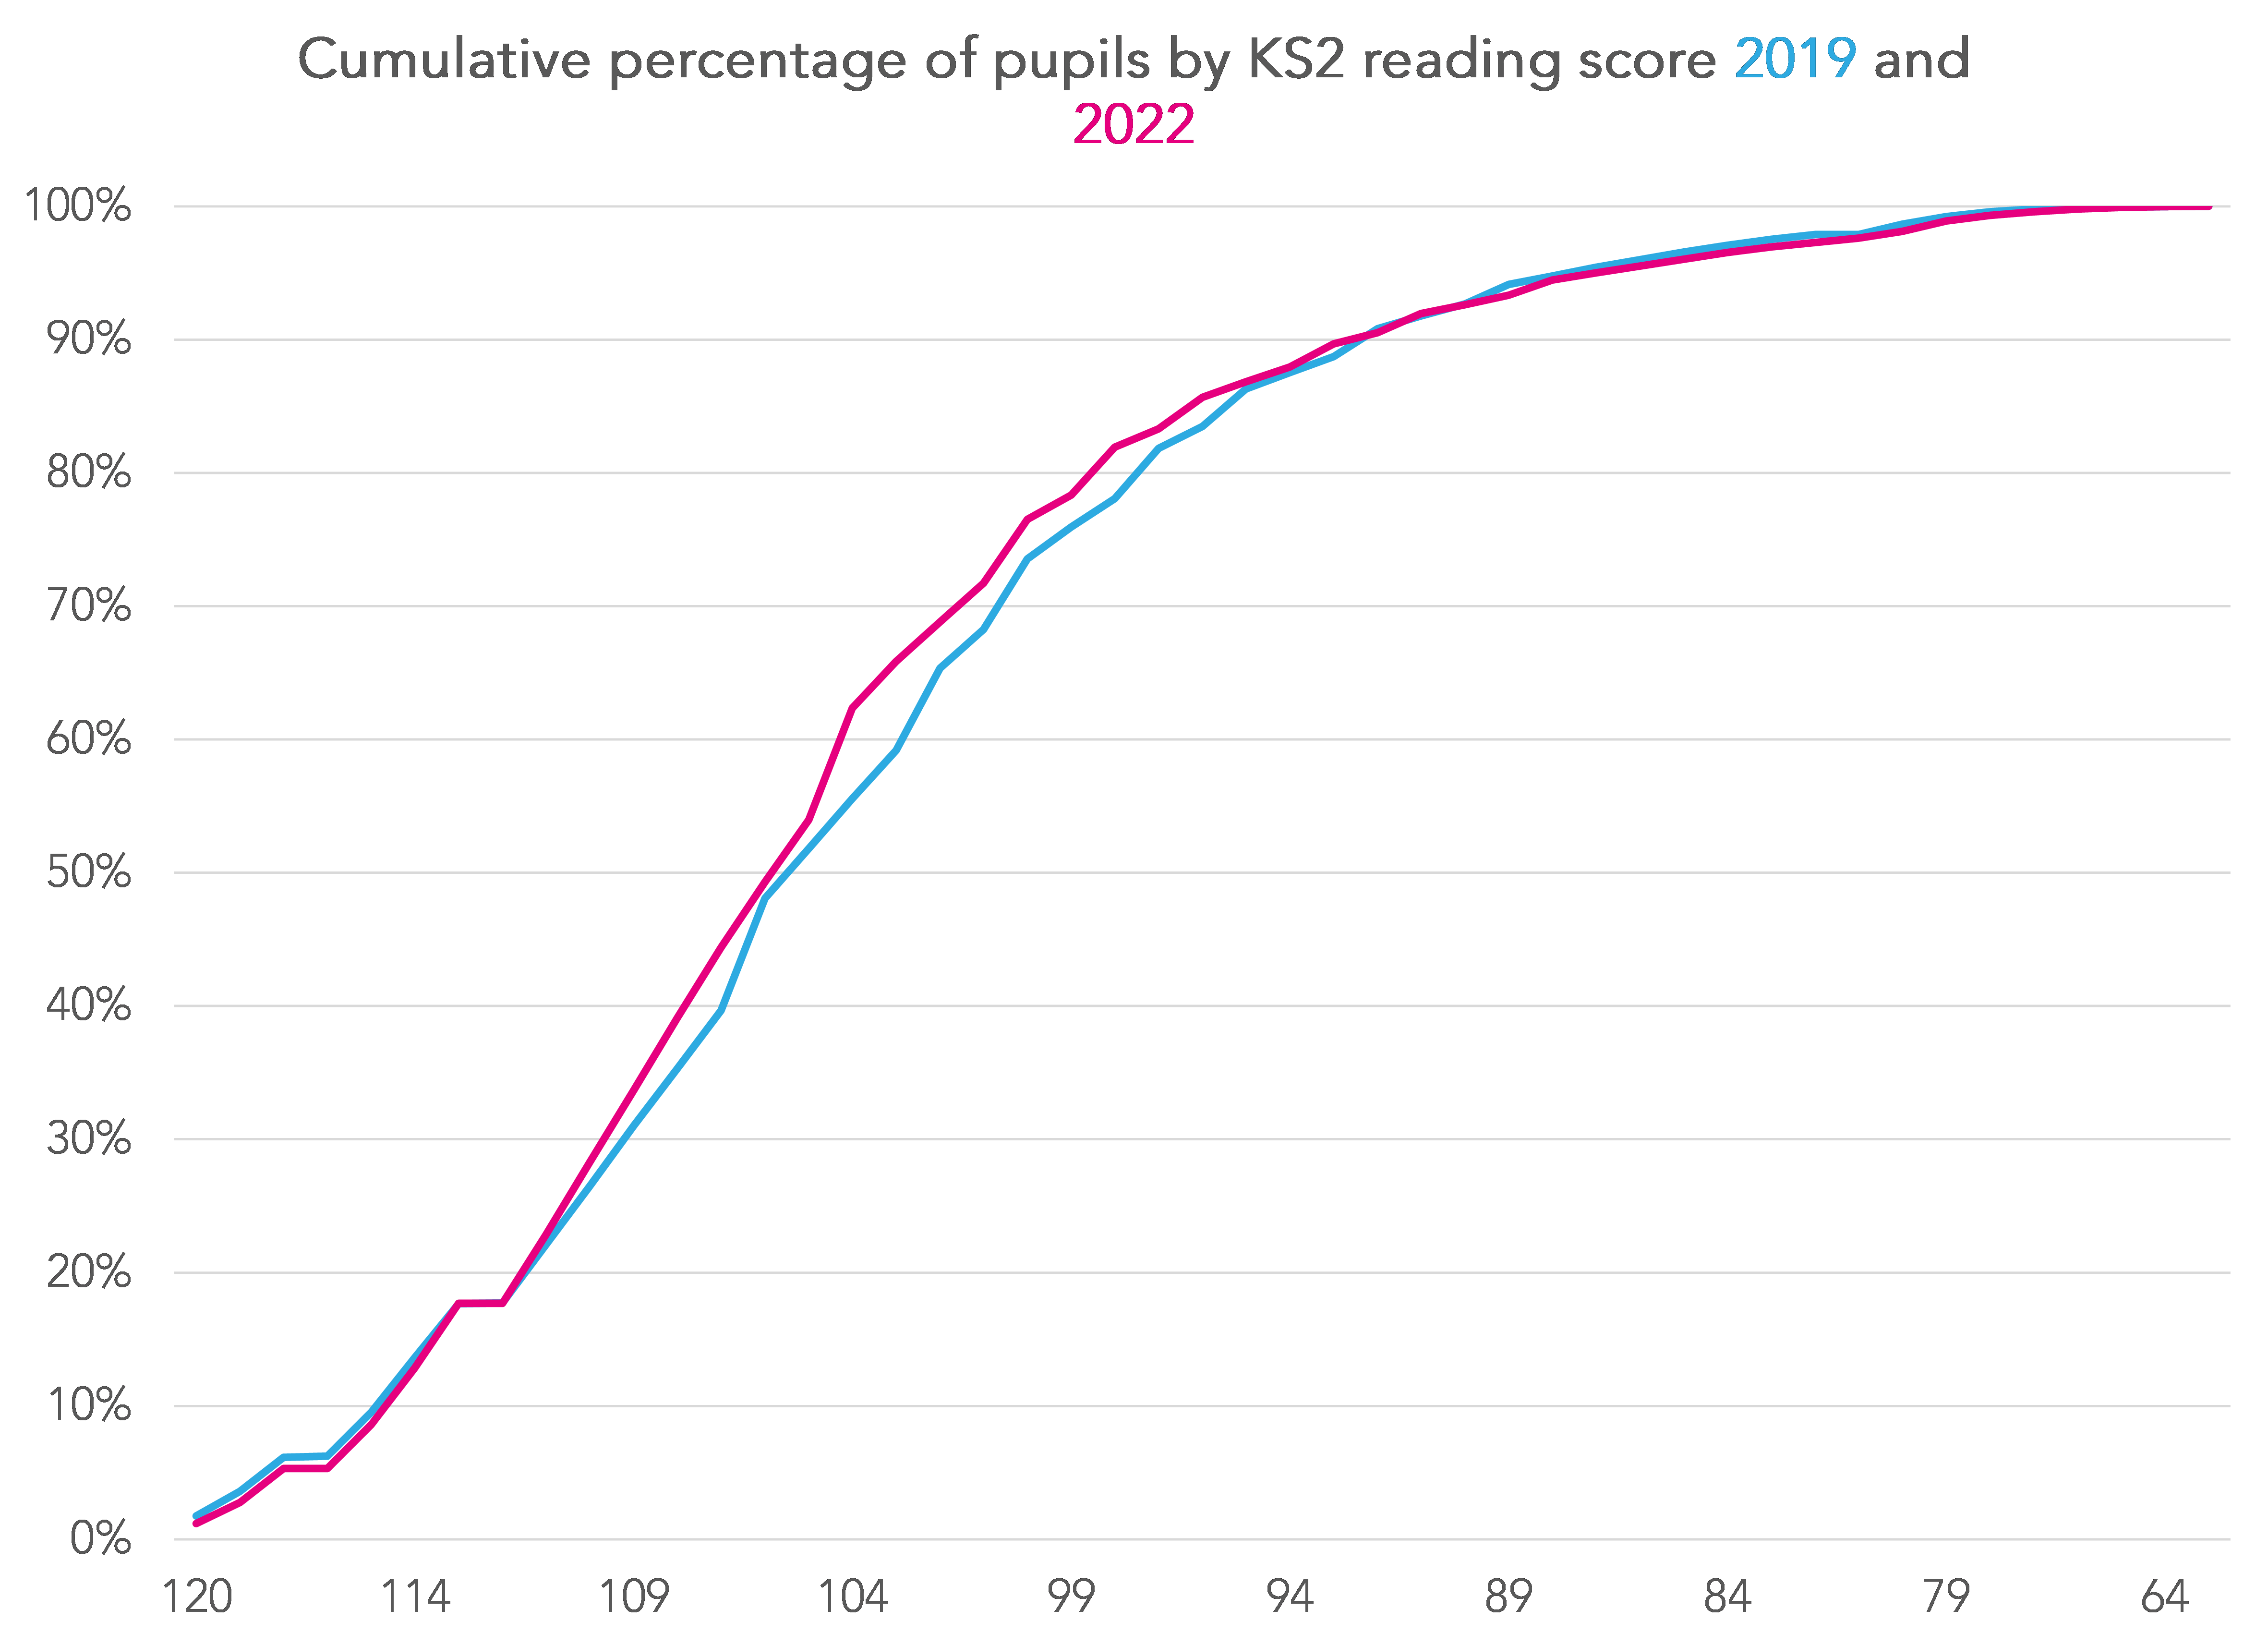
The following two charts show the cumulative distributions in the test scores of reading and maths in 2019 and 2022.
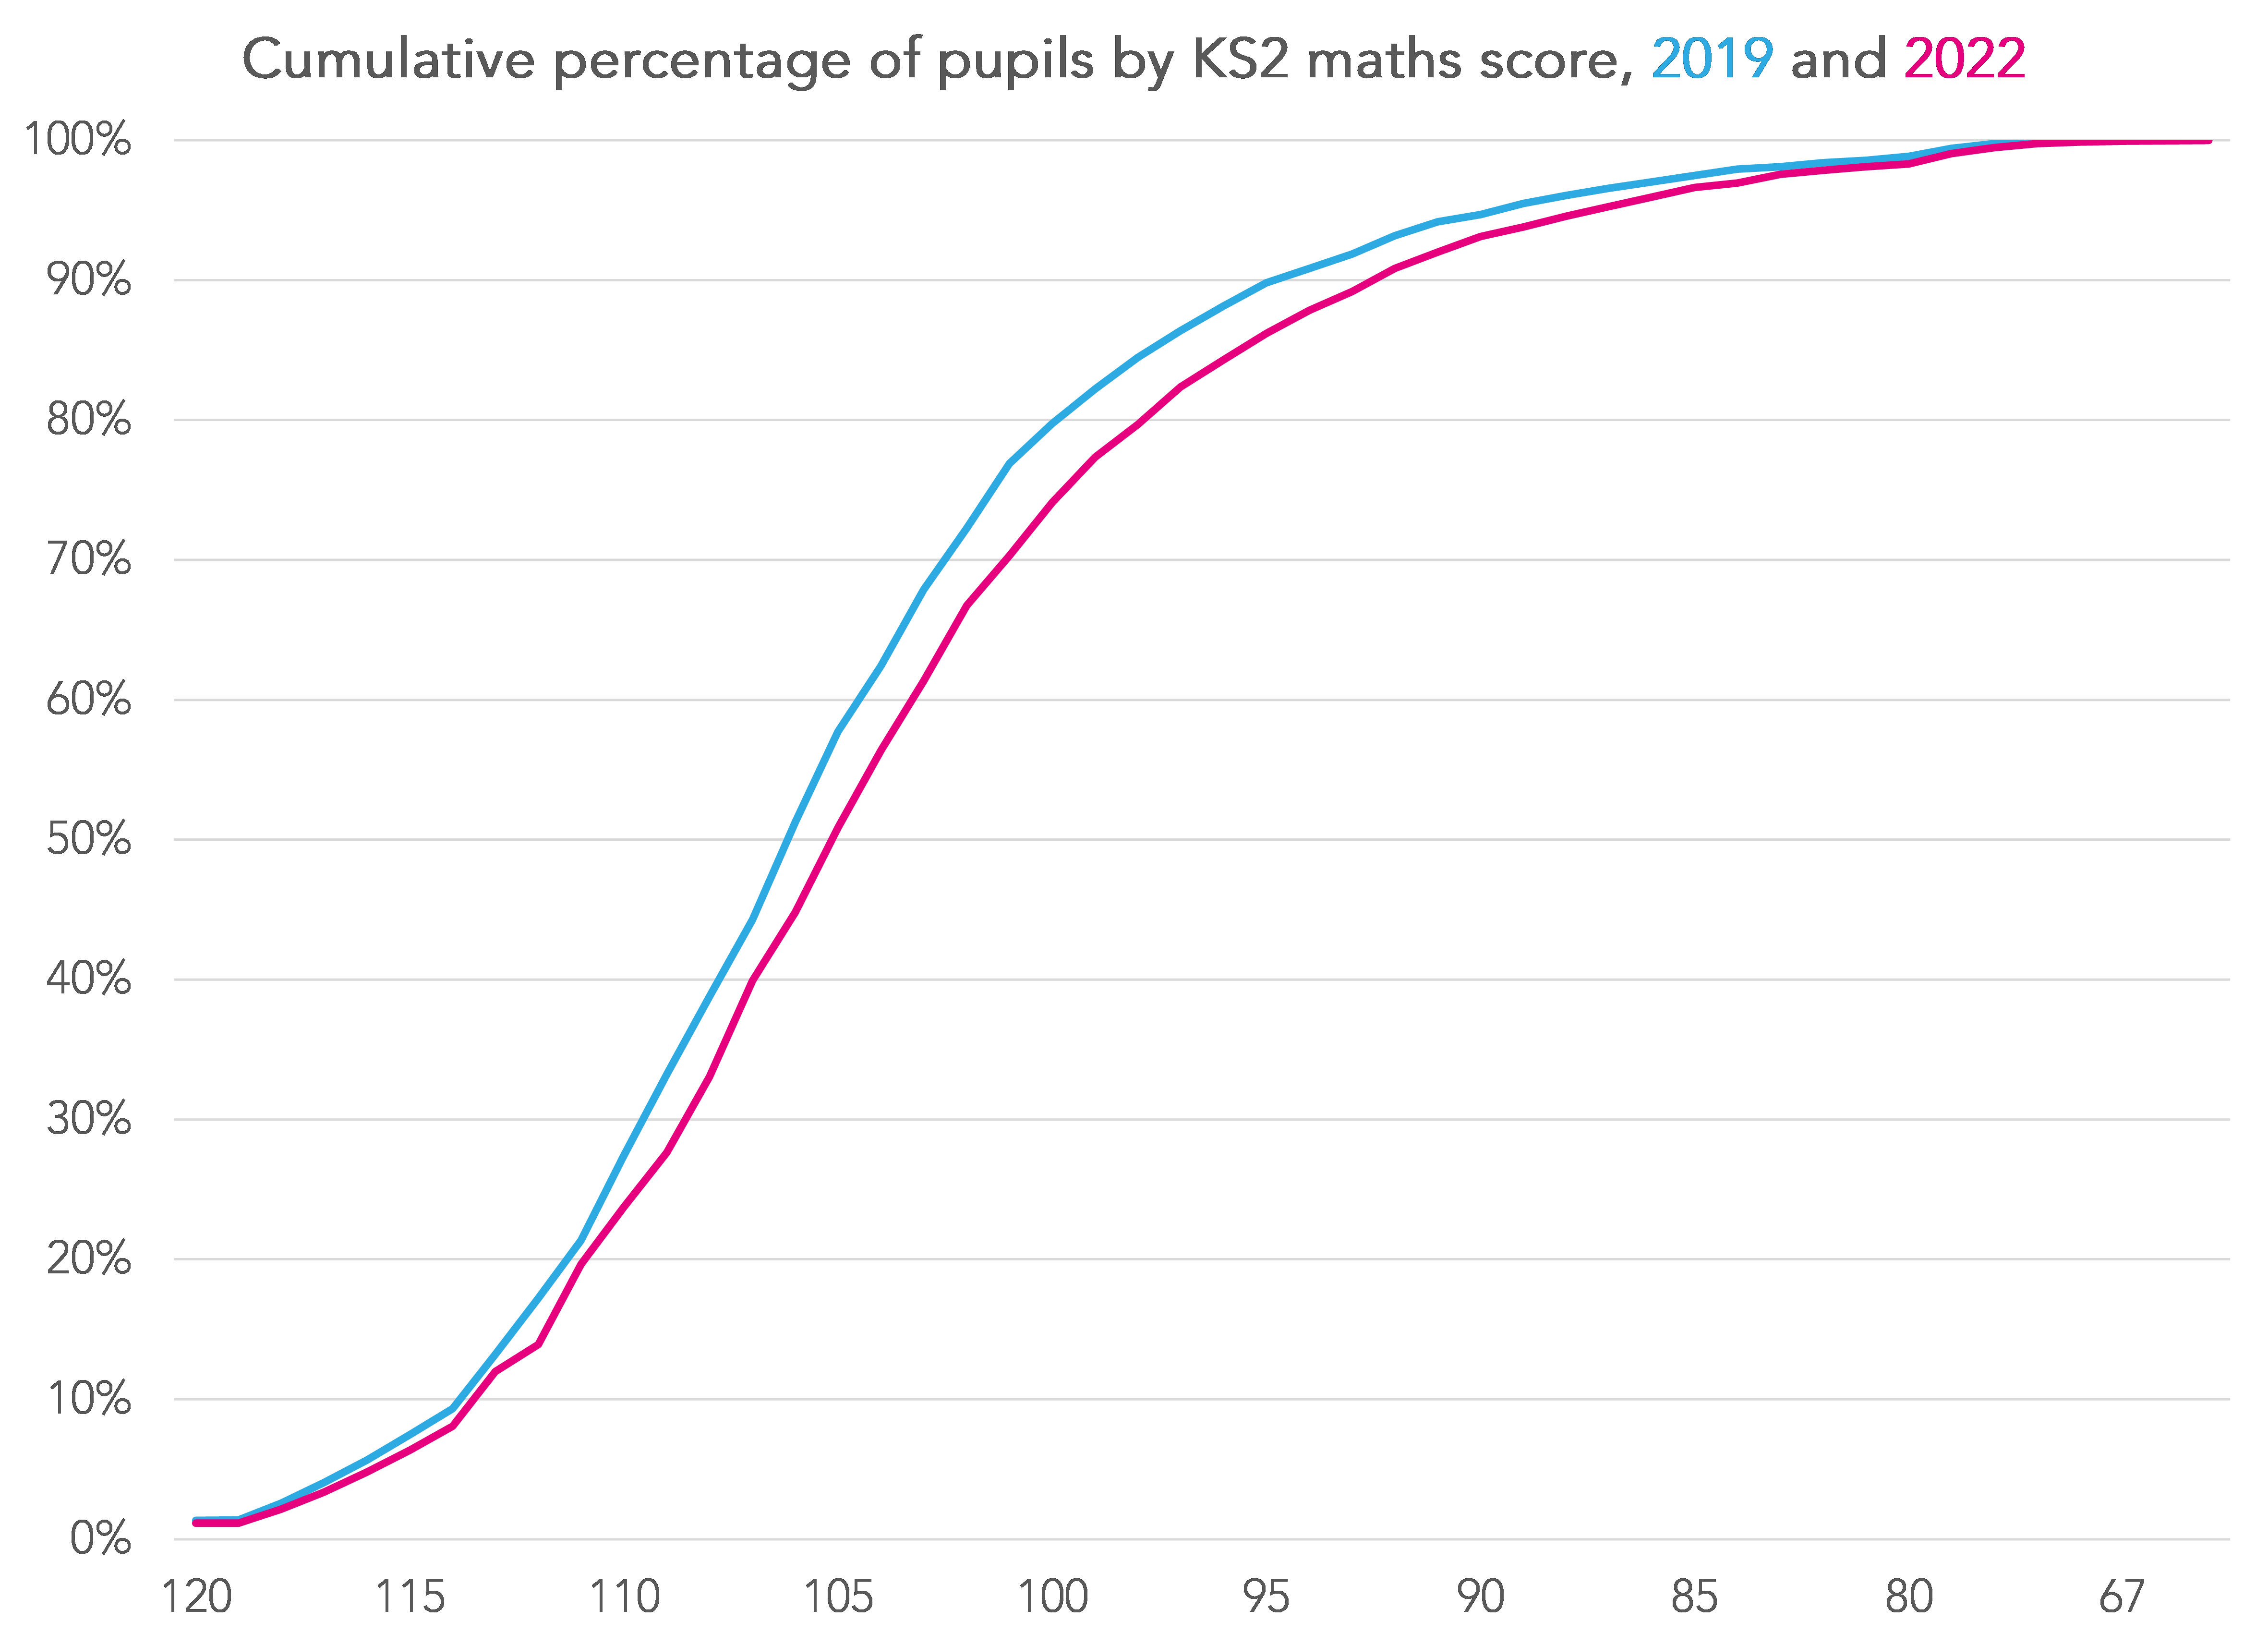
The second chart (maths) shows that the 2019 (blue) line is higher than the 2022 line for a large swathe of the middle of the distribution indicating lower scores in 2022.
By contrast, the lines for reading largely overlap with some indication that attainment was higher in the middle of the distribution in 2019.
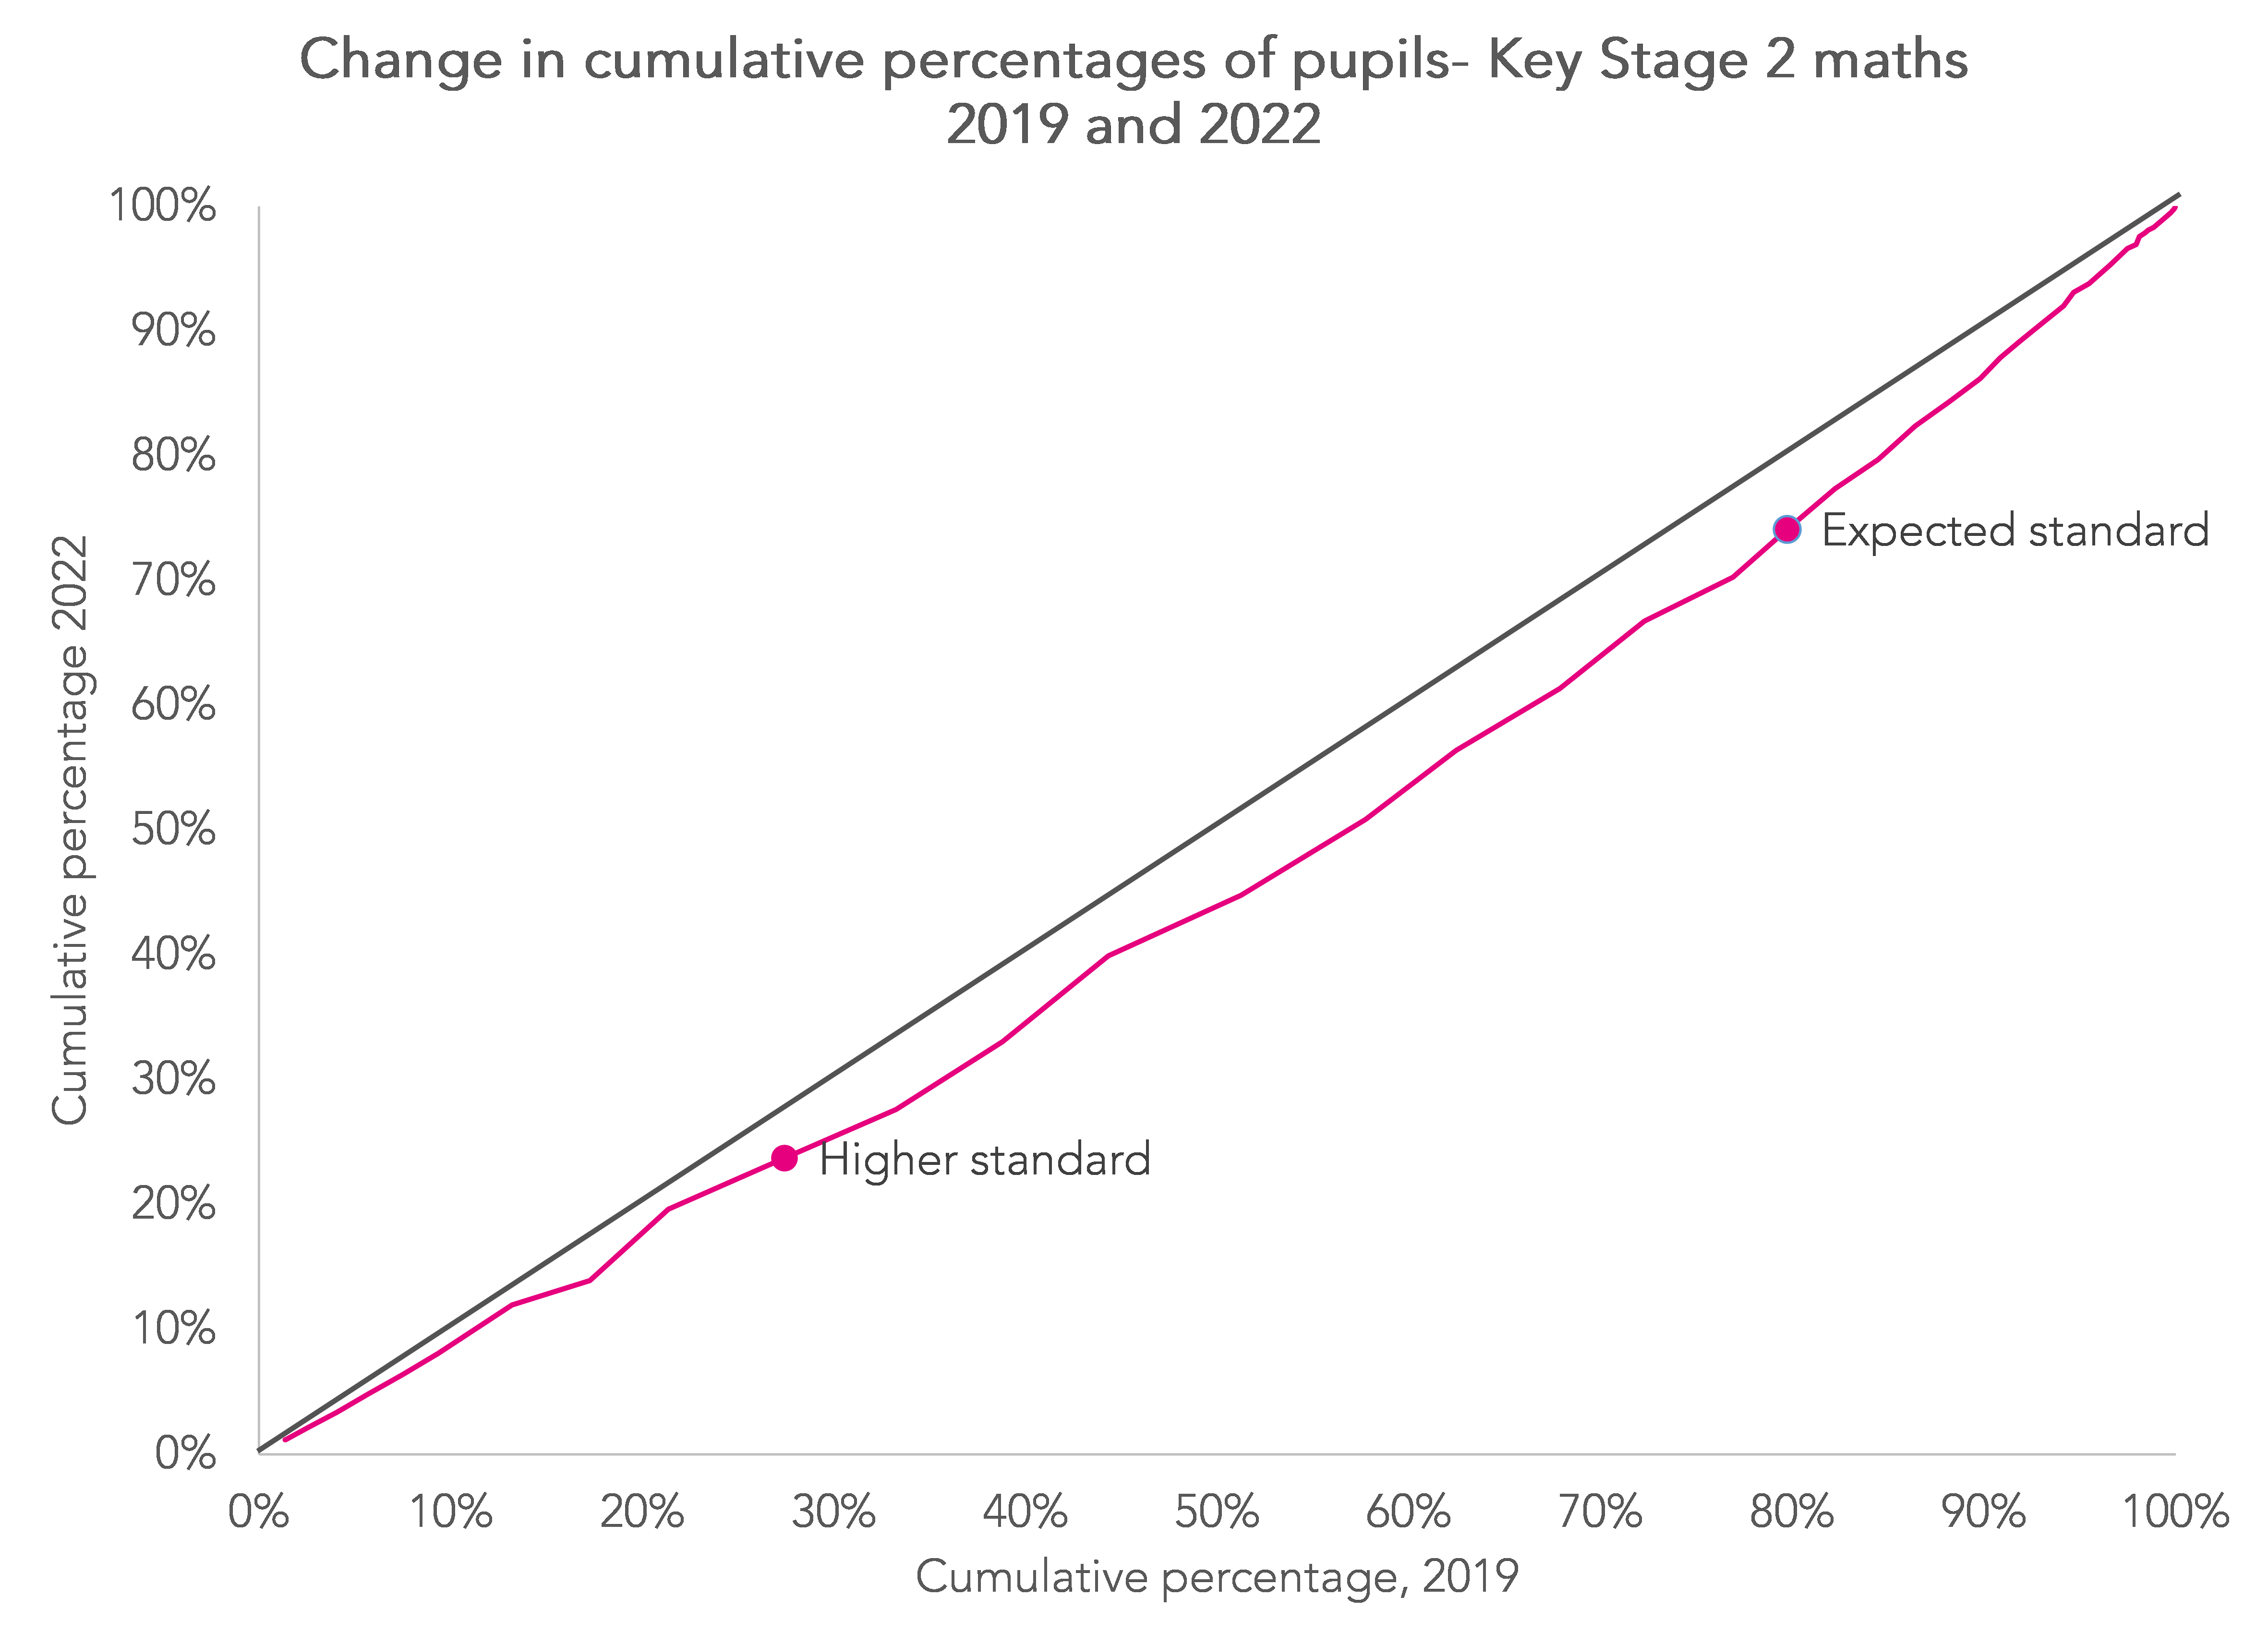
It may be easier to view the change in maths using the following plot. The puce line shows how the distribution in 2022 has changed since 2019 (denoted by the solid line). The further below the diagonal line, the lower the percentage of pupils at that point in the distribution in 2022.
At the very tail of the distribution, and imperceptible to the human eye, the proportion of pupils working below the standards of the test increased slightly in 2022 from 1.3% to 1.9% in reading and from 1.2% to 1.7% in maths.
How big are the differences?
In the table below I show differences in scaled scores between years. I also convert them into standardised units by dividing by the standard deviation (SD) from 2019.
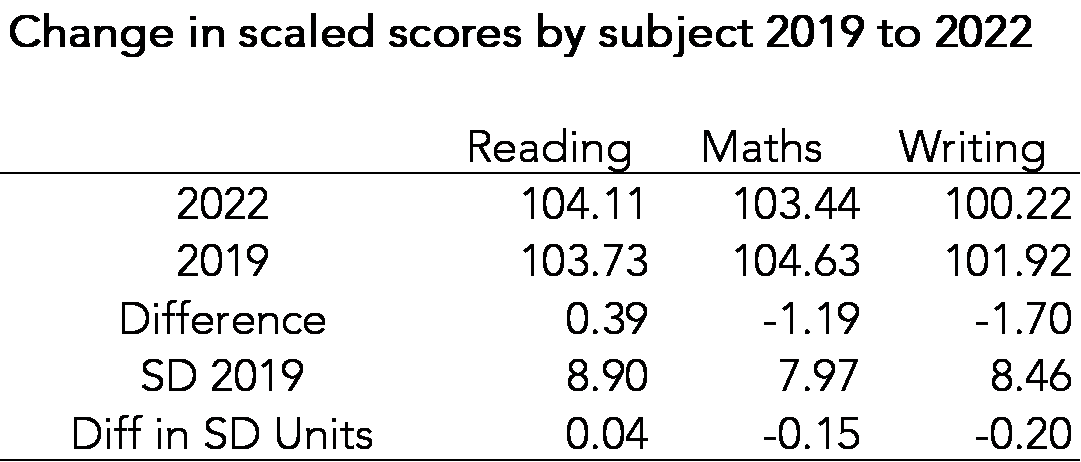
Are these differences large or not?
Sticking just with the raw differences, the difference in average maths scores between 2019 and 2022 for our sample of schools is (almost) identical to the difference in average maths scores between pupils born in February and pupils born in August. So we could say that the difference in attainment between 2019 and 2022 is equivalent to that associated with being born 6 months later.
Thinking about it another way, the EEF toolkit has a table which converts standardised differences as months of progress. Taking this at value suggests that a difference of -0.15 SD is equivalent to 2 months progress and one of -0.2 SD is equivalent to 3 months progress.
The toolkit assumes that one year of instruction at primary school is equivalent to around 1SD per year. But I’m always reminded of a talk given by Dylan Wiliam a few years ago[2]. He quoted another (American) study [3] which claimed that this varied by age and that the annual “growth” in academic attainment of 10-11 year olds was more like 0.4 SD in reading and 0.56 SD in maths.
If those findings are applicable to the UK then in those terms -0.15SD seems larger- over a quarter of a year- so more than 3 months progress.
We found similar standardised differences in attainment between writing and maths at Key Stage 1 between 2019 and 2022. But as annual growth for younger pupils tends to be larger then perhaps the differences at Key Stage 2 are more concerning.
That said, 0.56 SD at KS2 is equivalent to around 4.5 scaled score points in the KS2 maths test. I’ll leave you to think whether that feels like a year of academic development in maths bearing in mind the tests do not measure perfectly.
The disadvantage gap
I’m not keen on comparing change in the disadvantage gap between 2019 and 2022 due to changes in eligibility criteria resulting from the introduction of Universal Credit.
But let’s do it anyway.
29% of the cohort were classified as disadvantaged in 2022 compared to 30% in 2019.

Based on this sample of schools, attainment gaps appear to have widened in all subjects.
Conclusions and caveats
Compared to 2019, attainment at Key Stage 2 fell in maths and writing and improved in reading.
On the surface, the dips in maths and writing among schools in our sample don’t feel particularly large: 1.2 points in maths and 1.7 points in writing. These are likely to be slightly larger in the full population of schools.
These differences may not seem particularly large when thinking about the results of individual pupils given the measurement error attached to each. However, the assessments cover a wide spectrum of attainment and so even small changes can be meaningful when aggregated over large numbers of pupils. The differences in maths, for example, could be equivalent to more than 3 months of teaching.
And these are just averages. The attainment of some pupils may have been unaffected by the pandemic while others will have been affected to a greater degree.
But we have only really scratched the surface here.
Perhaps the spectre of Performance Tables has meant that schools have done less test preparation this time round and that has contributed to the dip in results.
Perhaps if we looked at areas of the curriculum other than English and maths we’d see even larger effects of the pandemic. Or if we looked at well-being instead.
Perhaps if we didn’t put so much faith in the year-on-year comparability of the tests we’d think differently. Maybe it is fine across the distribution. But maybe they are only really comparable around the expected standard.
- https://explore-education-statistics.service.gov.uk/methodology/key-stage-2-attainment-national-headlines
- It could have been this [PPT] https://www.dylanwiliam.org/Dylan_Wiliams_website/Presentations_files/2019-06-04%20The%20Big%20Evidence%20Debate%20%28Durham%29.pptx
- https://www.mdrc.org/sites/default/files/full_84.pdf
Want to stay up-to-date with the latest research from FFT Education Datalab? Sign up to Datalab’s mailing list to get notifications about new blogposts, or to receive the team’s half-termly newsletter.


Great post thanks for sharing