Back in 2018 we tracked the incidence of special educational needs (SEN) of a single cohort from Reception in 2004/05 to the end of Year 11 in 2016/17.
Here we found that 44% of pupils had been recorded as having SEN during their school career.
For all but their final two years of compulsory schooling, the previous SEN Code of Practice applied. Under this code, SEN were met through School Action, School Action Plus or Statements.
This was superseded by a new Special Educational Needs and Disabilities (SEND) Code of Practice in September 2014. Under this code, statements were replaced with Education, Health and Care (EHC) plans and extended up to age 25. School Action and School Action Plus were replaced with a single category of School Support.
So let’s see how the incidence of SEN has changed since the introduction of the new Code of Practice.
Data
The cohort we follow this time is the first to be admitted to Reception under the new Code of Practice in 2014/15.
Using School Census data for each term[1], we follow this cohort through to the end of Year 7 in 2021/22.
There were 647 thousand pupils in this cohort in January 2015. We include all state-funded mainstream, special (including non-maintained), and alternative provision schools.
The chart below shows how the size of the cohort changed each January up to the end of Year 7.
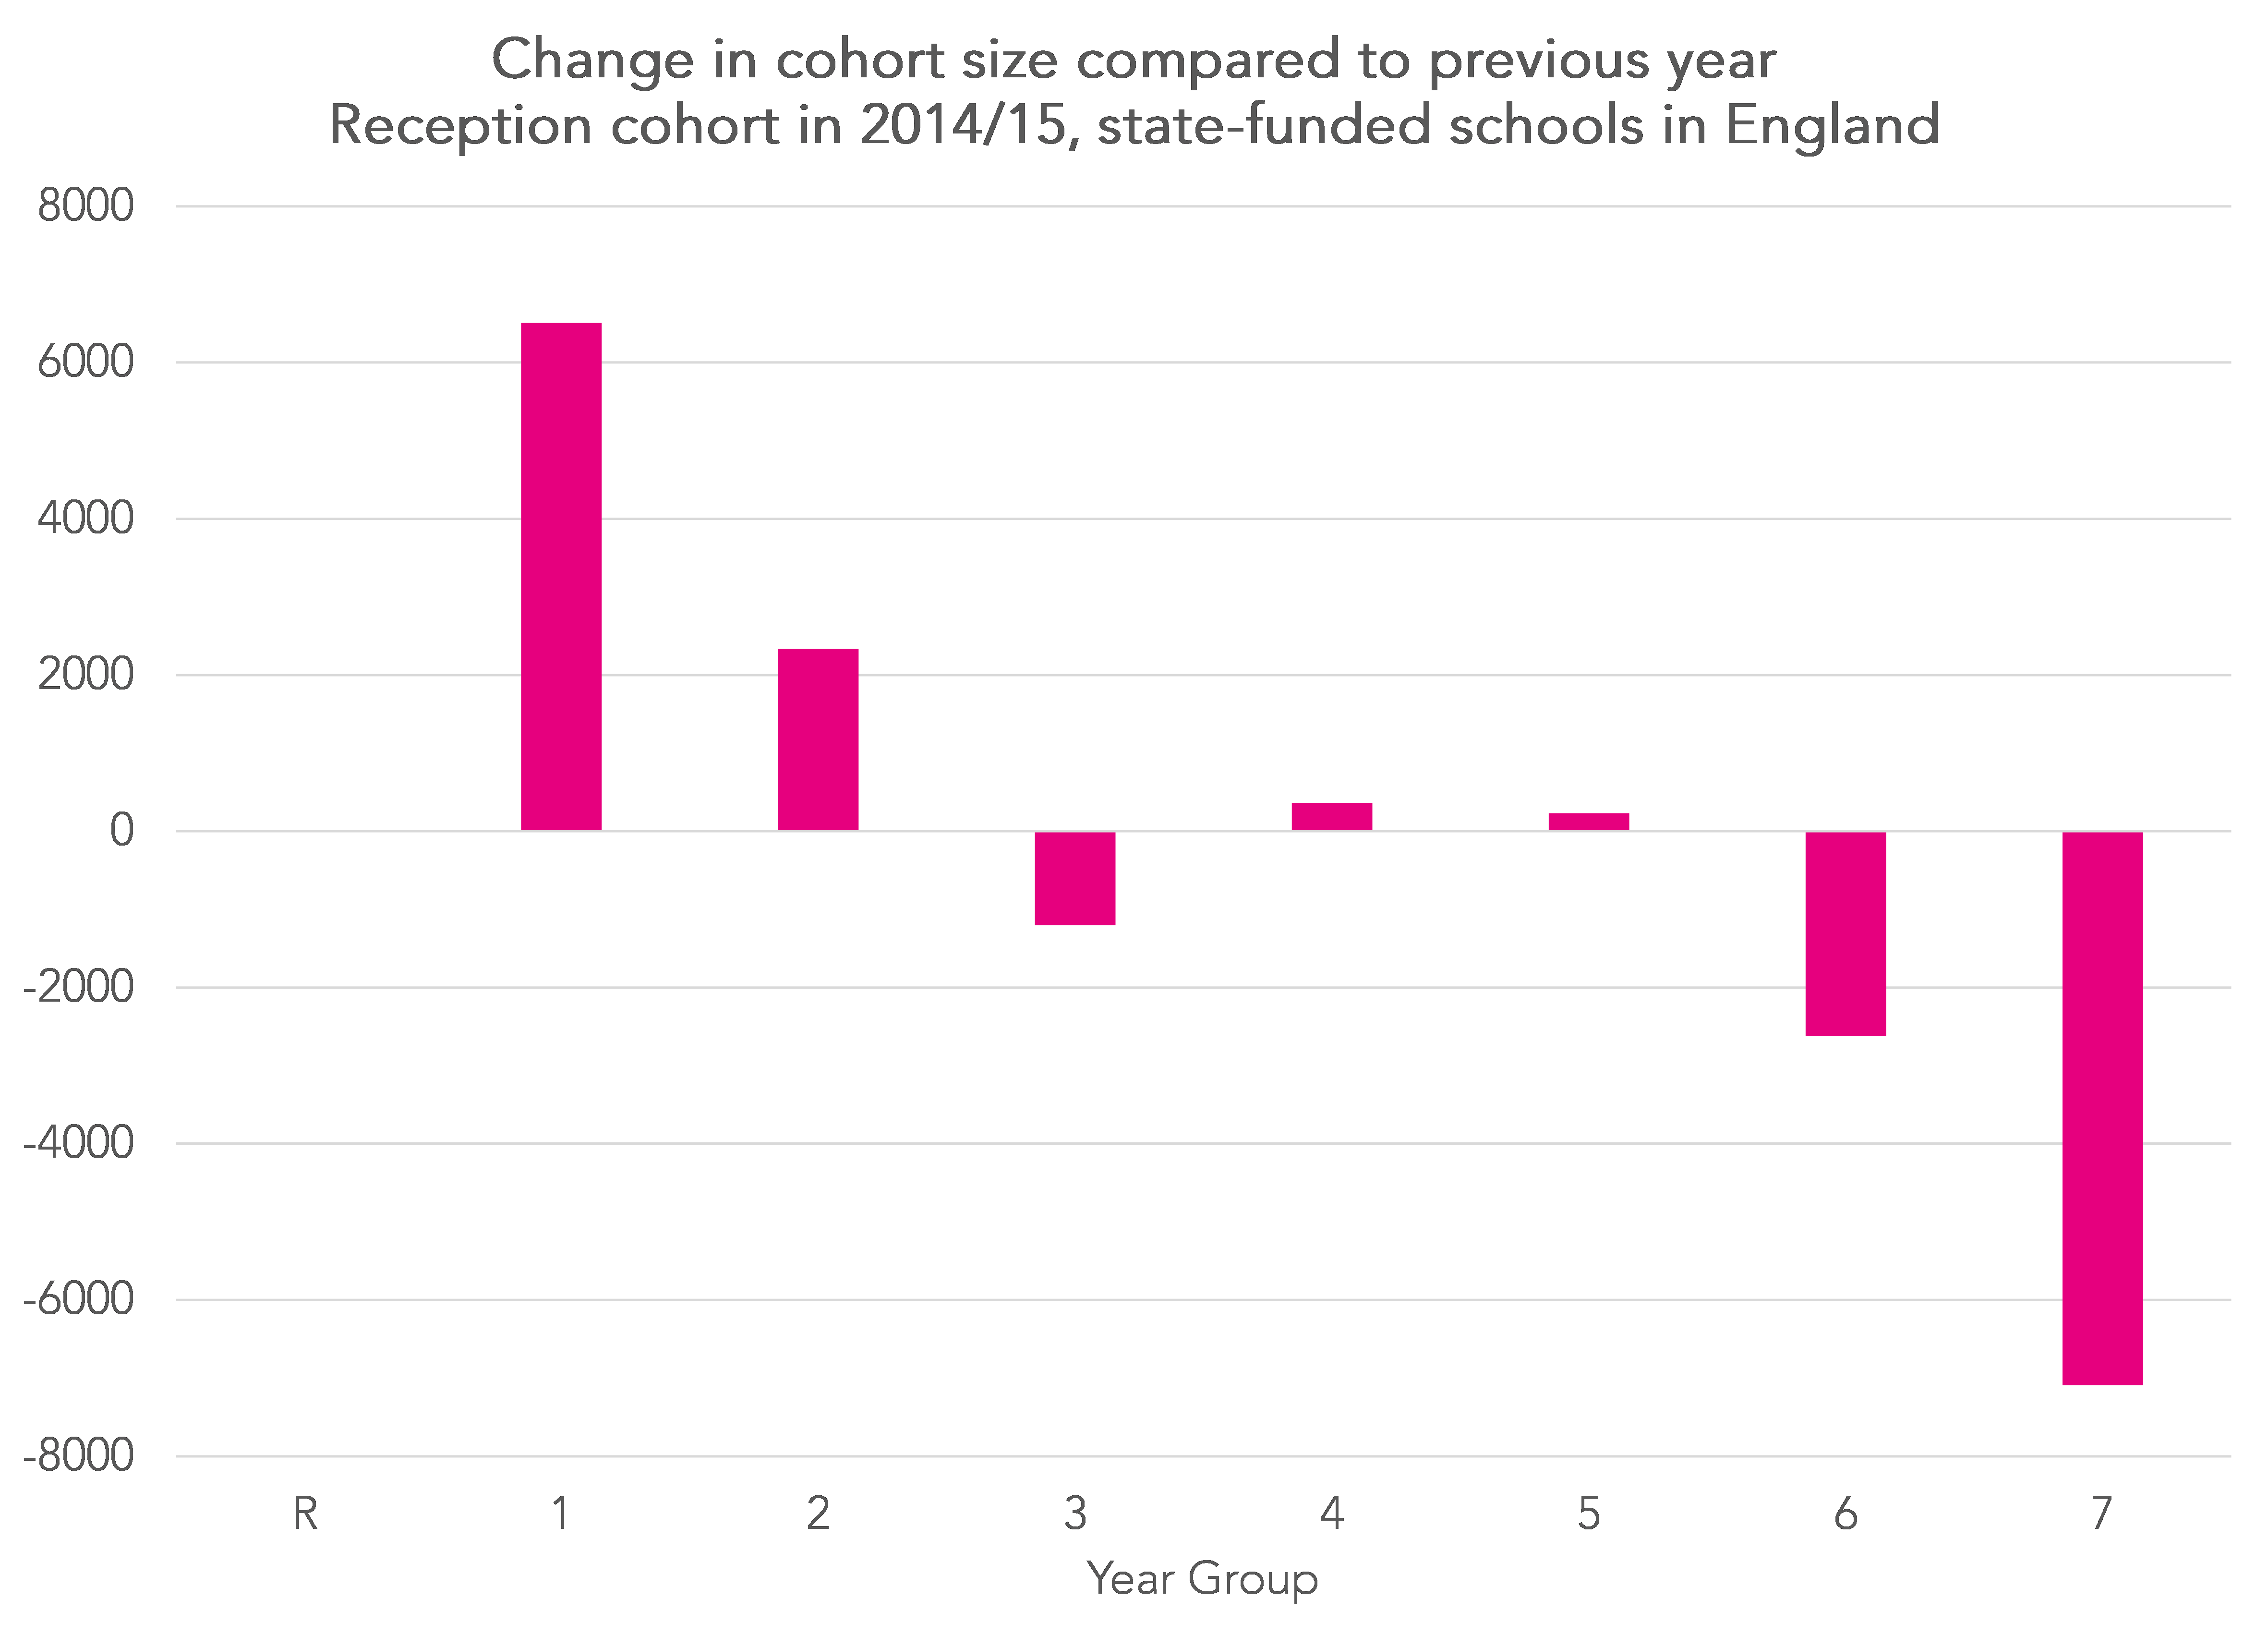
An additional 6,500 pupils join the cohort in Year 1. There was then a decline in pupil numbers after Year 2. It then stabilized but began to fall in Year 6 and, especially, in Year 7. We think this is largely driven by movement into the independent sector.
By the end of Year 7, the size of the cohort was 646 thousand.
The incidence of SEN
For this analysis we include all pupils classified as having SEN (so both pupils with EHC plans and identified as receiving School Support).
Using January School Census data, we show:
- The percentage of pupils identified as having SEN on Census Day (the blue area)
- And separately, the subset identified as having SEN for the first time in the year shown (the green area)
- The percentage previously identified as having SEN but not on Census Day (the dark grey area)
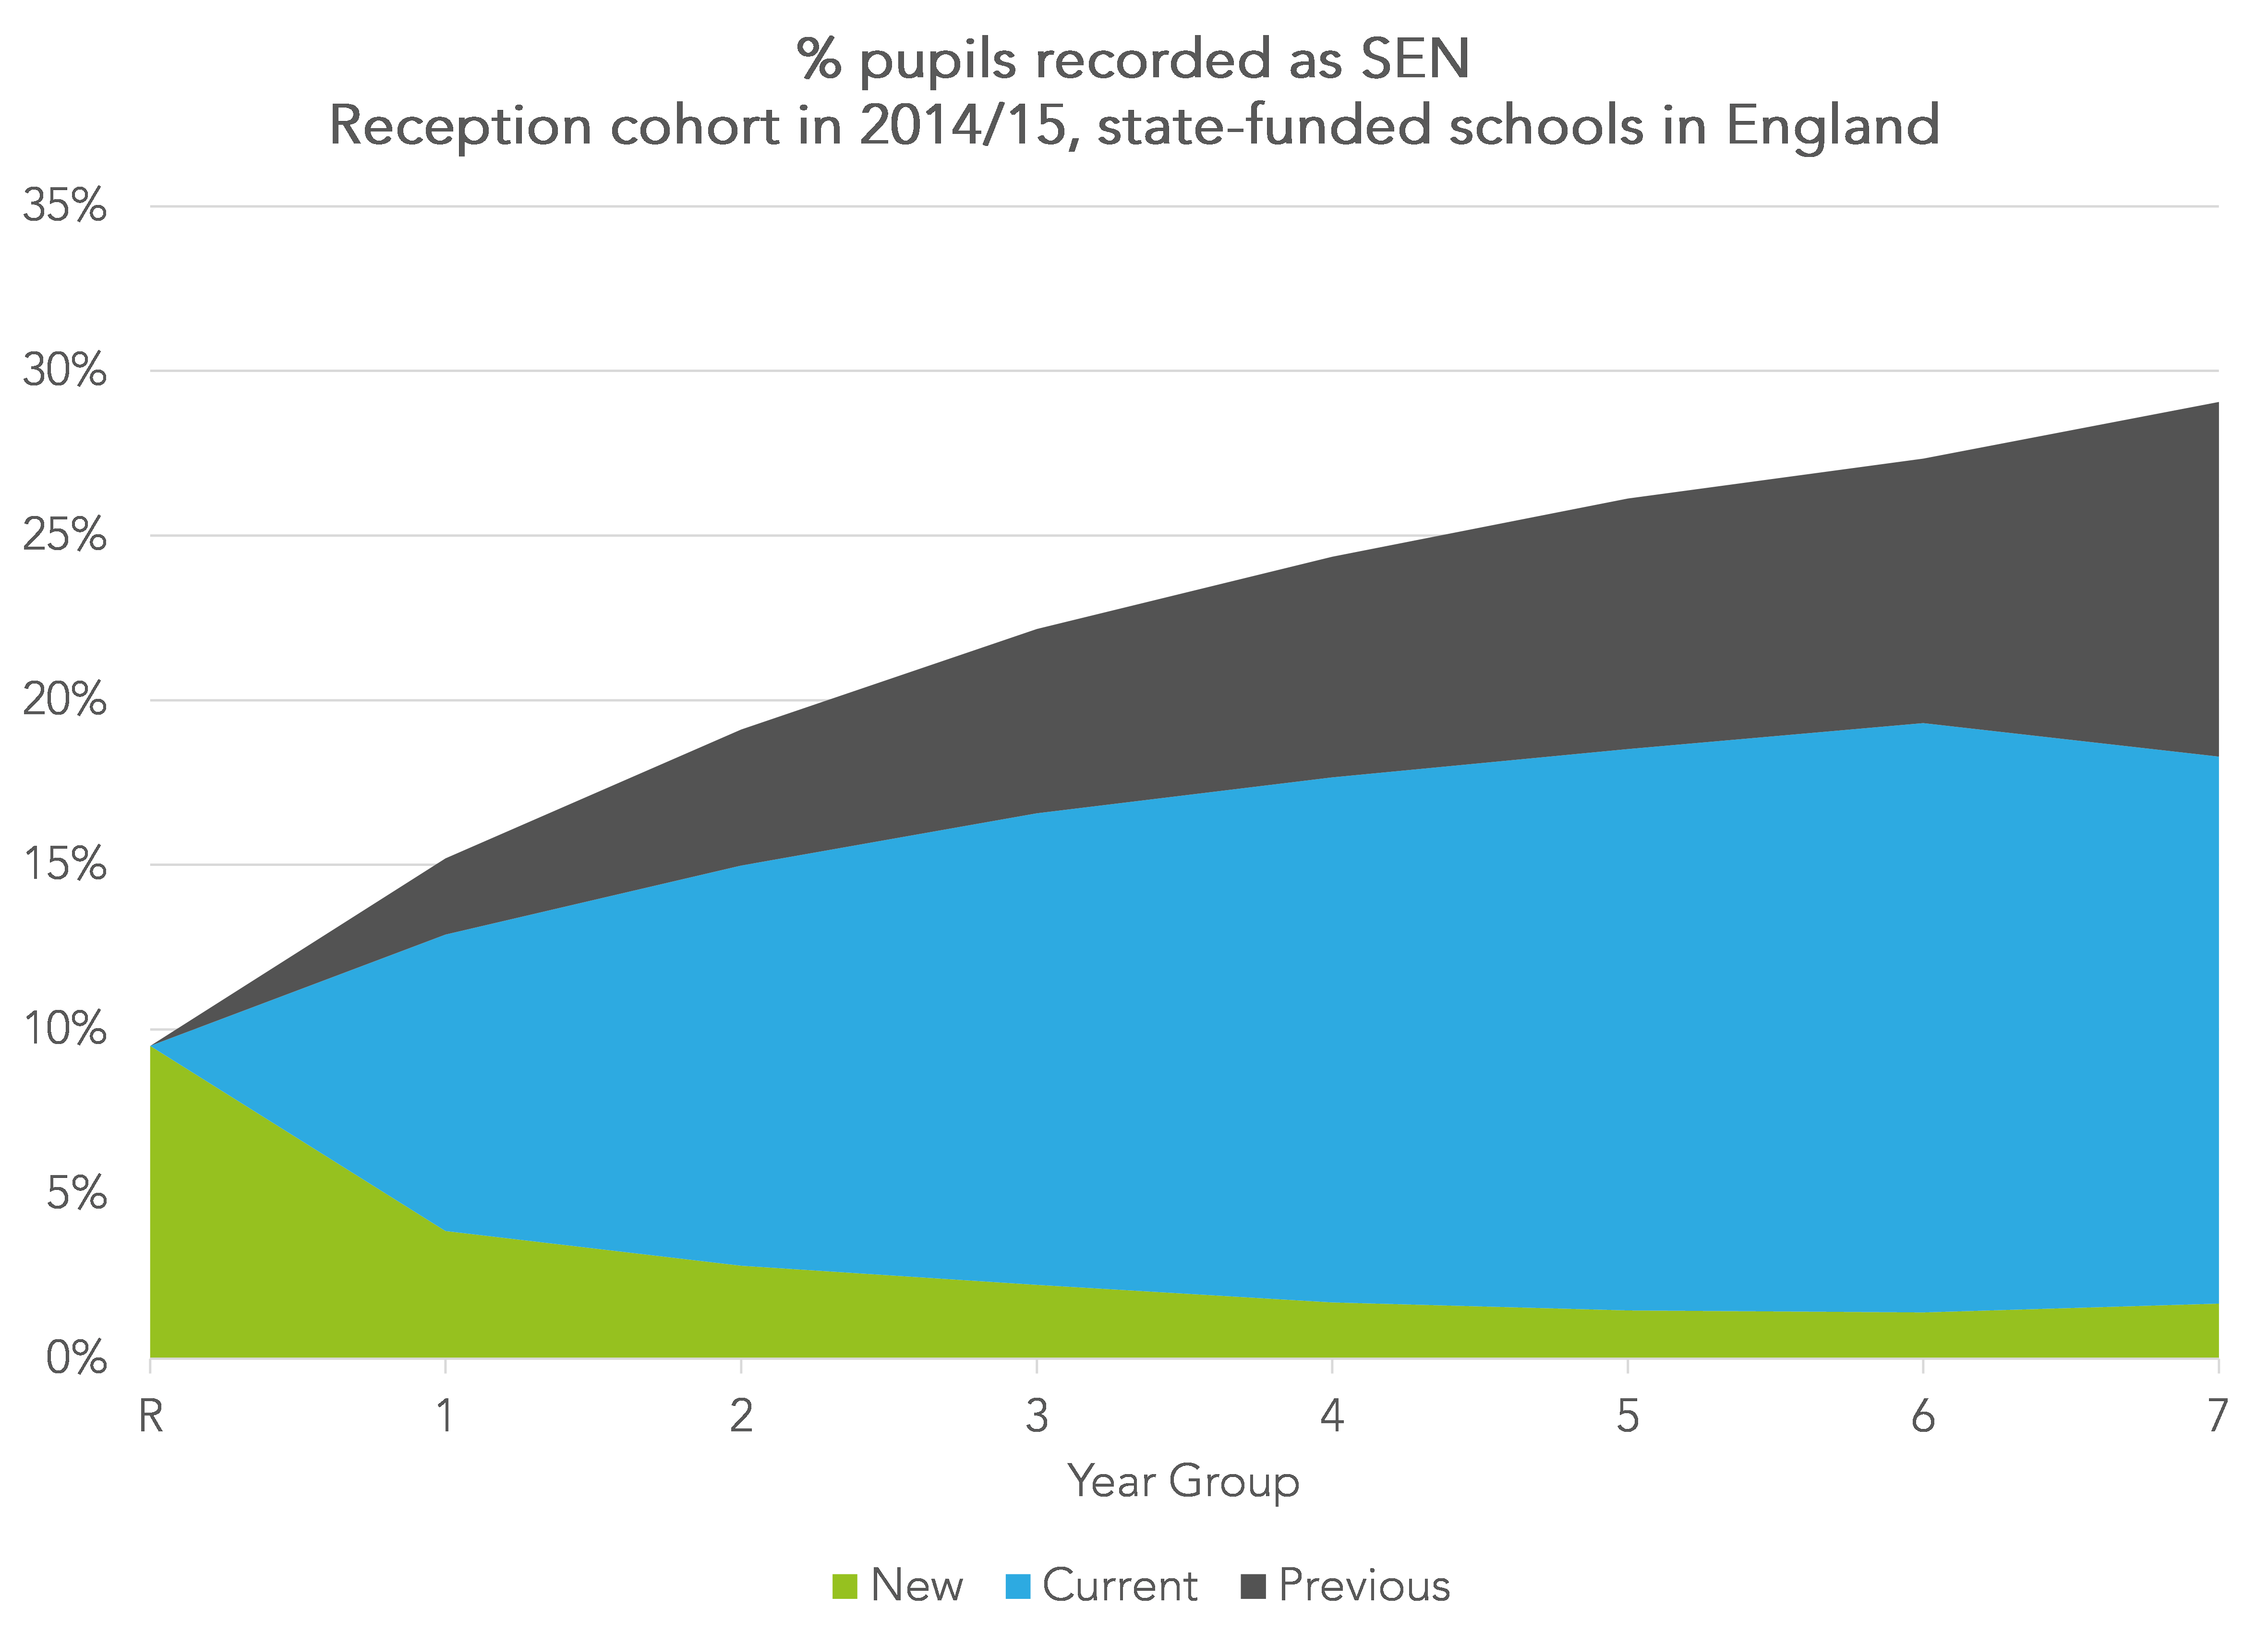
9.5% of pupils were classified as having SEN in Reception. This increased to 19.3% in Year 6 before falling to 18.3% in Year 7.
By the end of Year 7, 29.1% of pupils had been classified as SEN at least once in School Census.
We can compare this to the previous cohort we studied. By the end of Year 7, 41% of that cohort had been classified as SEN.
In the cohort in our previous analysis, relatively few additional pupils were then identified as having SEN up to the end of Year 11.
If we look at data for the most recent Year 11, those who would have reached the end of Year 11 in January 2022, we can track the percentage who were identified as having SEN for the first time since Year 7 in January 2018.

This shows that 3% of pupils were identified as having SEN for the first time between Year 7 and Year 11.
Of more concern are the 10% of pupils with EHC plans in Year 7 who were no longer on roll in the state-funded sector in Year 11. We have written about this in more detail here.
Type of SEN
Schools are asked to record each pupil’s primary type (or nature) of SEN. Where applicable, a secondary type can be recorded as well.
The types can be divided into two groups:
- More common “high incidence” types
- Less common “low incidence” types[2]
The high incidence group we consider below includes:
- Autistic spectrum disorder (ASD)
- Moderate learning difficulties (MLD)
- Speech, language and communication needs (SLCN)
- Specific learning difficulties, e.g. dyslexia (SPLD)
- Social, emotional and mental health needs (SEMH)
In some cases, a pupils may be identified as not yet having had a specialist assessment (NSA) to ascertain their type.
We acknowledge that type of SEN may not be reliably identified, particularly the designation of MLD (see this article, for example).
In the chart below we show the percentage of pupils identified at least once with each of the high incidence types by the end of Year 7. We also show the total percentage ever identified as having SEN (including the low incidence and NSA groups).

By the end of Year 7, 36% of boys and 22% of girls had been identified as having SEN at least once. Among boys, speech, language and communication needs was the most common type. Among girls this was moderate learning difficulties. Three times as many boys as girls were identified as having autistic spectrum disorder.
Incidence by type of SEN
Next, we produce versions of the first chart to show how incidence of SEN changes from Reception to Year 7 for each of the high incidence SEN types.
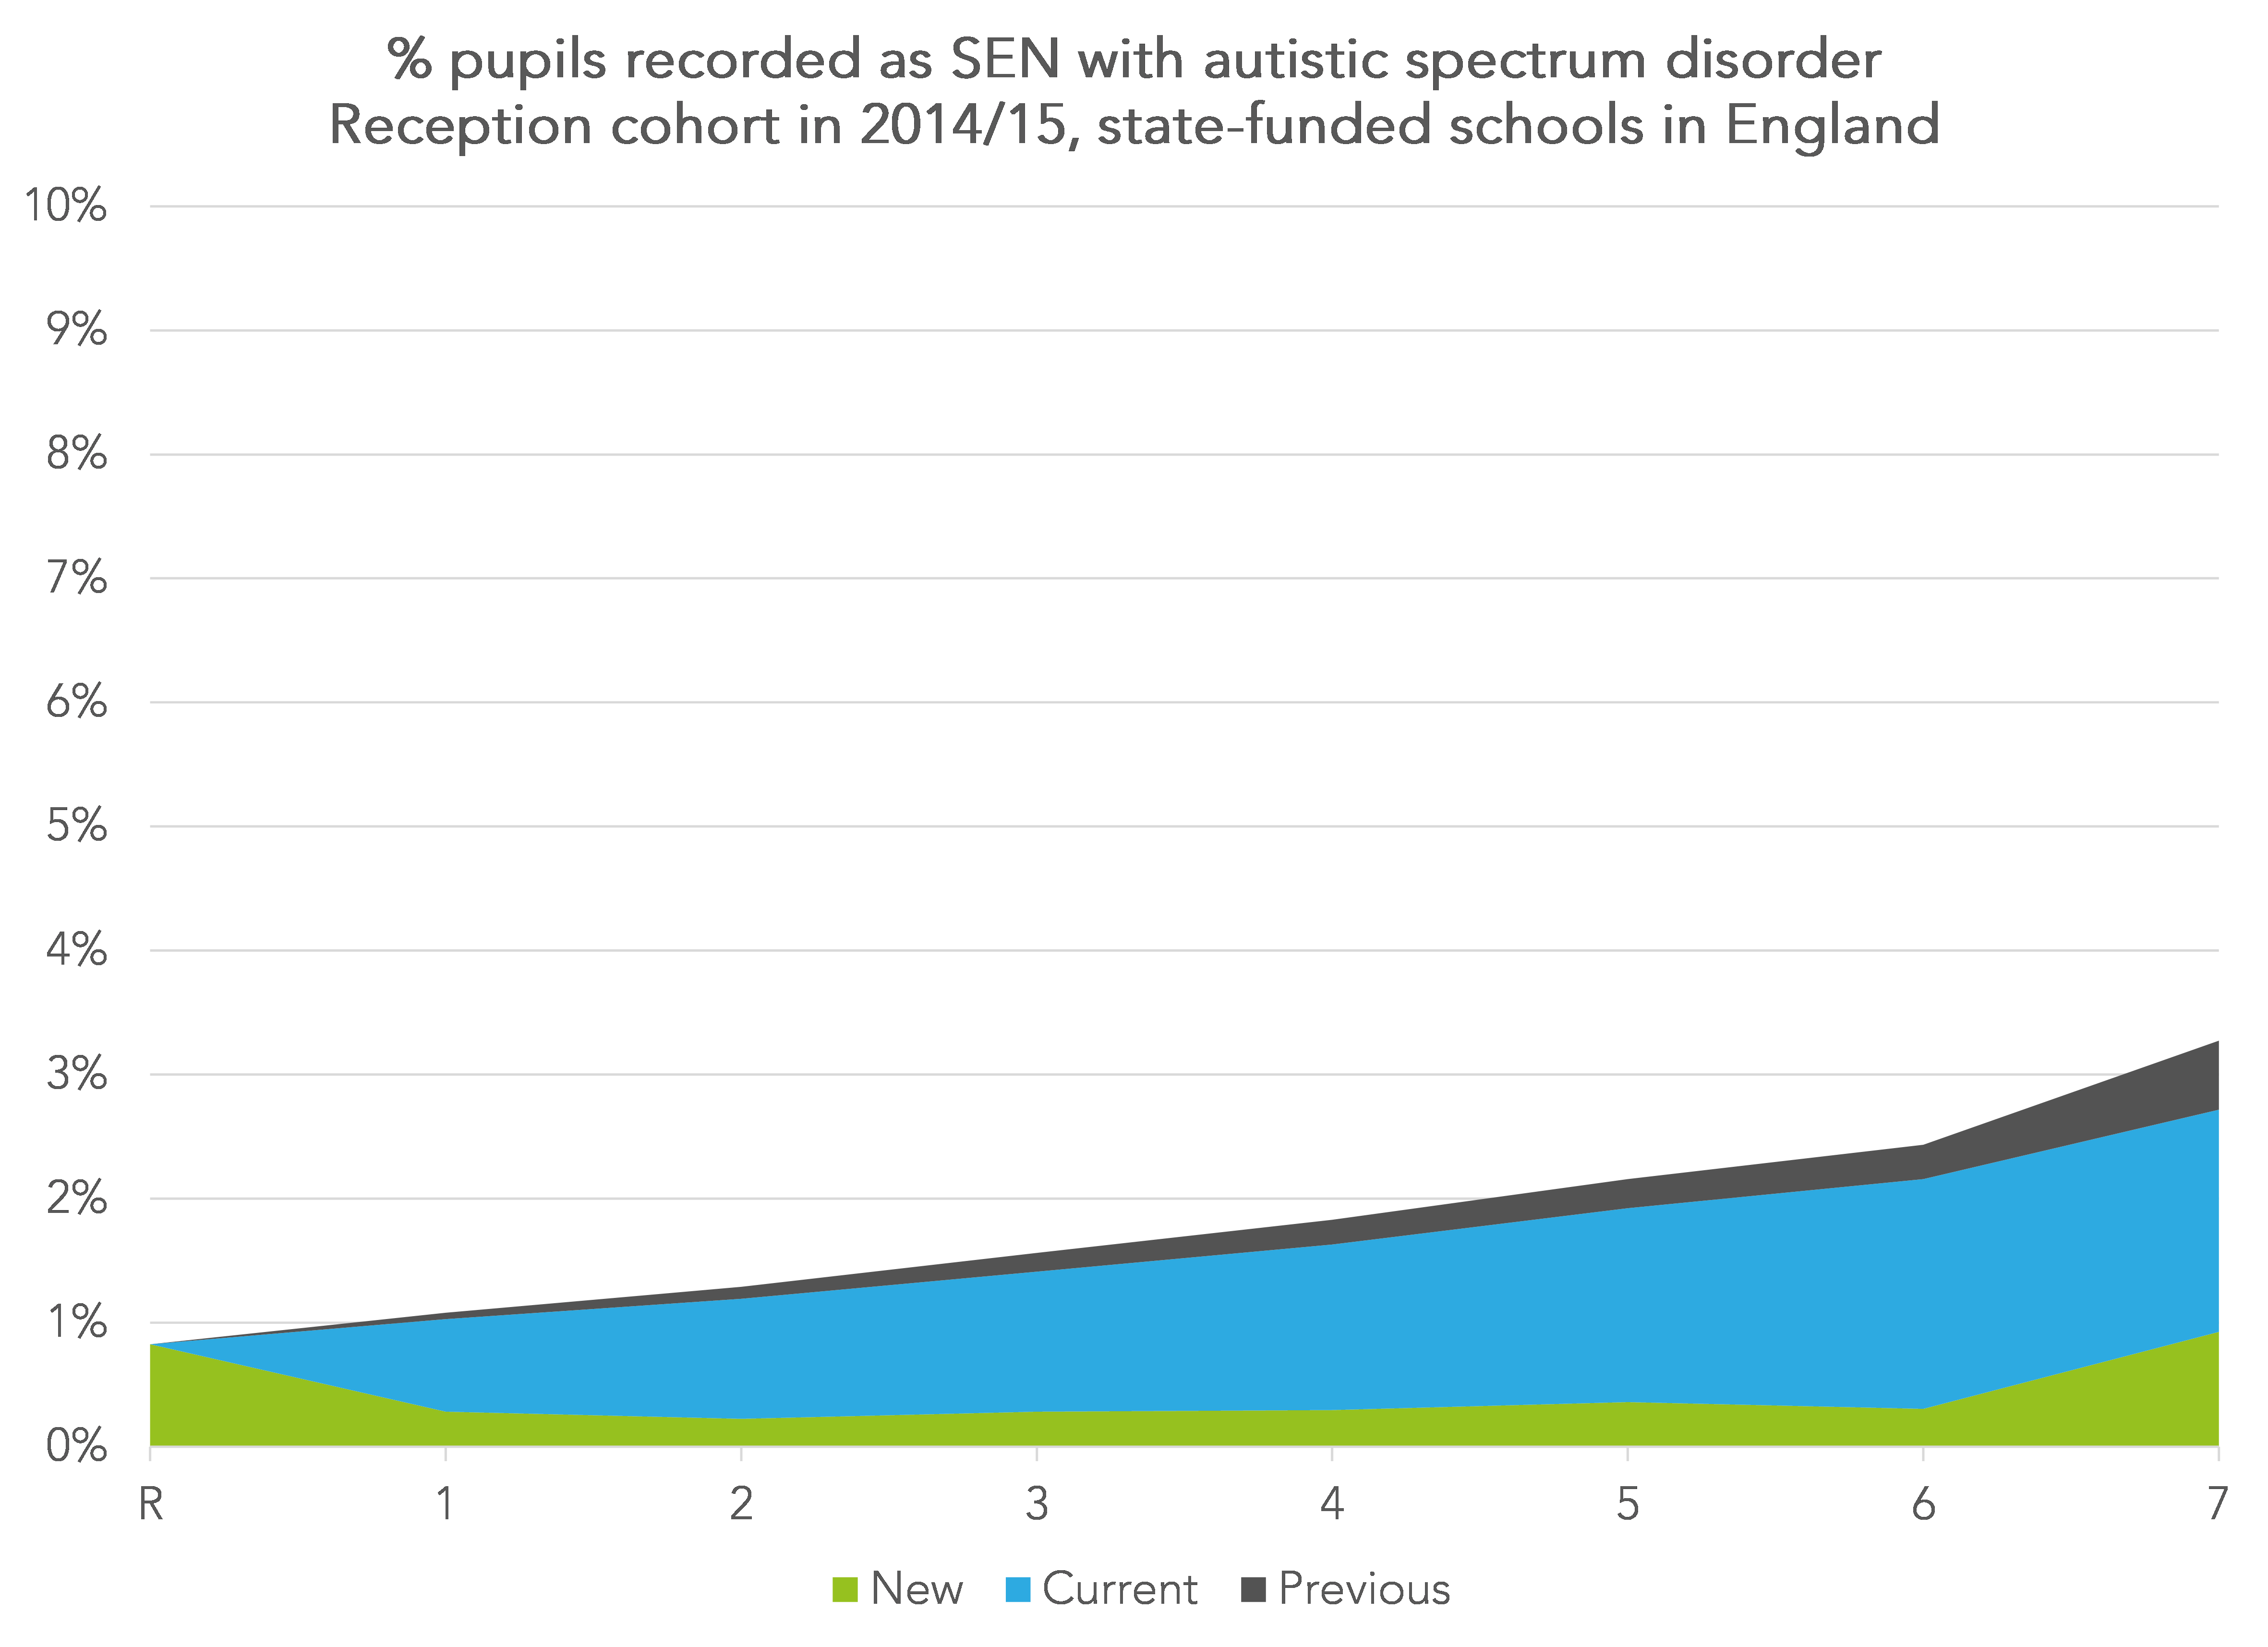
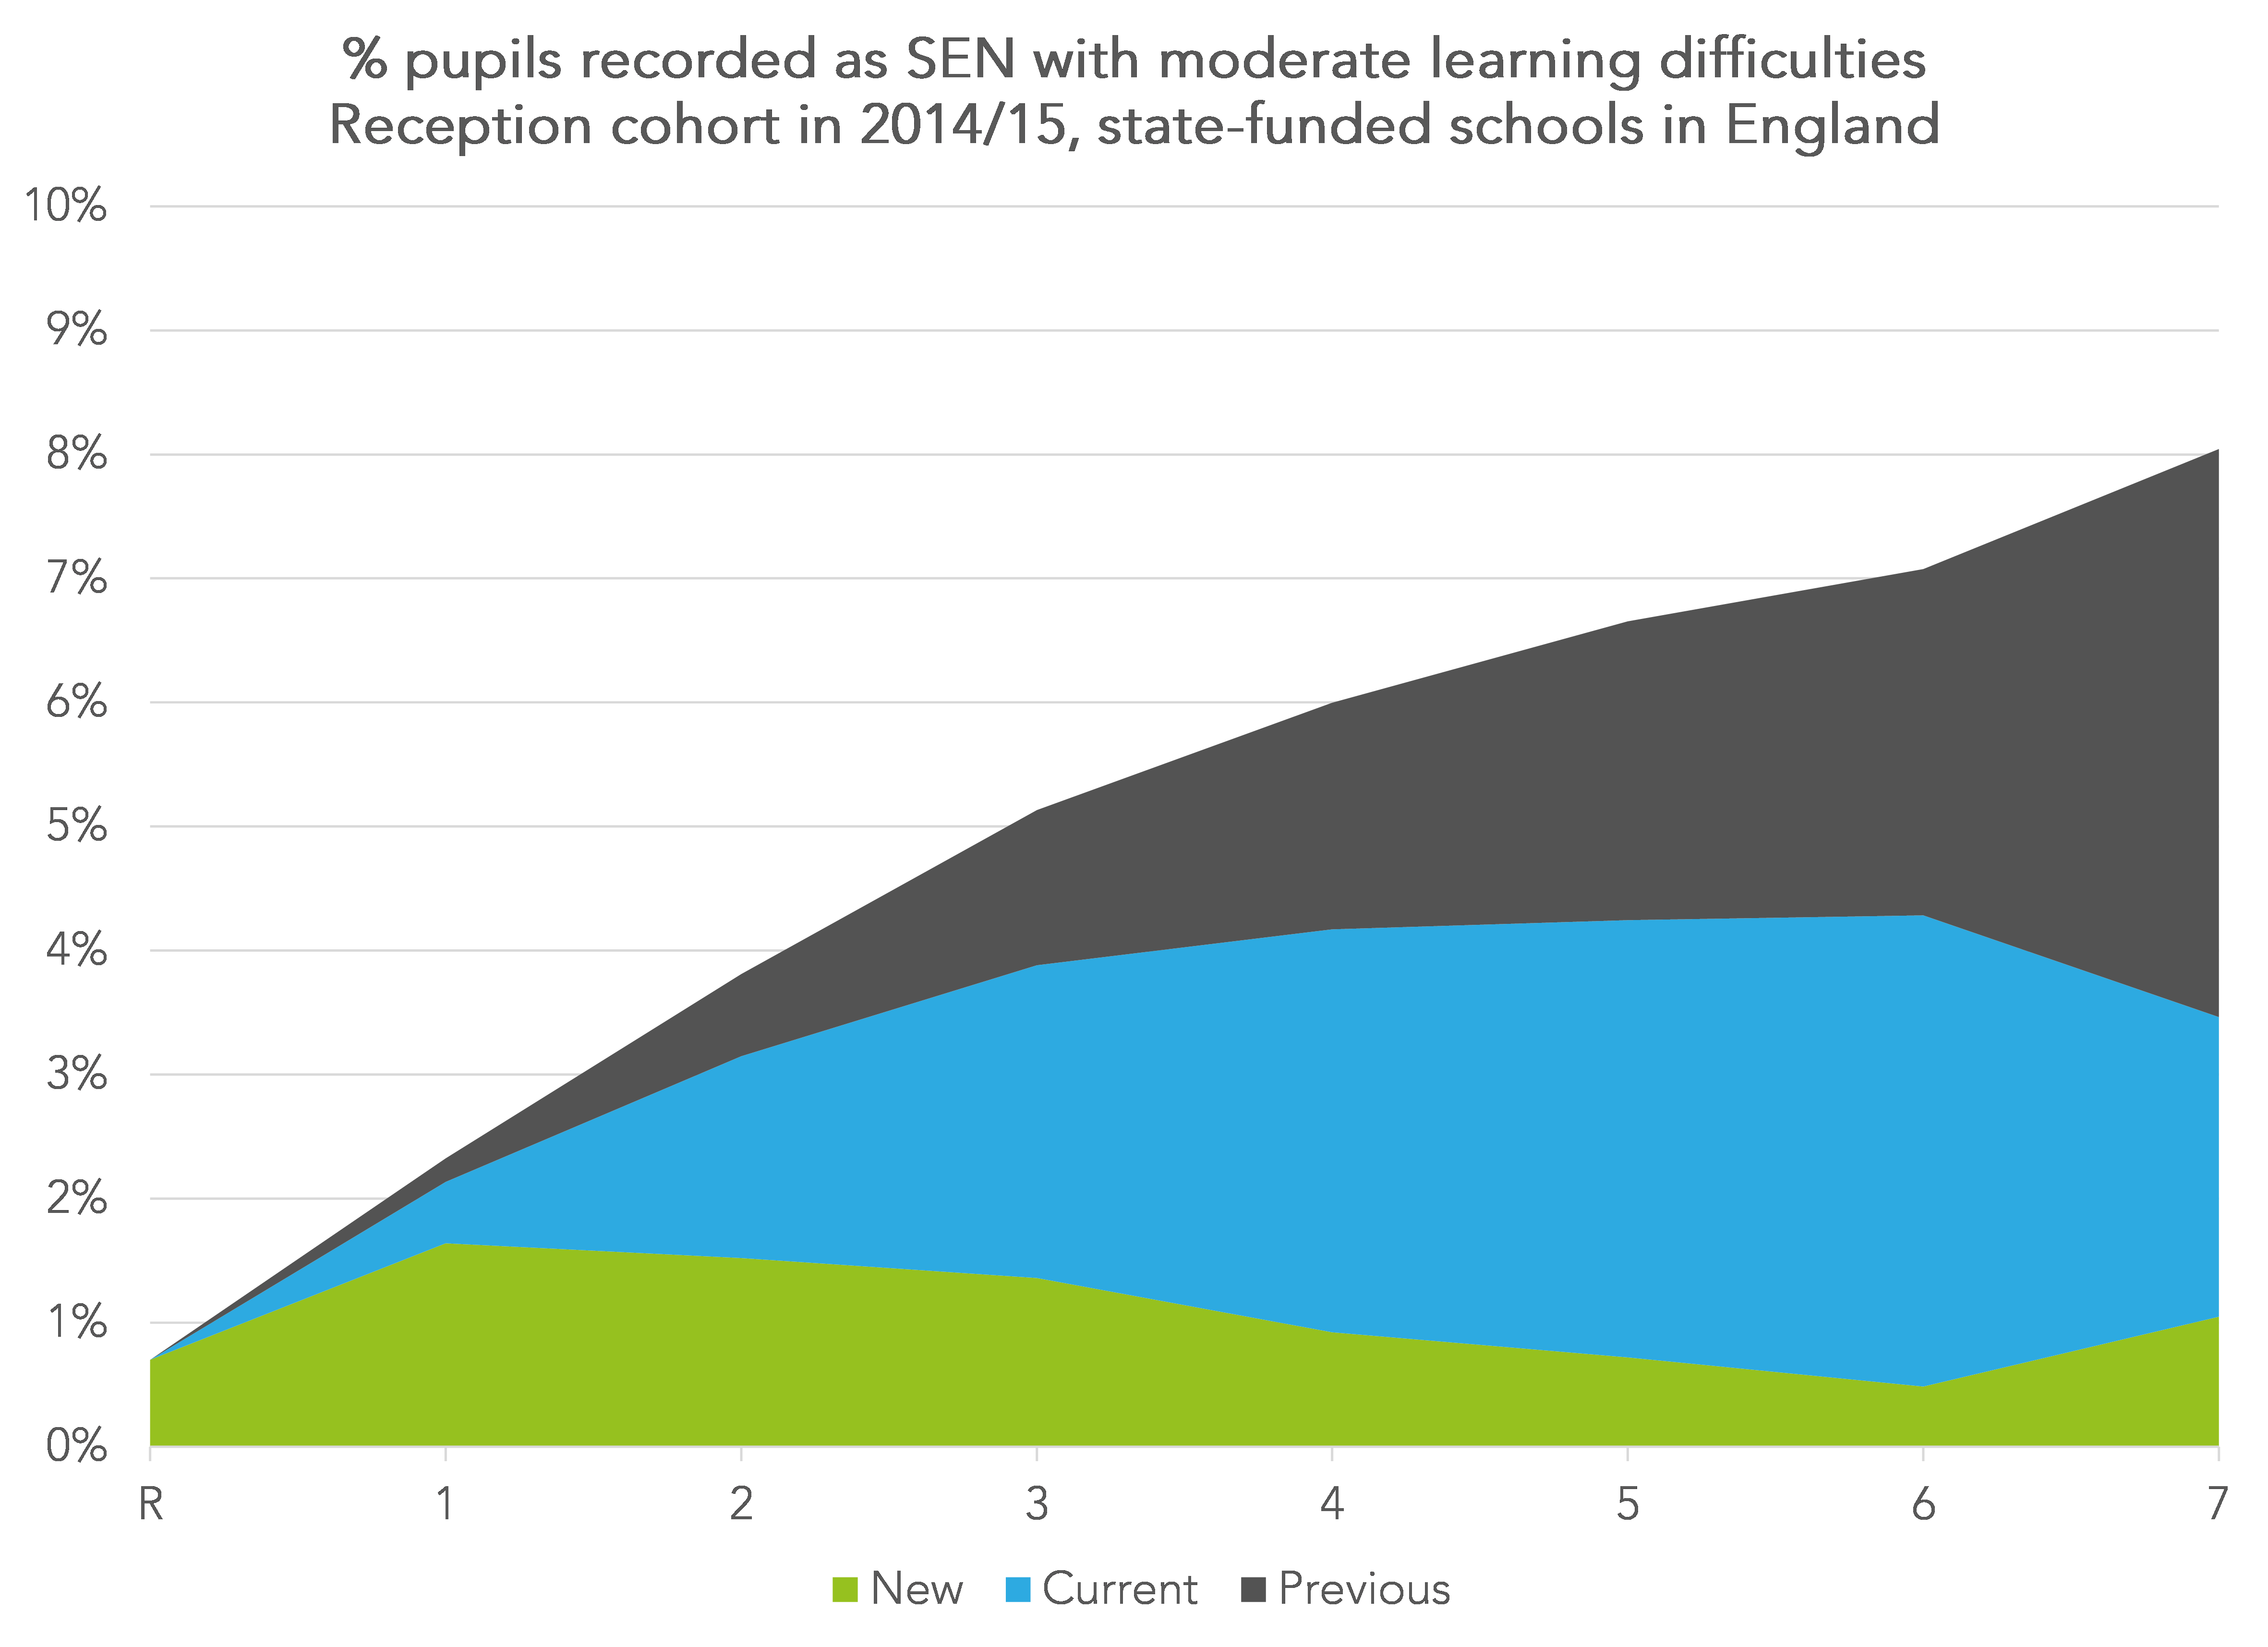
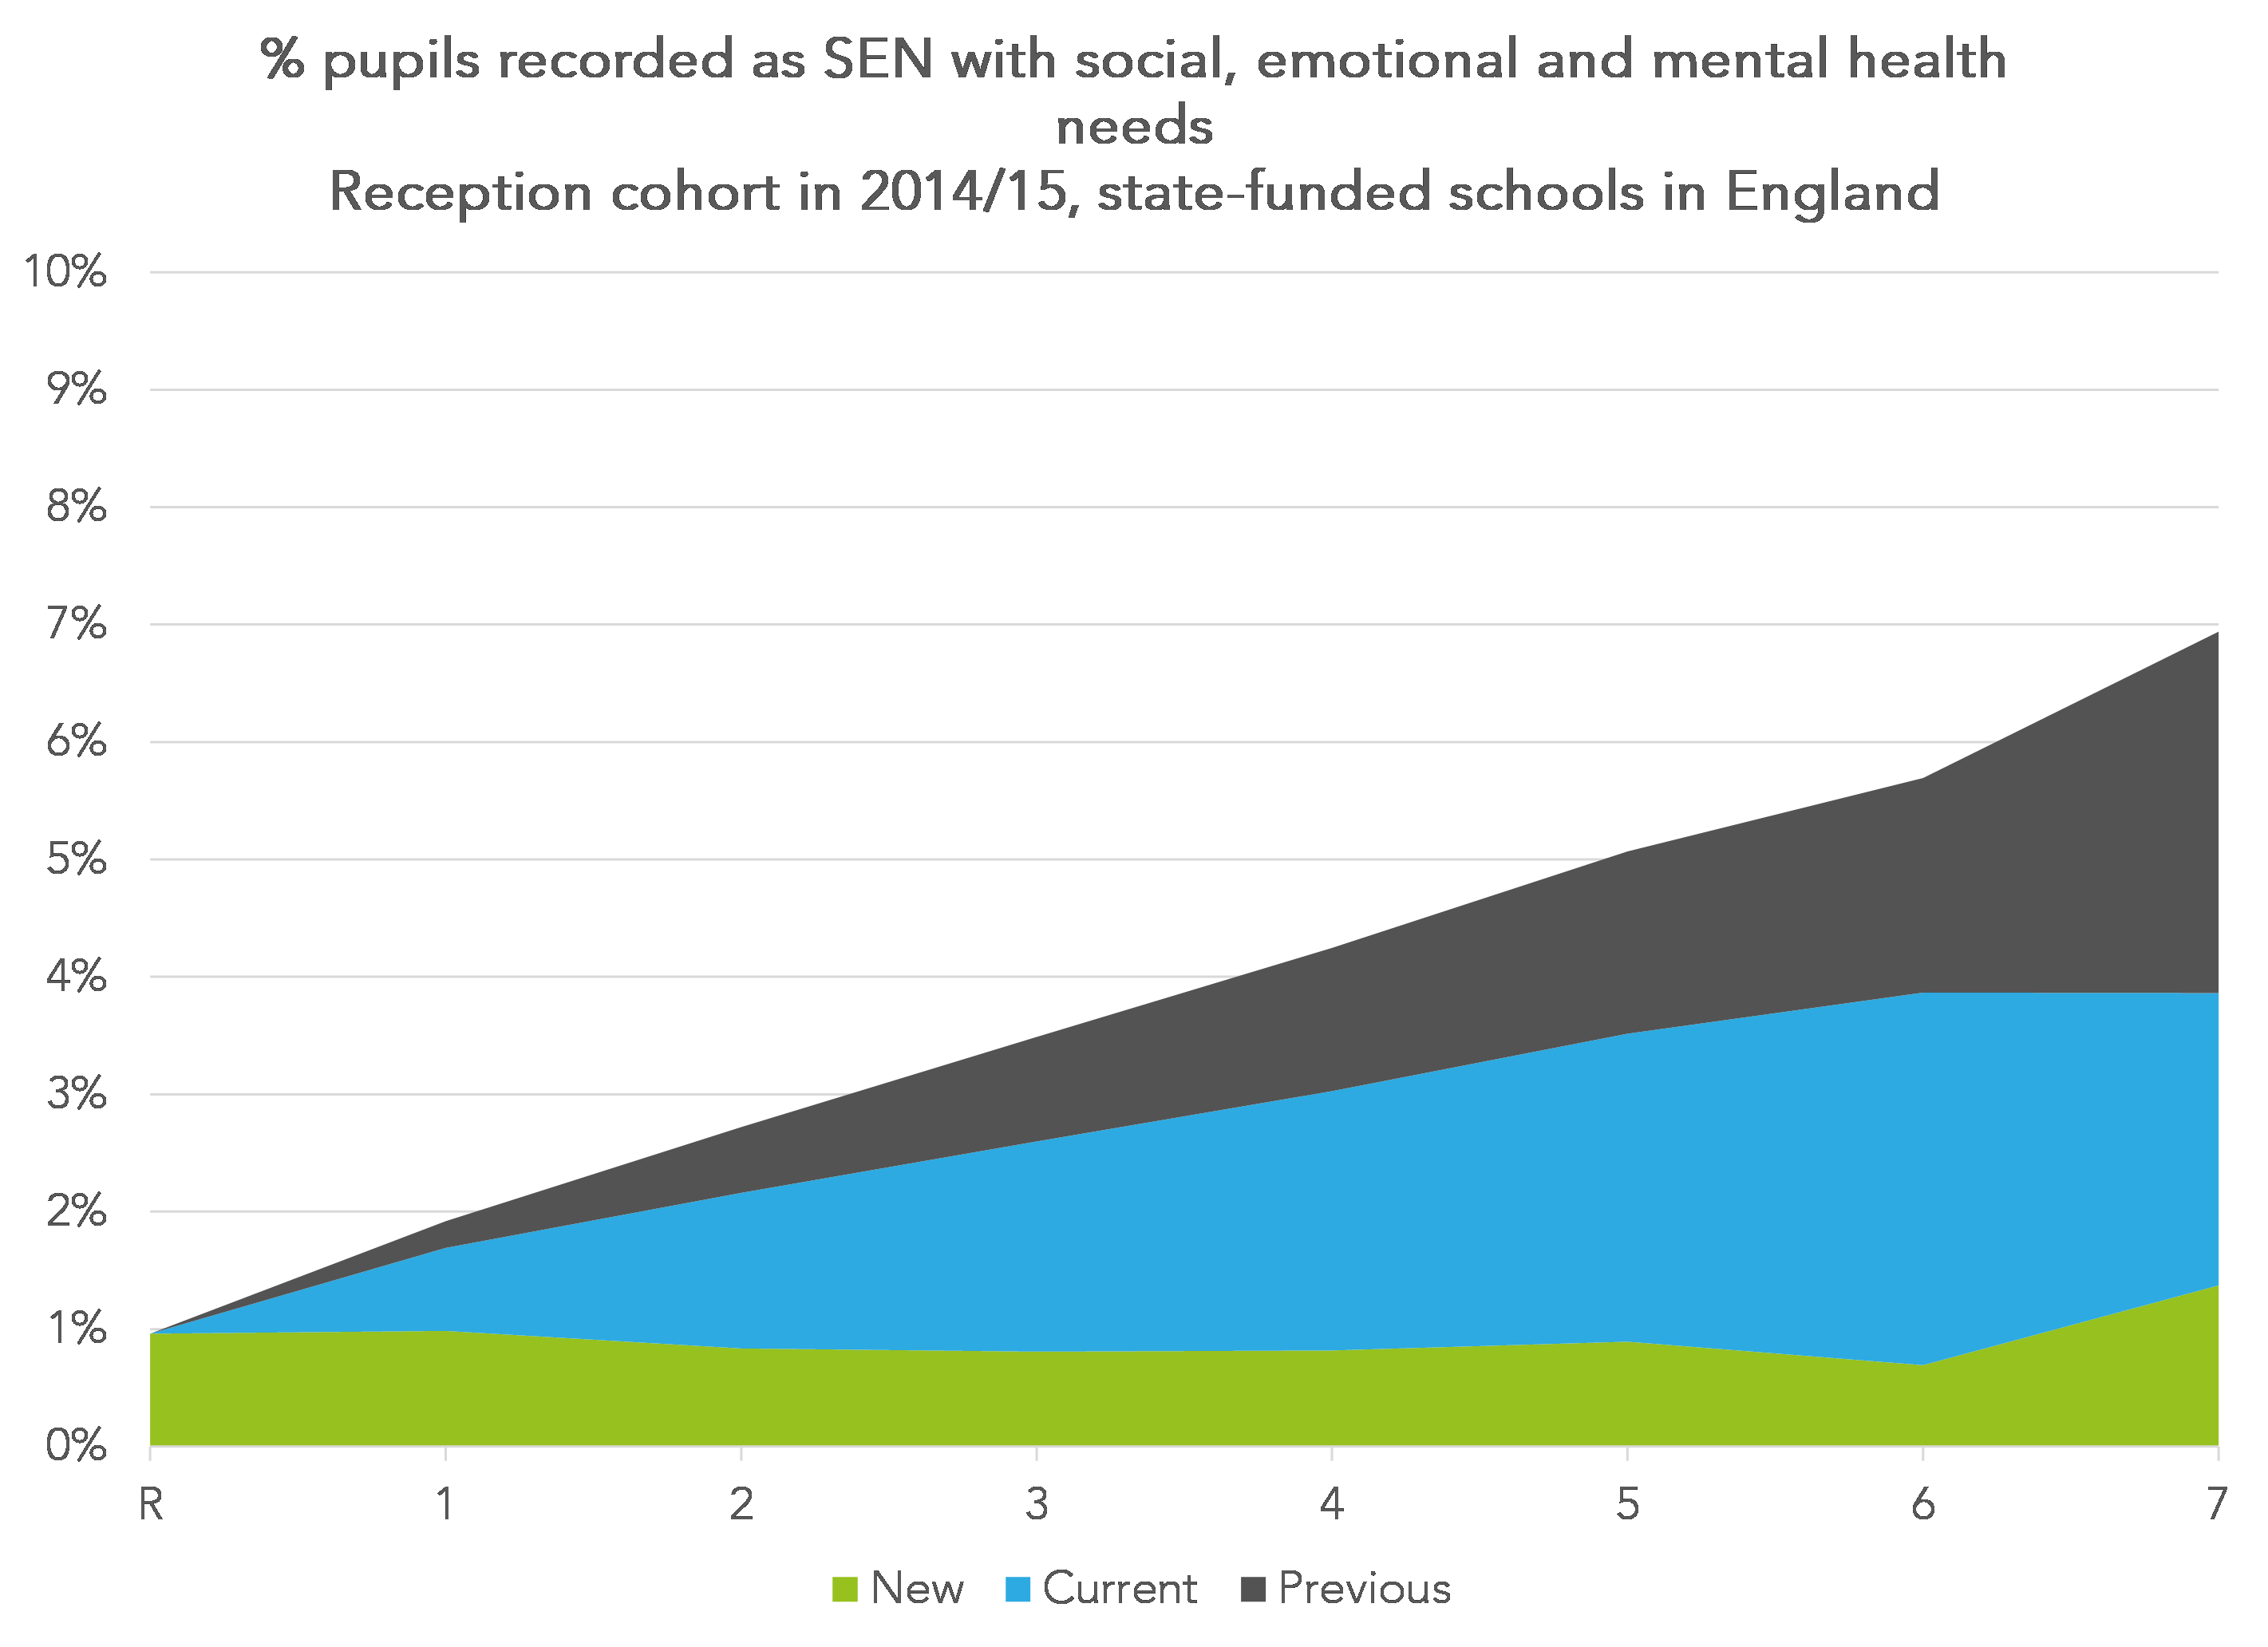
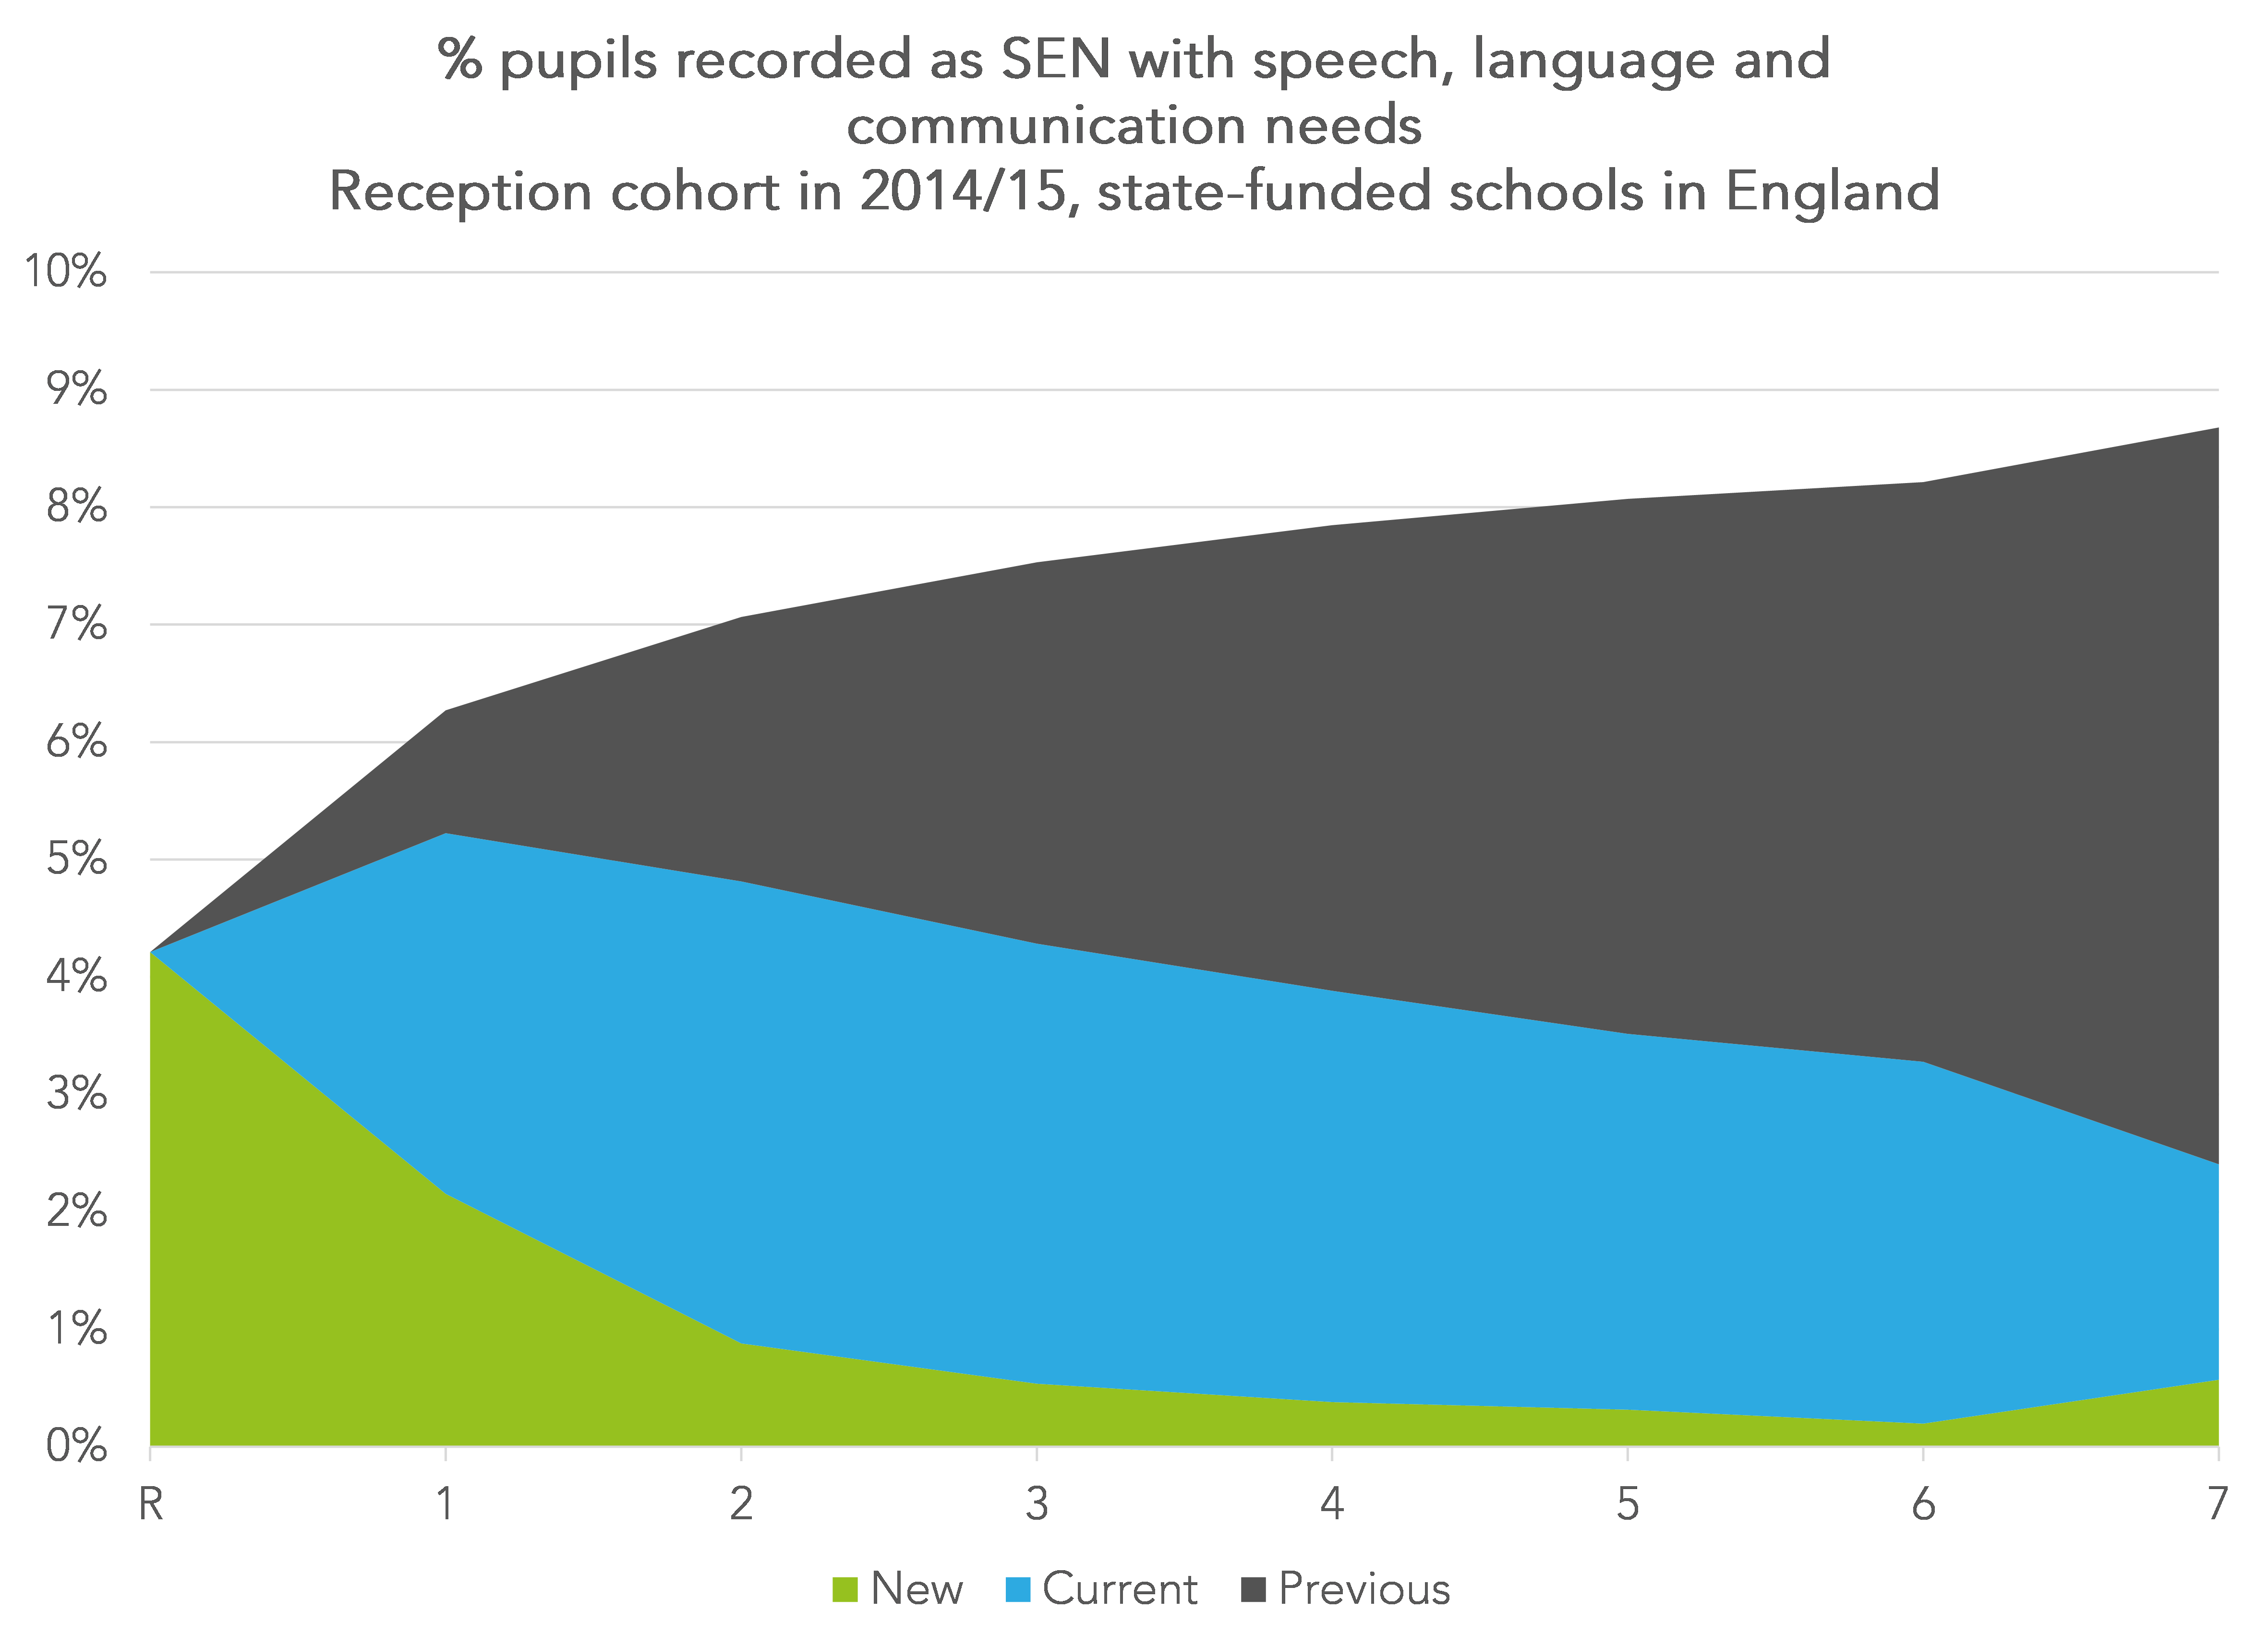
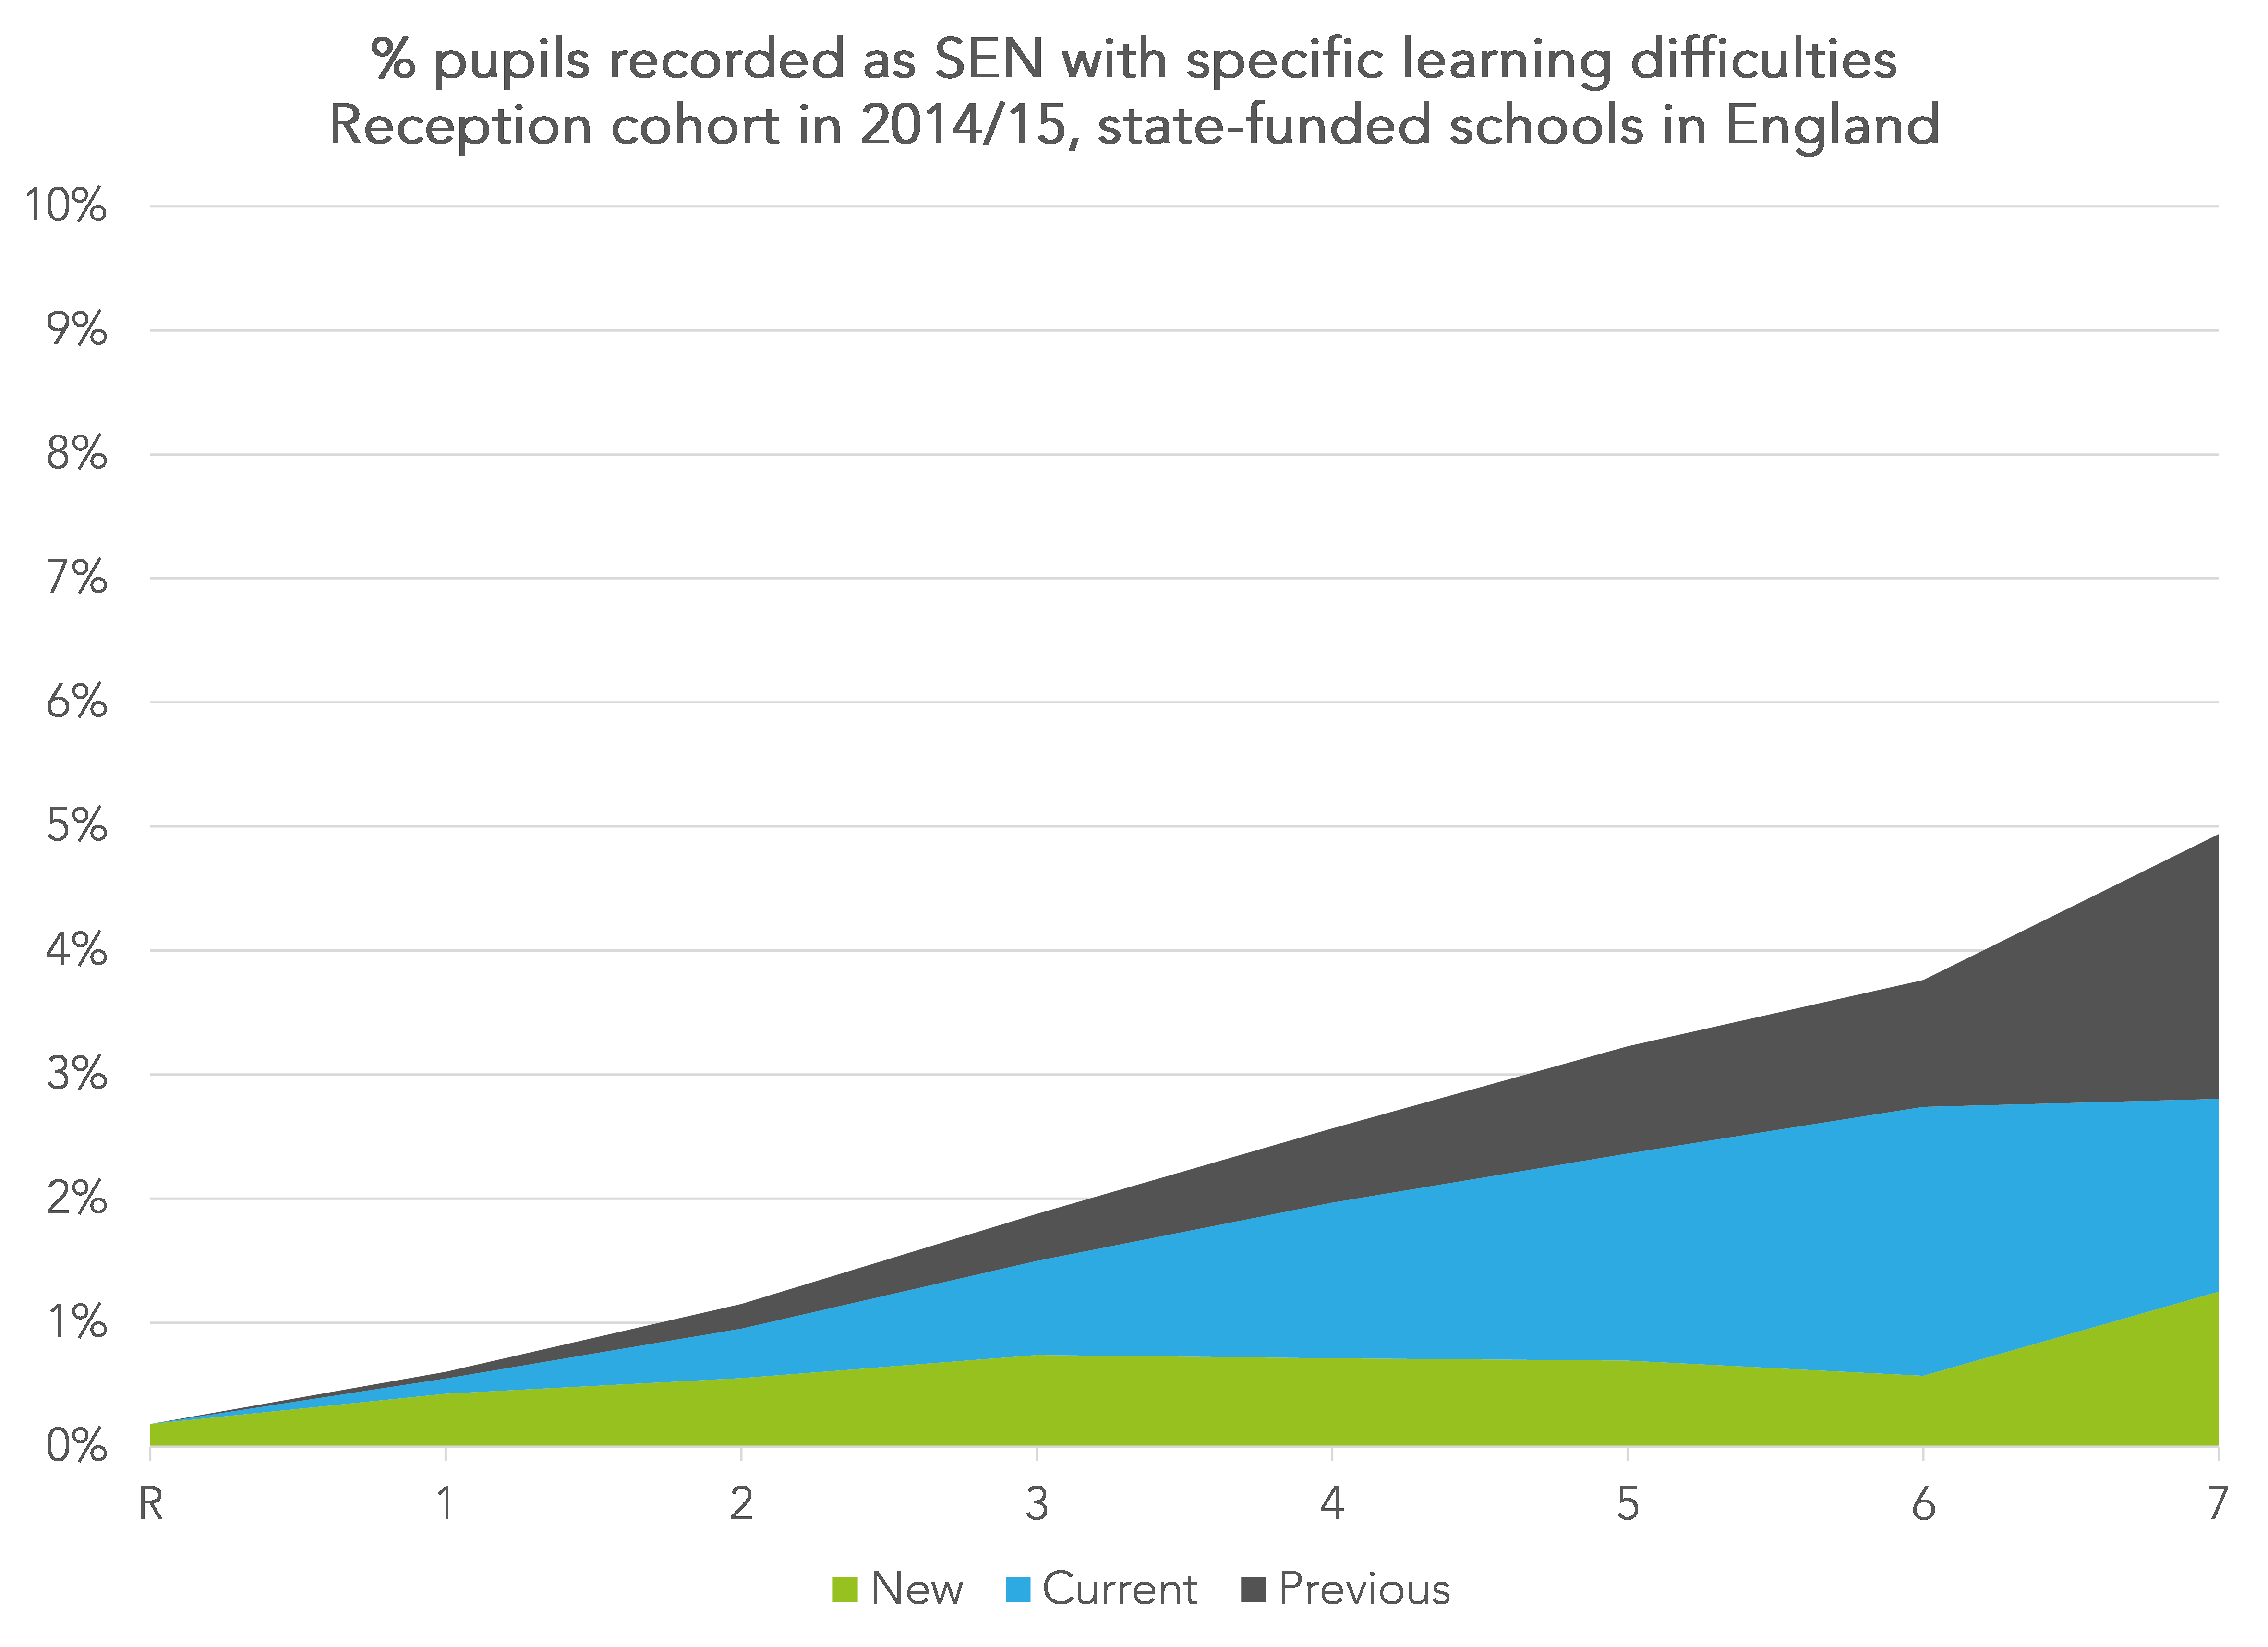
We offer some observations about the incidence (the green and blue areas combined) of each type from the charts:
- The incidence of autistic spectrum disorder increases each year from Reception to Year 7. This is also true of specific learning difficulty.
- The incidence of speech, language and communication needs falls after Year 1
- The incidence of moderate learning difficulties falls between Year 6 and Year 7 and stays the same for social, emotional and mental health needs
- There is an uptick of new cases between Year 6 and Year 7 in all types of SEN
In addition, for all types of SEN, there is an increase in the width of the grey bar between Year 6 and Year 7. This shows the proportion of pupils ceasing to be identified with a particular primary type of SEN, either due to no longer being identified as having SEN or being identified with a different primary type on moving to secondary school.
Changes in type of SEN
Finally, we look at how pupils’ SEN types change.
To do this, we compare the SEN type recorded in Year 7 with the SEN type recorded in Year 2. This means we do not include pupils who are identified as having SEN for the first time between Year 2 and Year 7.

39% of pupils identified as having SEN in Year 2 have the same primary type of SEN in Year 7. However, among pupils with autistic spectrum disorder (ASD) in Year 2 this figure was 73%. 25% of pupils with SEN in Year 2 were no longer identified as having SEN in Year 7 though this figure was much lower for pupils with ASD and lower for pupils with low incidence SEN.
7% of all pupils with SEN in Year 2 were no longer on roll in the state-funded school system by Year 7. Figures were slightly higher (10%) for pupils with ASD and SEMH.
It was relatively common for pupils with speech, language and communication needs in Year 2 to be recorded as having one of the other high incidence primary SEN types in Year 7, particularly moderate learning difficulties.
11% of those with SEMH needs in Year 2 were recorded as having ASD in Year 7.
We can contrast the change from Year 2 to Year 7 with the change from Year 7 to Year 11.

Over this period:
- 57% of pupils identified as having SEN in Year 7 have the same primary SEN type in Year 11. Again, the figure was higher (79%) for pupils with ASD.
- 22% of pupils identified as having SEN in Year 7 were no longer identified as having SEN by the end of Year 11.
- 8% of pupils identified as having SEN in Year 7 were no longer on roll in a state-funded school by the end of Year 11. Among pupils with SEMH needs in Year 7, this figure stood at 13%.
Summing up
The identification of special educational needs appears to have fallen since the introduction of the new code of practice.
By the end of Year 7, 29% of the cohort admitted in Reception in 2014/15 had been identified as having SEN in at least one termly School Census by January of Year 7. This compares to 41% among the cohort from 2004/05.
The most common primary type of SEN recorded for pupils was speech, language and communication needs (SLCN). However, incidence fell after Year 1 and it was common for pupils recorded with SLCN to subsequently be recorded as having different primary types of SEN.
Finally, a proportion of pupils with SEN leave the state-funded school system whilst of compulsory school age. 10% of pupils with social, emotional and mental health (SEMH) needs in Year 3 left the system by the end of Year 7. 13% of pupils with SEMH needs in Year 7 left the system by the end of Year 11. Some of these pupils will have moved into local authority alternative provision.
- School Census is carried out in October, January and May each year
- Hearing impairment, visual impairment, severe learning difficulties, profound and multiple learning difficulties, physical disability, other
Want to stay up-to-date with the latest research from FFT Education Datalab? Sign up to Datalab’s mailing list to get notifications about new blogposts, or to receive the team’s half-termly newsletter.


Leave A Comment