In this blogpost we’re going to take a closer look at the extent to which pupils with EHC plans in Year 7, typically the first year of secondary school, attend state-funded mainstream schools.
Other options, including state-funded and independent special schools, may be available to pupils. We are not assuming that mainstream is better, rather we are interested in the variation between schools in the percentage of pupils with EHC plans they enrol.
Parents of pupils with EHC plans can express a preference for a school. Their local authority will consult with the school about whether the pupil’s needs can be met but ultimately the final decision on which school will be named on the plan will rest with the local authority[1]. The analysis we present reflects those decisions.
Data
We use data from the January School Census. We largely use data from 2022 but we also include previous years (2018 onwards). Our focus is on those aged 11 at the start of the academic year. The majority of these pupils will be in Year 7.
Firstly, we simply summarise the proportion of 11-year-olds at each state-funded mainstream school who have a EHC plan (or a statement of SEN in earlier years of the data).
We then examine the extent to which school intakes of pupils with EHC plans reflect the local area. To do this, we define a hypothetical catchment of 11-year-old pupils for each mainstream secondary school. This consists of the pupils who live closest (as the crow flies) to each school. For example, if a school has 180 11-year-old pupils on roll, we find the 180 11-year-old pupils who live closest to it.
When defining the hypothetical catchments, we include all 11-year-old pupils in state-funded education. This includes mainstream schools, special schools, alternative provision schools and those in other provision funded by the local authority (e.g. in independent special schools).
There are some limitations to our analysis. Firstly, we do not know exactly where pupils live due to restrictions placed on the data the Department for Education (DfE) provides us with. However, we do have data on the lower super output area (LSOA) in which pupils live, so we measure distances between schools and the centroid of each LSOA. This introduces a degree of fuzziness in our analysis.
Placement of pupils with EHC plans
The table below shows the placement of 11-year-old pupils with EHC plans in 2022.

In total, 47% of pupils attend mainstream schools, including the 3% of pupils who attend SEN units or specialist resourced provisions within mainstream schools. 44% attend special schools and the remainder are in other settings, including independent special schools and AP schools. Note that pupils without any school place are not included.
These figures vary with respect to primary need. Those with severe learning difficulties and profound and multiple learning difficulties are much less likely to attend mainstream schools while those with social, emotional and mental health (SEMH) needs are more likely to be educated in AP or other local authority funded provision.
Before moving on, we have previously shown that pupils enrolled in mainstream schools in Year 7 do not necessarily all stay in mainstream until Year 11.
In the table below, we examine the Year 11 destinations (in 2022) of pupils with EHC plans who were in Year 7 in mainstream schools in 2018, excluding those in SEN units and resourced provisions.

There were far fewer pupils with EHC plans in mainstream schools in 2018 (8500 compared to 15200 in 2022). The incidence rate of EHC plans has increased and so has the size of the cohort.
Around one-in-five pupils with EHC plans on roll in state-funded mainstream schools in Year 7 had left by the January of Year 11. This rate was higher (more than one-in-three) among those with SEMH needs.
The schools with no pupils with EHC plans
There were almost 3,300 state-funded mainstream schools with at least 30 11-year-old pupils in 2022. This will include a small number of middle schools.
On average, 2.5% of 11-year-old pupils in those schools had EHC plans. However, this figure varies between schools as indicated in the chart below.
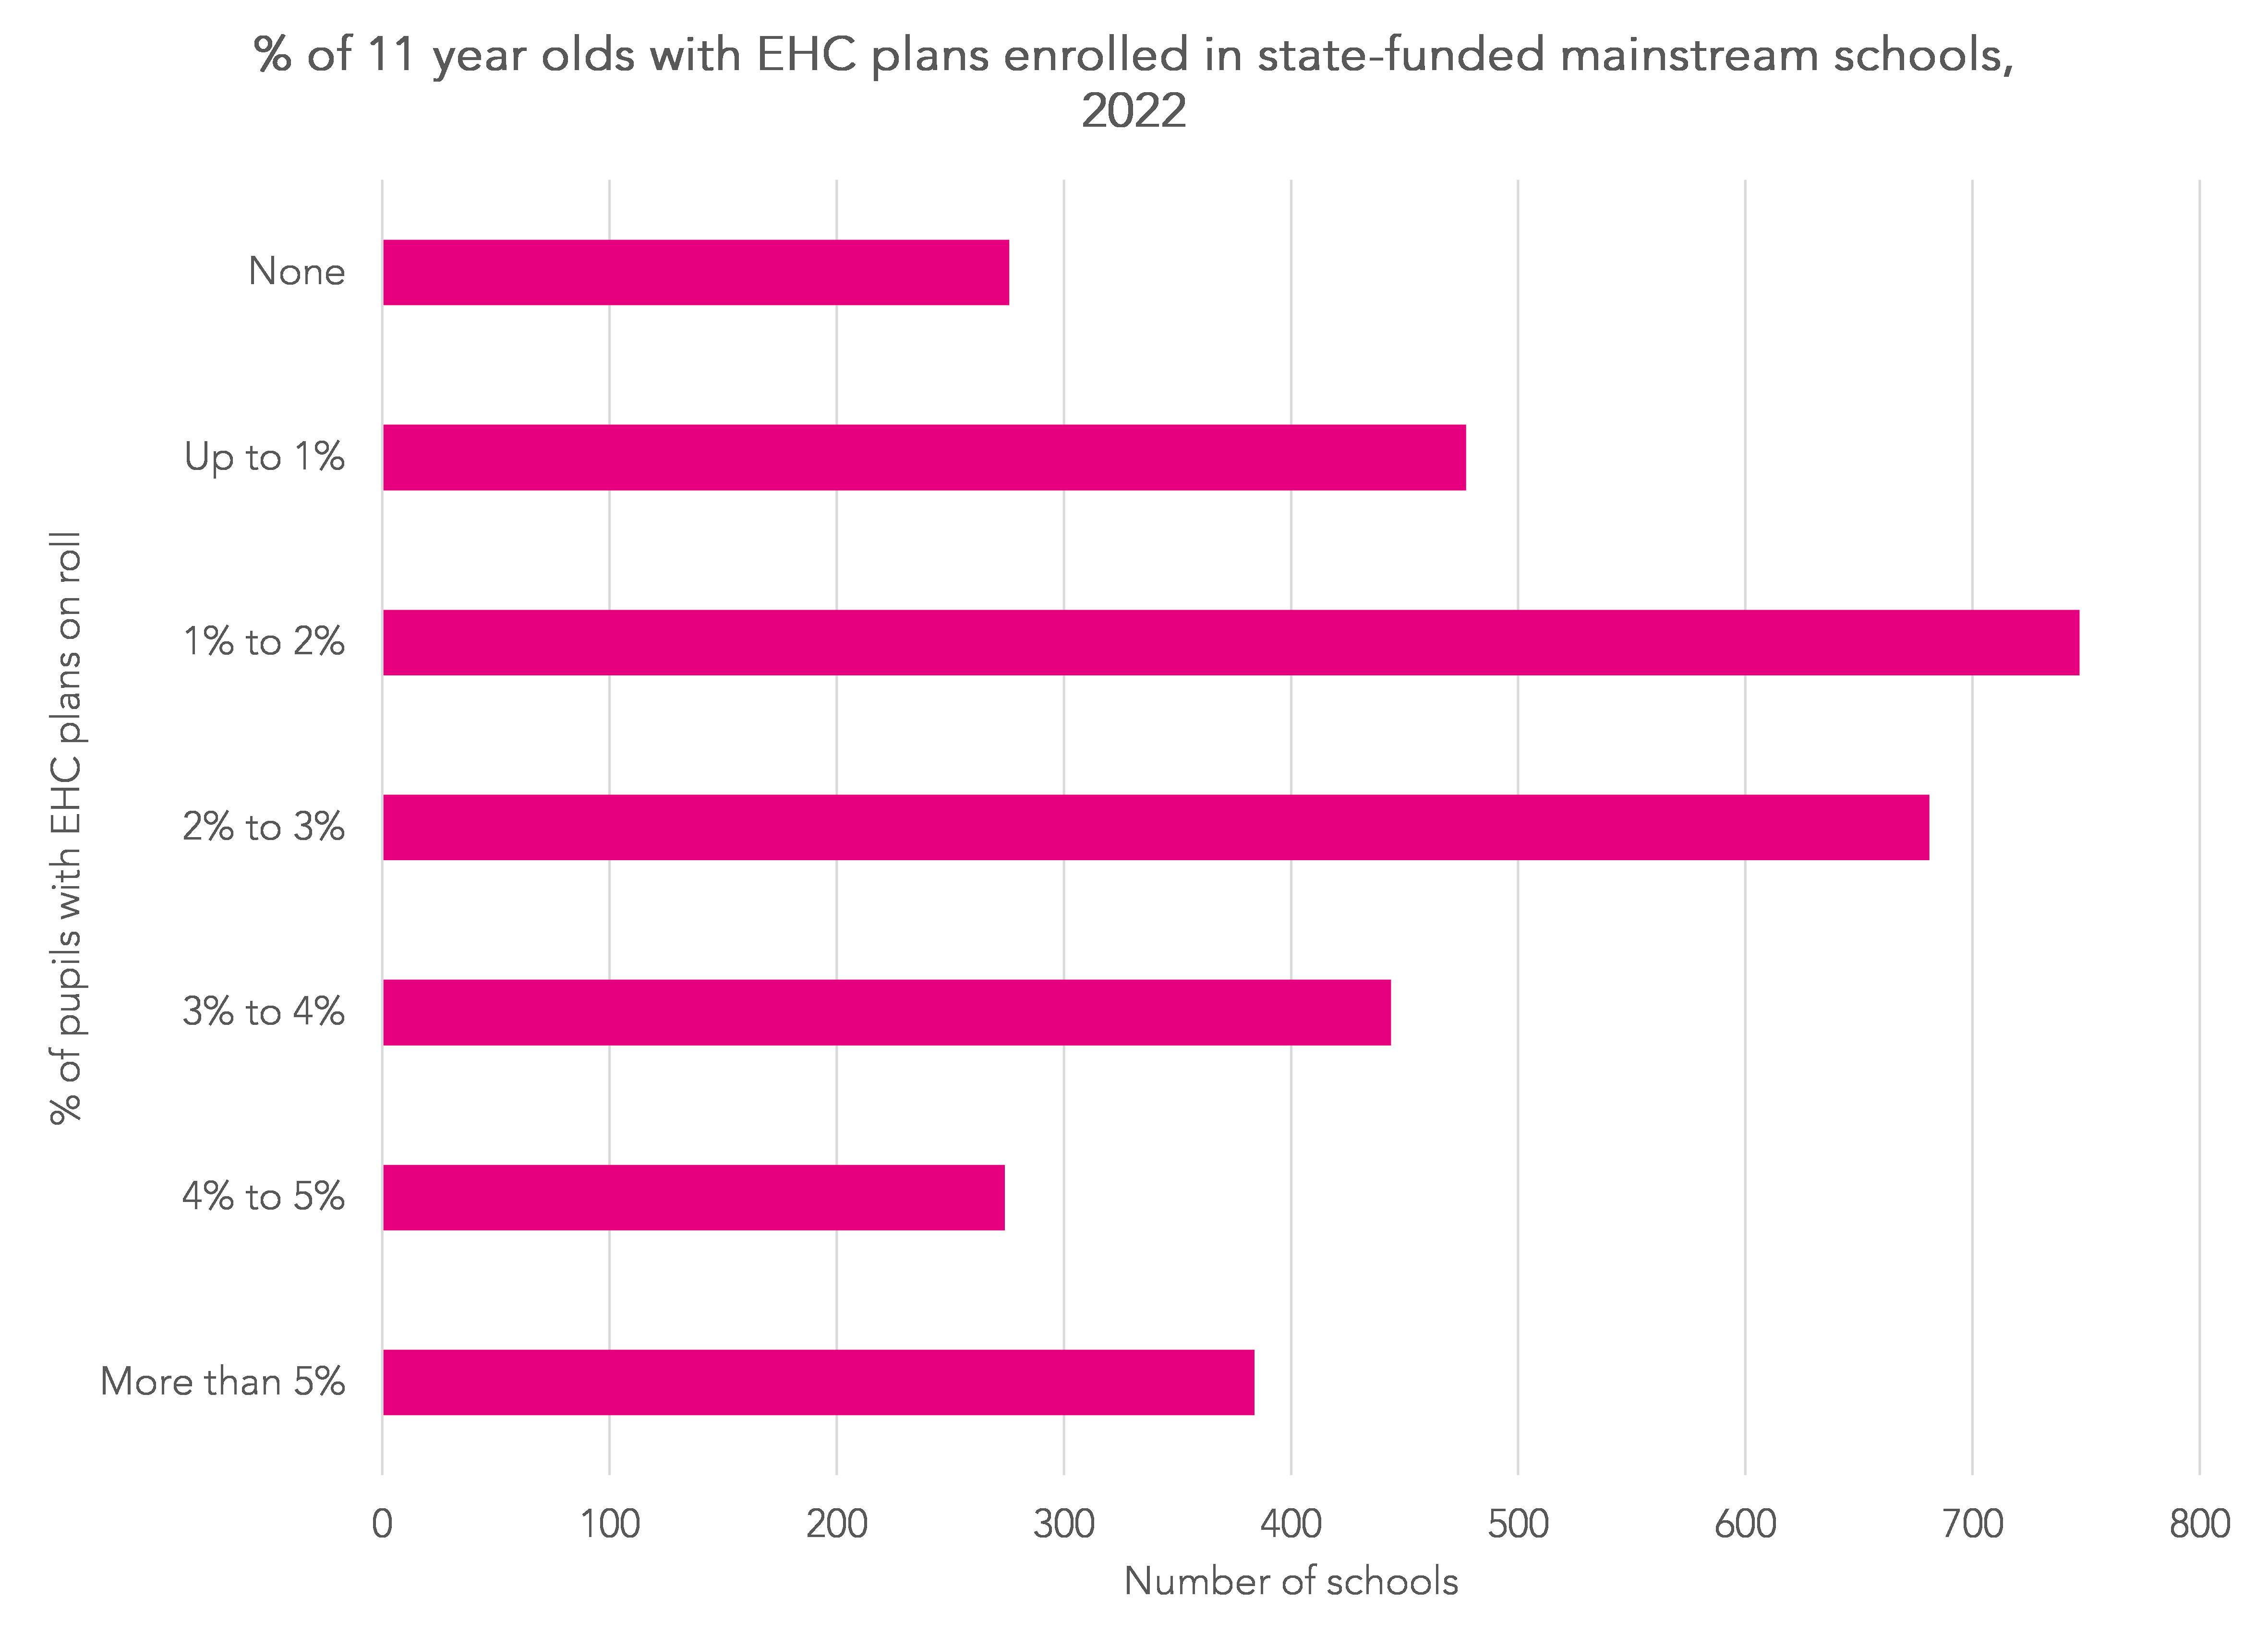
There were almost 400 schools with at least 5% of pupils with EHC plans- at least double the national rate.
By contrast, there were 276 schools without a single pupil with EHC plans. Of these, 94 (34%) were selective (grammar) schools.
Of the 276, 60 had no 11-year-old pupils with EHC plans in 2020 or 2021 either. 46 of the 60 (77%) were selective schools.
Do pupils with EHC plans attend their nearest mainstream school?
46% of 11-year-old pupils with SEN Support and 44% of those without SEN were attending their nearest state-funded mainstream school in January 2022.

By contrast, 17% of 11-year-old pupils with EHC plans in 2022 were attending their nearest mainstream school.
This figure is slightly lower even when the nearest school was judged to be outstanding by Ofsted in its most recent inspection by the start of the 2021/22 academic year.

Are there some types of schools whose intakes don’t reflect their local area?
As we saw earlier, 94 of 163 grammar schools did not enrol a single pupil with an EHC plan in 2022. This is not a new finding.
Leaving grammar schools to one side, are there any other school characteristics associated with low recruitment of pupils with EHC plans?
Firstly, we look at school governance, comparing the actual percentage of pupils with EHC plans on roll with the percentage resident in the hypothetical catchment of each school.
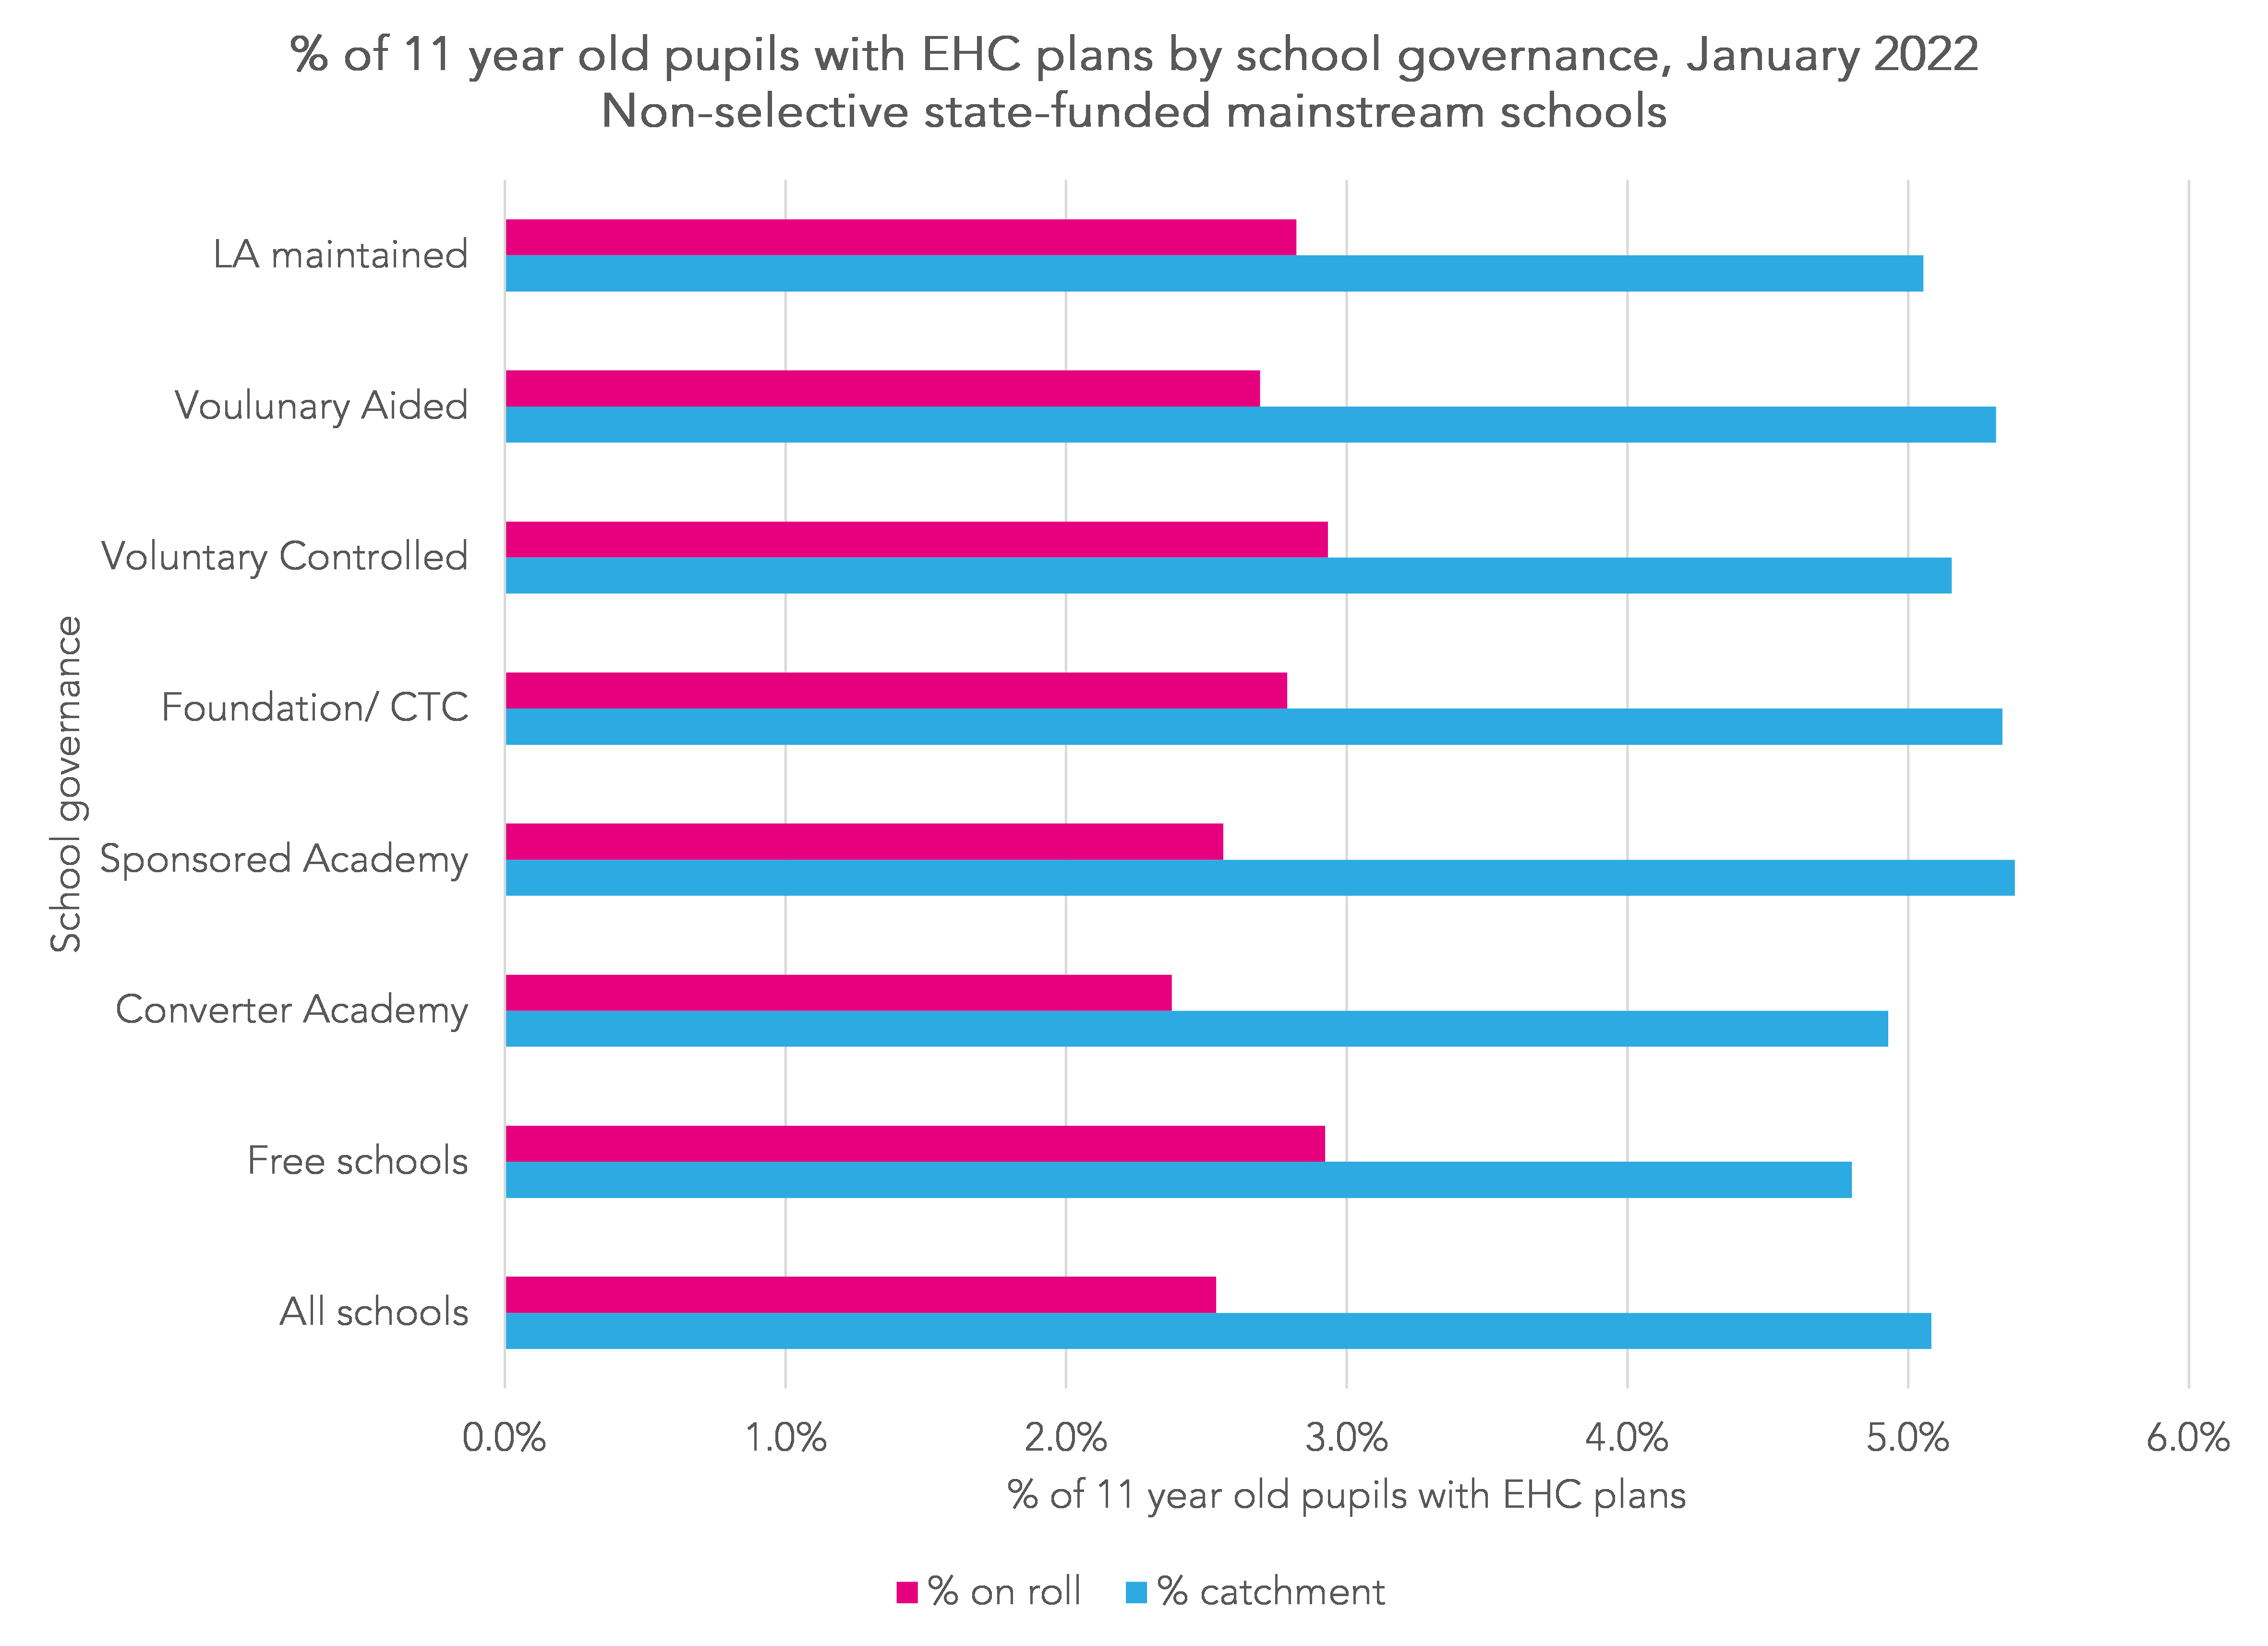
The bars for each school governance type are broadly similar. On the whole, free school intakes tend to be slightly more representative of the area in which they are located (at least in terms of pupils with EHC plans).
Next, we look at Ofsted rating at the start of the school year.

Again, the bars are relatively similar. Schools rated requires improvement or inadequate tended to have slightly fewer pupils with EHC plans relative to their local populations compared to other schools.
However, this varies by region as the table below indicates.

In general, there are twice as many pupils with EHC plans in schools’ catchments than there are on roll.
However, among outstanding schools in the north east, there are over three times as many pupils in schools’ catchments than there are on roll.
That said, this figure is based on a relatively small number of schools (24).
What about large trusts?
Finally, we look at trusts with more than 10 non-selective mainstream schools with 11-year-old pupils.
The chart below plots the percentage of pupils with EHC plans on roll against the percentage resident within schools’ catchments.
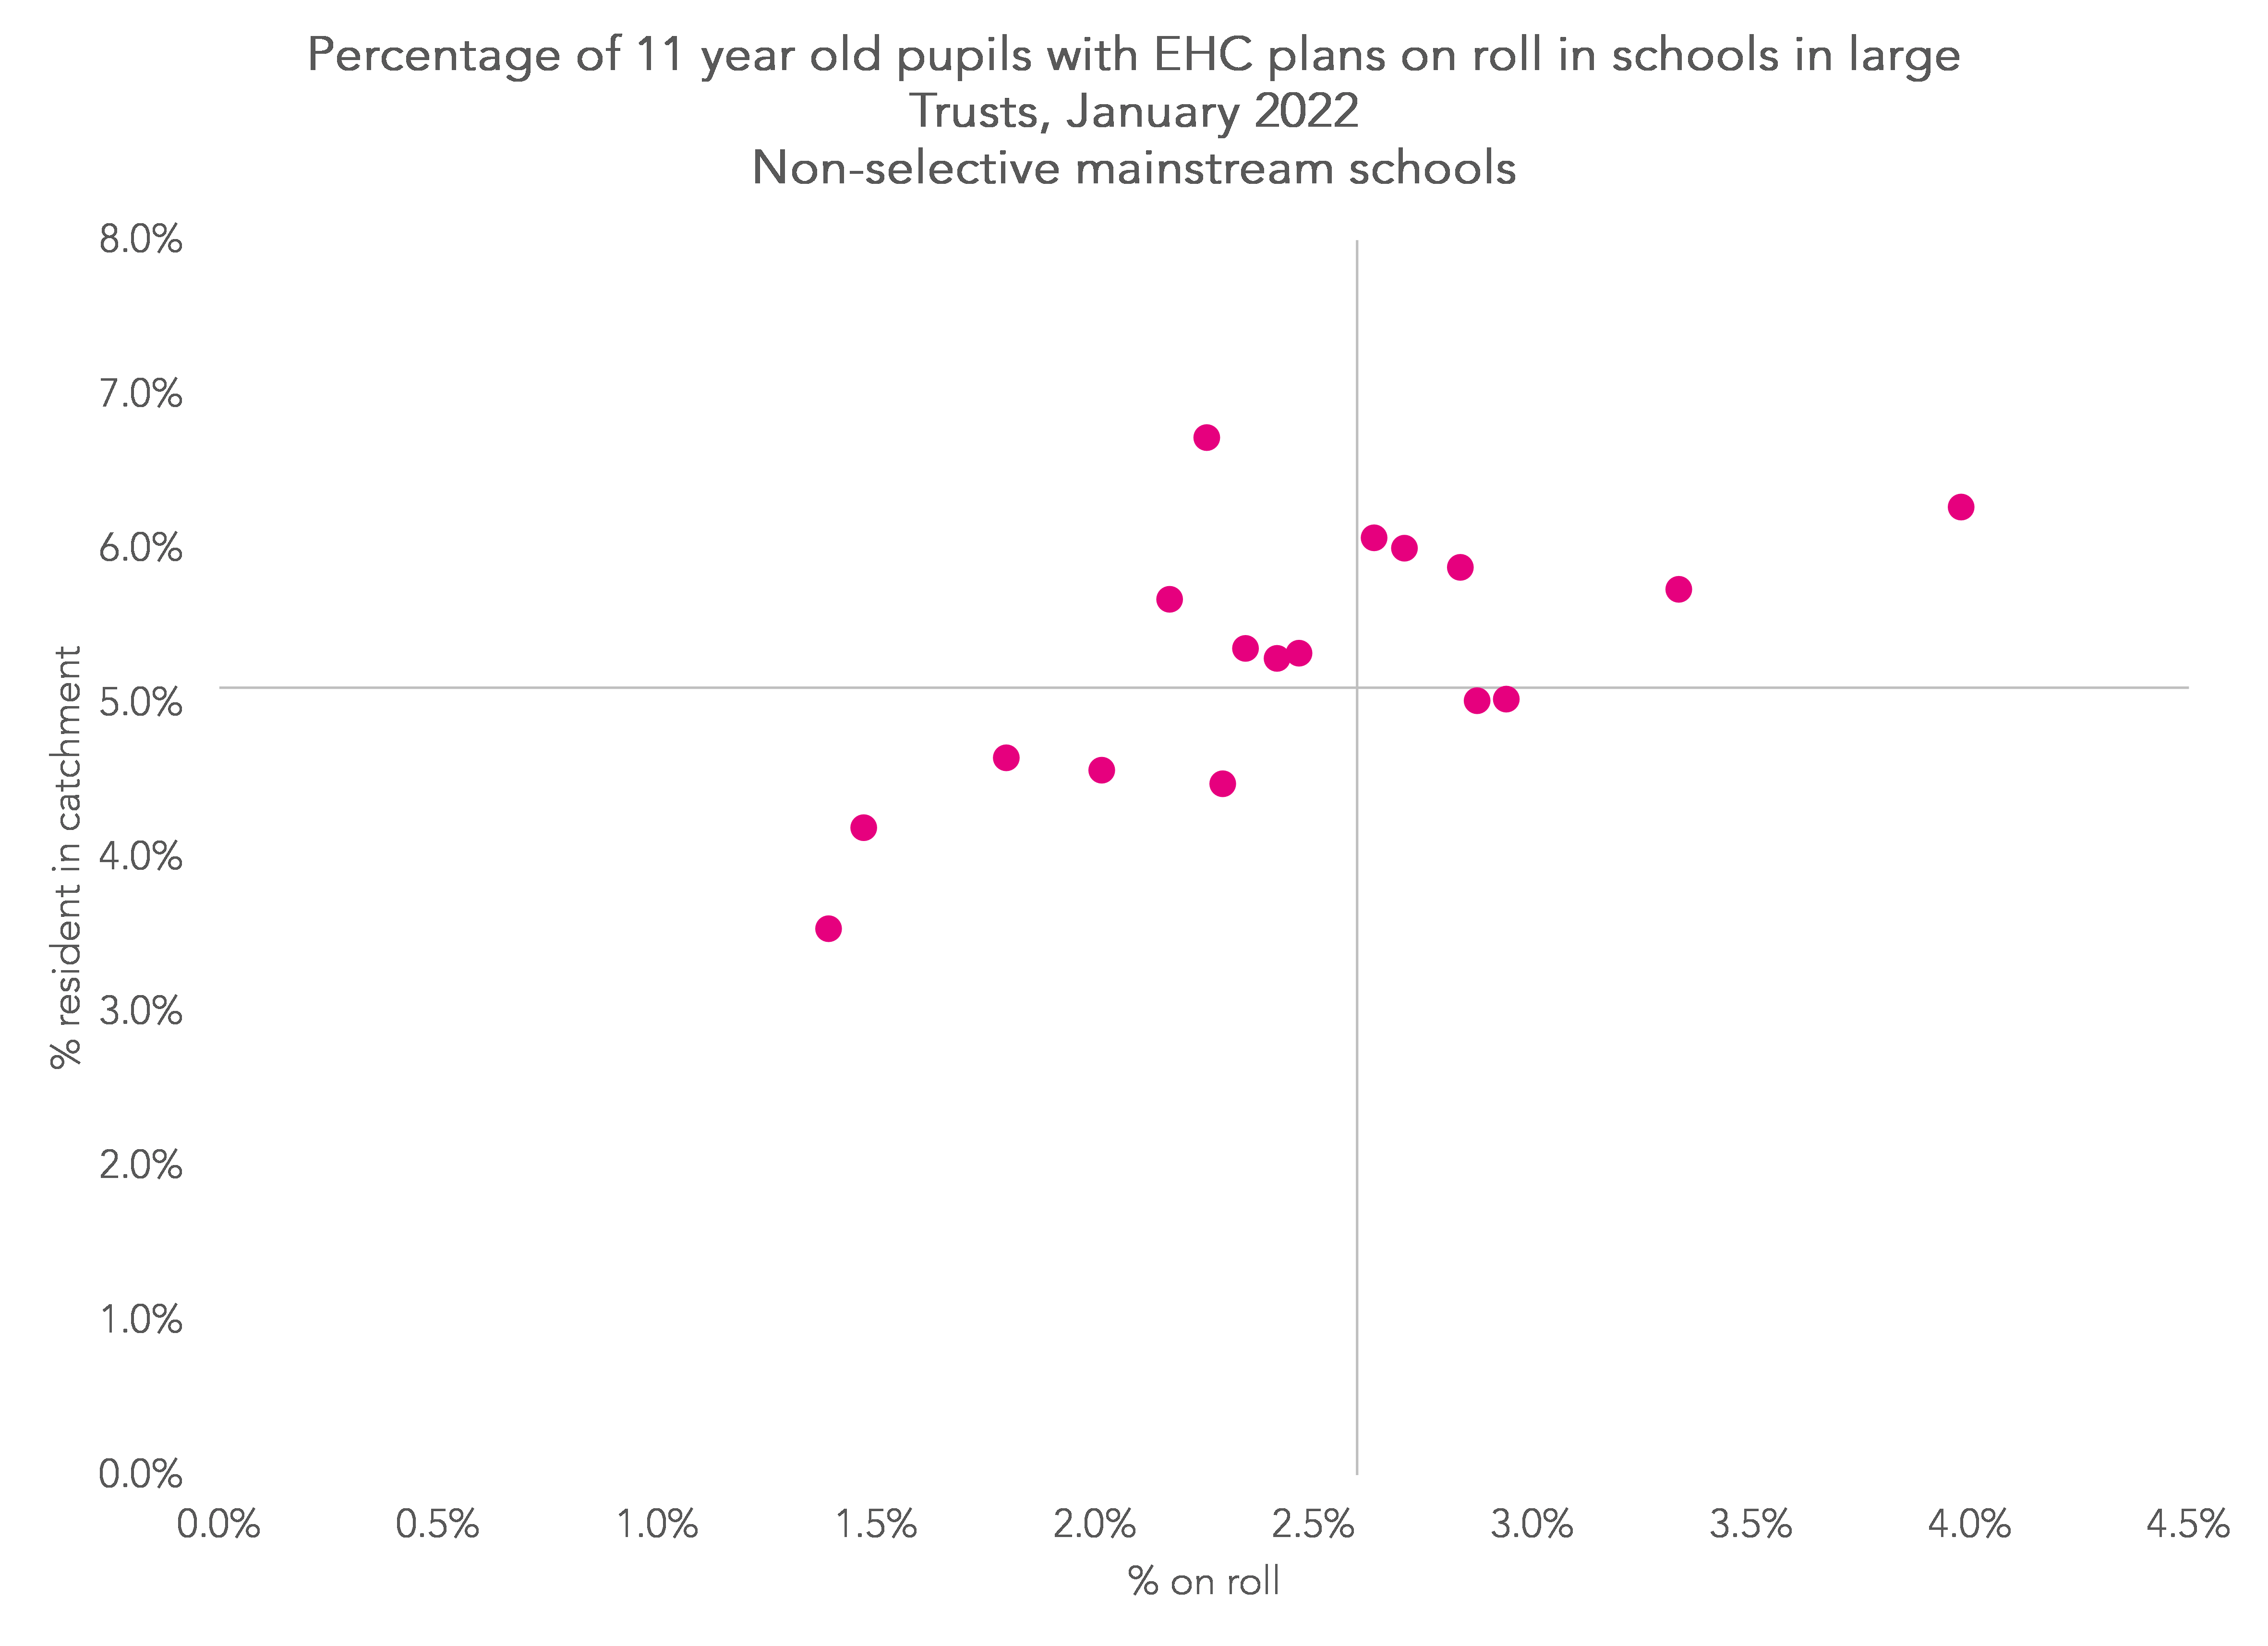
Overall, 2.5% of pupils at this set of trusts had EHC plans compared to 5.3% of pupils resident in their schools’ catchments (national averages were 2.6% and 5.1% respectively).
Each dot represents a trust. The axes are centred on the national average for pupils with EHC plans on roll (the horizontal axis) and resident in schools’ catchments (the vertical axis).
In general, there are twice as many pupils in the catchments as there are on roll. However, there are a couple of trusts in the upper-left quadrant where this ratio is greater. In other words, there are fewer pupils with EHC plans on roll than we might expect given the areas in which their schools are located.
Summing up
There were 276 schools without a single 11-year-old pupil with an EHC plan in January 2022. This includes 94 of the 163 Grammar schools with 11-year-olds.
Some of these schools may well be close to special schools or other mainstream schools with dedicated SEN units or resourced provisions. We’ll look into this in a future article.
On average, each non-selective school recruited about half of the 11-year-old pupils with EHC plans resident within its local area.
There was only a limited amount of variation from this national pattern with respect to school governance and Ofsted rating.
The same could also be said of most large trusts. However, there were two with fewer pupils with EHC plans than might be expected given the areas in which they are located. This could simply be due to natural variation rather than anything systematic. It will be worth repeating this analysis in future years.
Want to stay up-to-date with the latest research from FFT Education Datalab? Sign up to Datalab’s mailing list to get notifications about new blogposts, or to receive the team’s half-termly newsletter.

Leave A Comment