The Timpson Review of 2019 (PDF) identified a number of factors associated with a greater risk of being permanently excluded.
These included some types of SEN, being a boy, being disadvantaged and a history of involvement in social care.
In this post we revisit this work, identify a number of other risk factors and examine the interaction between them.
Data
There is a lag of almost a year in the production of exclusions data. Data for the 2021/22 academic year was published in July 2023. Consequently, data for 2020/21 was the most recent year of data available to me at the time of writing[1].
However, we have to acknowledge the rate of exclusion that year was much lower than pre-pandemic. It also contained a term affected by a lockdown in which the attendance of vulnerable pupils was prioritised.
We restrict our analysis to pupils aged 5-15 (Years 1 to 11 by chronological age) on roll in the Autumn Census of 2020/21. We observe whether or not they were permanently excluded during 2020/21.
For each pupil we also include data on pupil characteristics:
- Age as at 31st August 2020
- Gender
- Ethnic background
- Special educational needs (SEN) status[2]
- % of terms on roll since Reception in receipt of free school meals
- Age first identified with SEN
- Most recent primary SEN type[3]
Note that we use data on SEN prior to exclusion for those who are excluded.
We also include pupils’ Key Stage 1 literacy score and the number of previous suspensions (formerly known as fixed-term exclusions] up to the end of 2019/20.
We did not have data on social care available to us for this piece of analysis. However, this is strongly related to exclusion, SEN and disadvantage as we show here.
Age and Gender
We start by summarising the exclusion rate by age and gender[4].

The risk of exclusion was highest among pupils aged 12-14 (Years 8 to 10).
Across all ages, boys were more likely to be excluded than girls.
Exclusions in the primary age range (5 to 10) are relatively rare. For this reason, the remaining analysis concentrates on the 11-15 range.
Ethnicity and Gender
For those aged 11-15 we now show exclusion rates by ethnicity and gender[4].
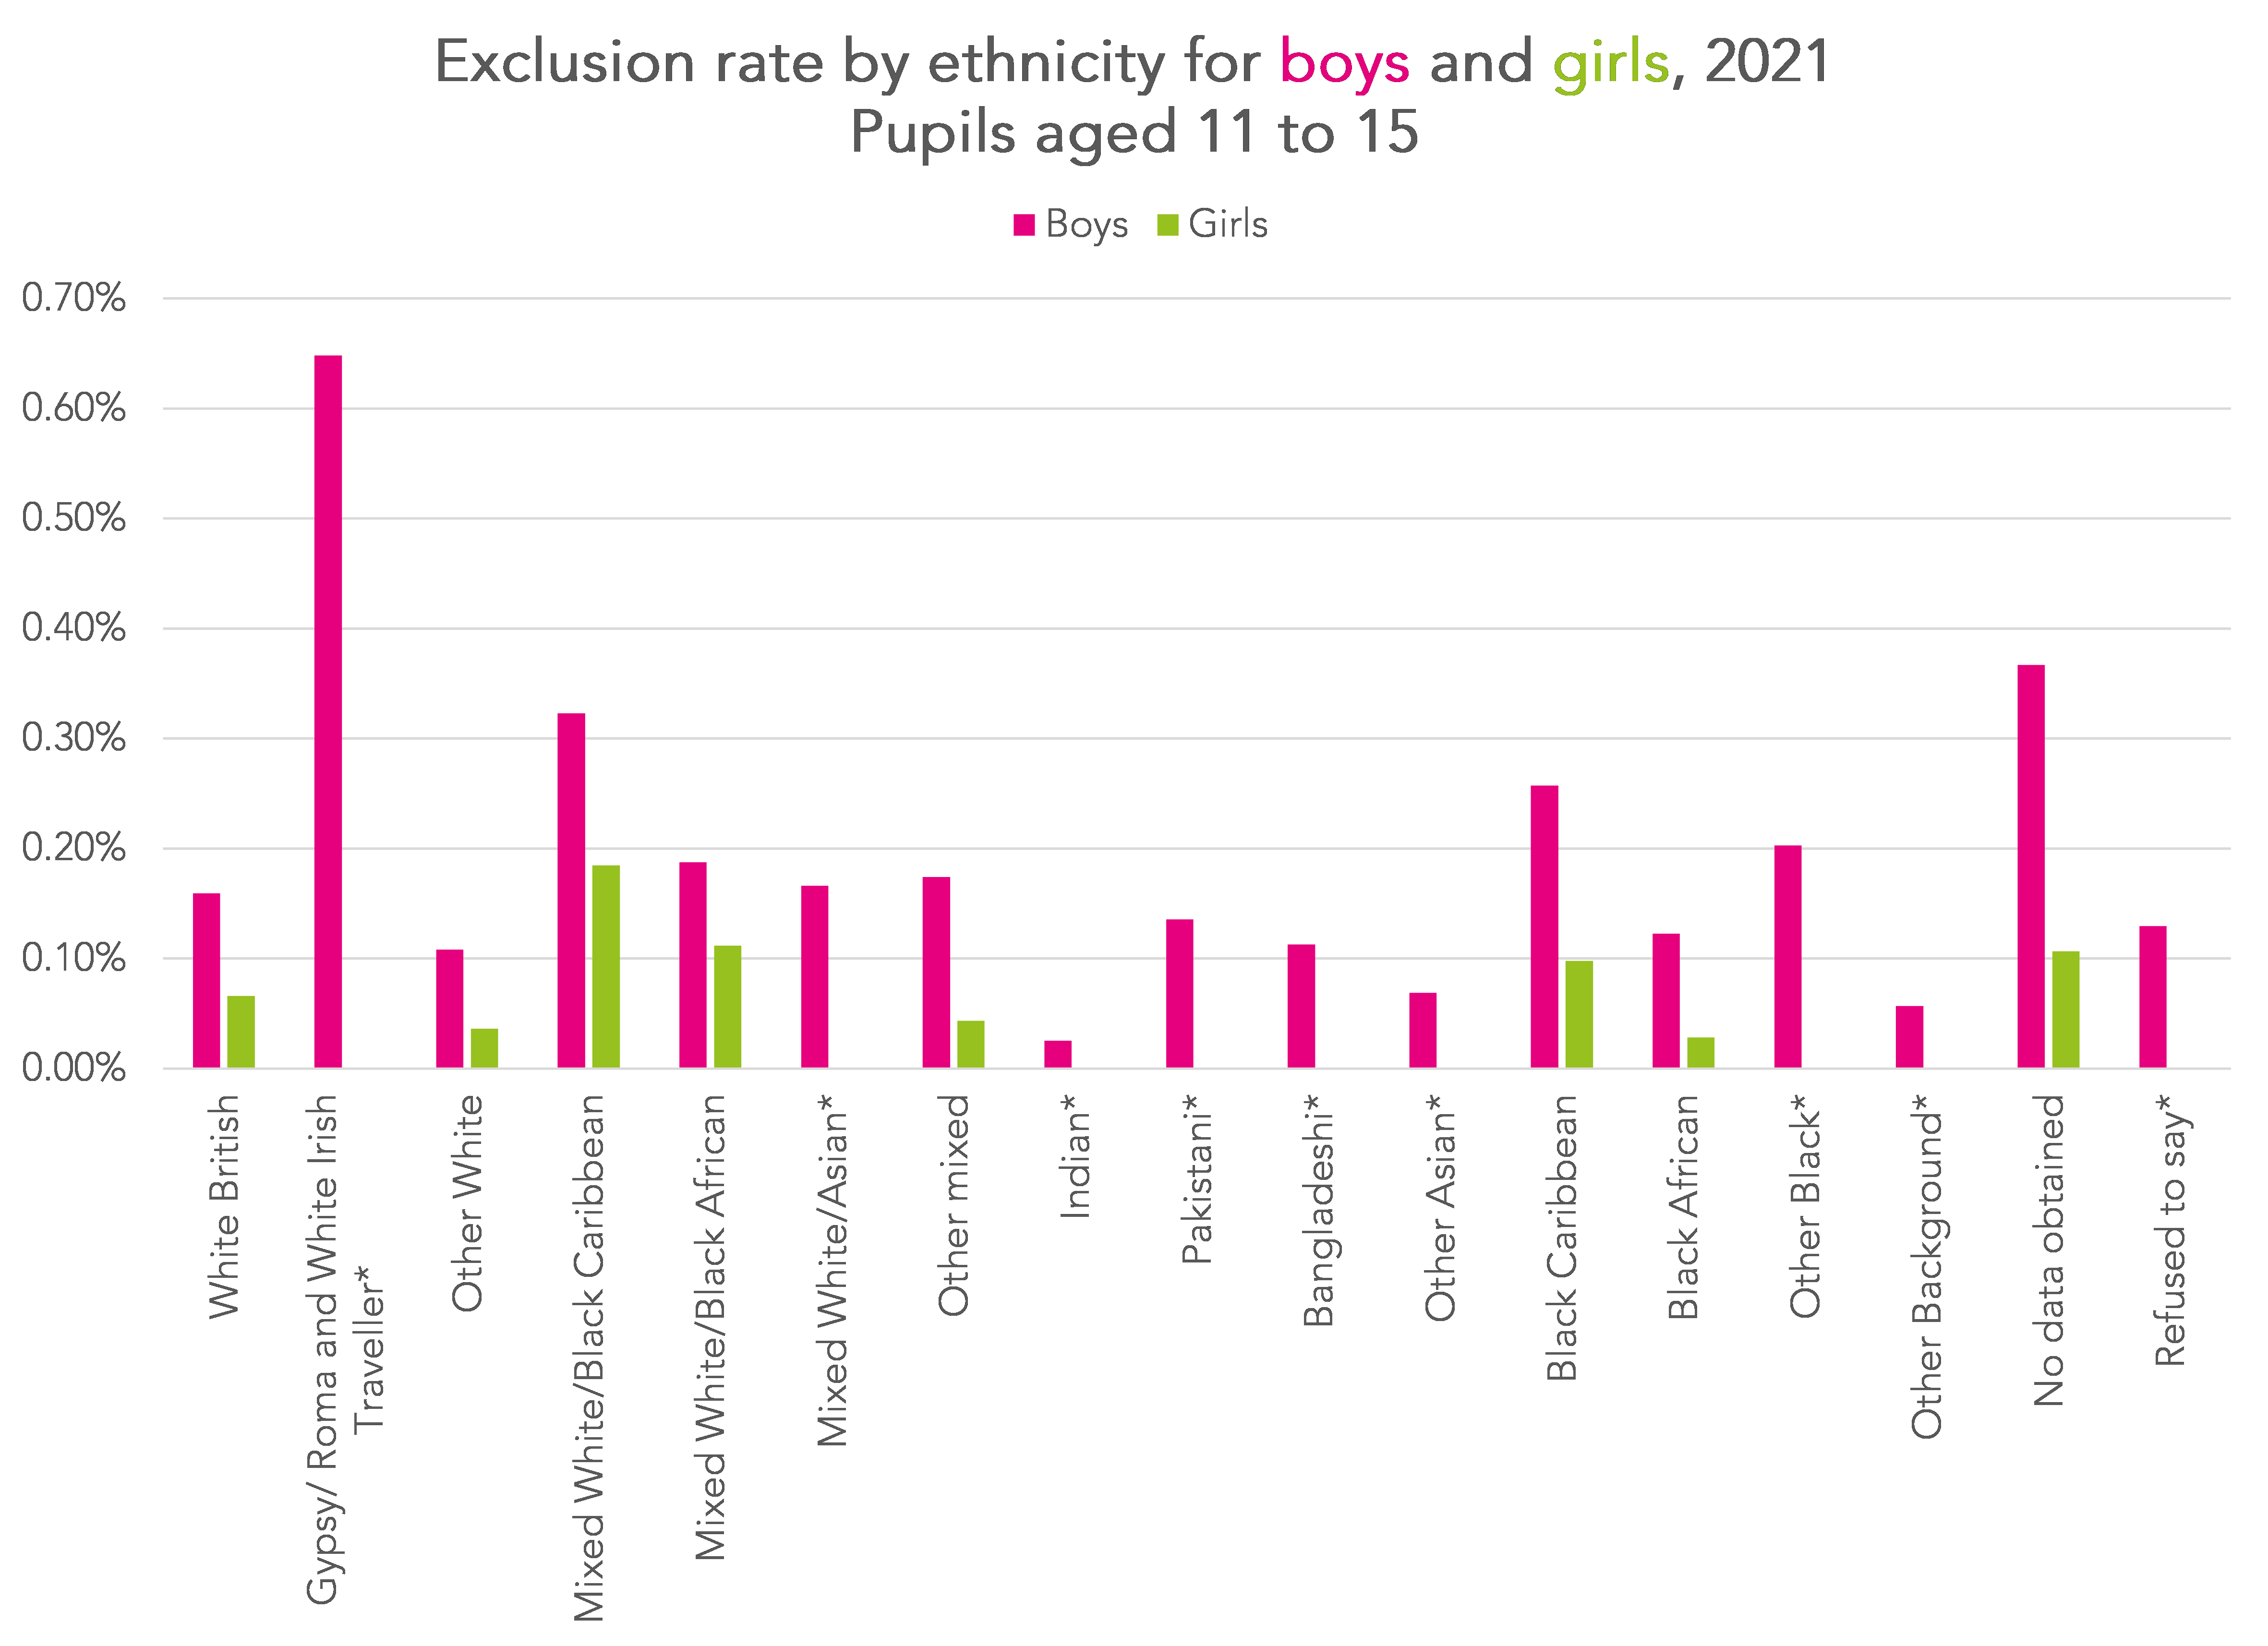
Exclusion rates among pupils from Gypsy/Roma, White Irish Traveller, Black Caribbean and mixed backgrounds were higher than those among pupils from White British backgrounds.
Other risk factors for boys and girls
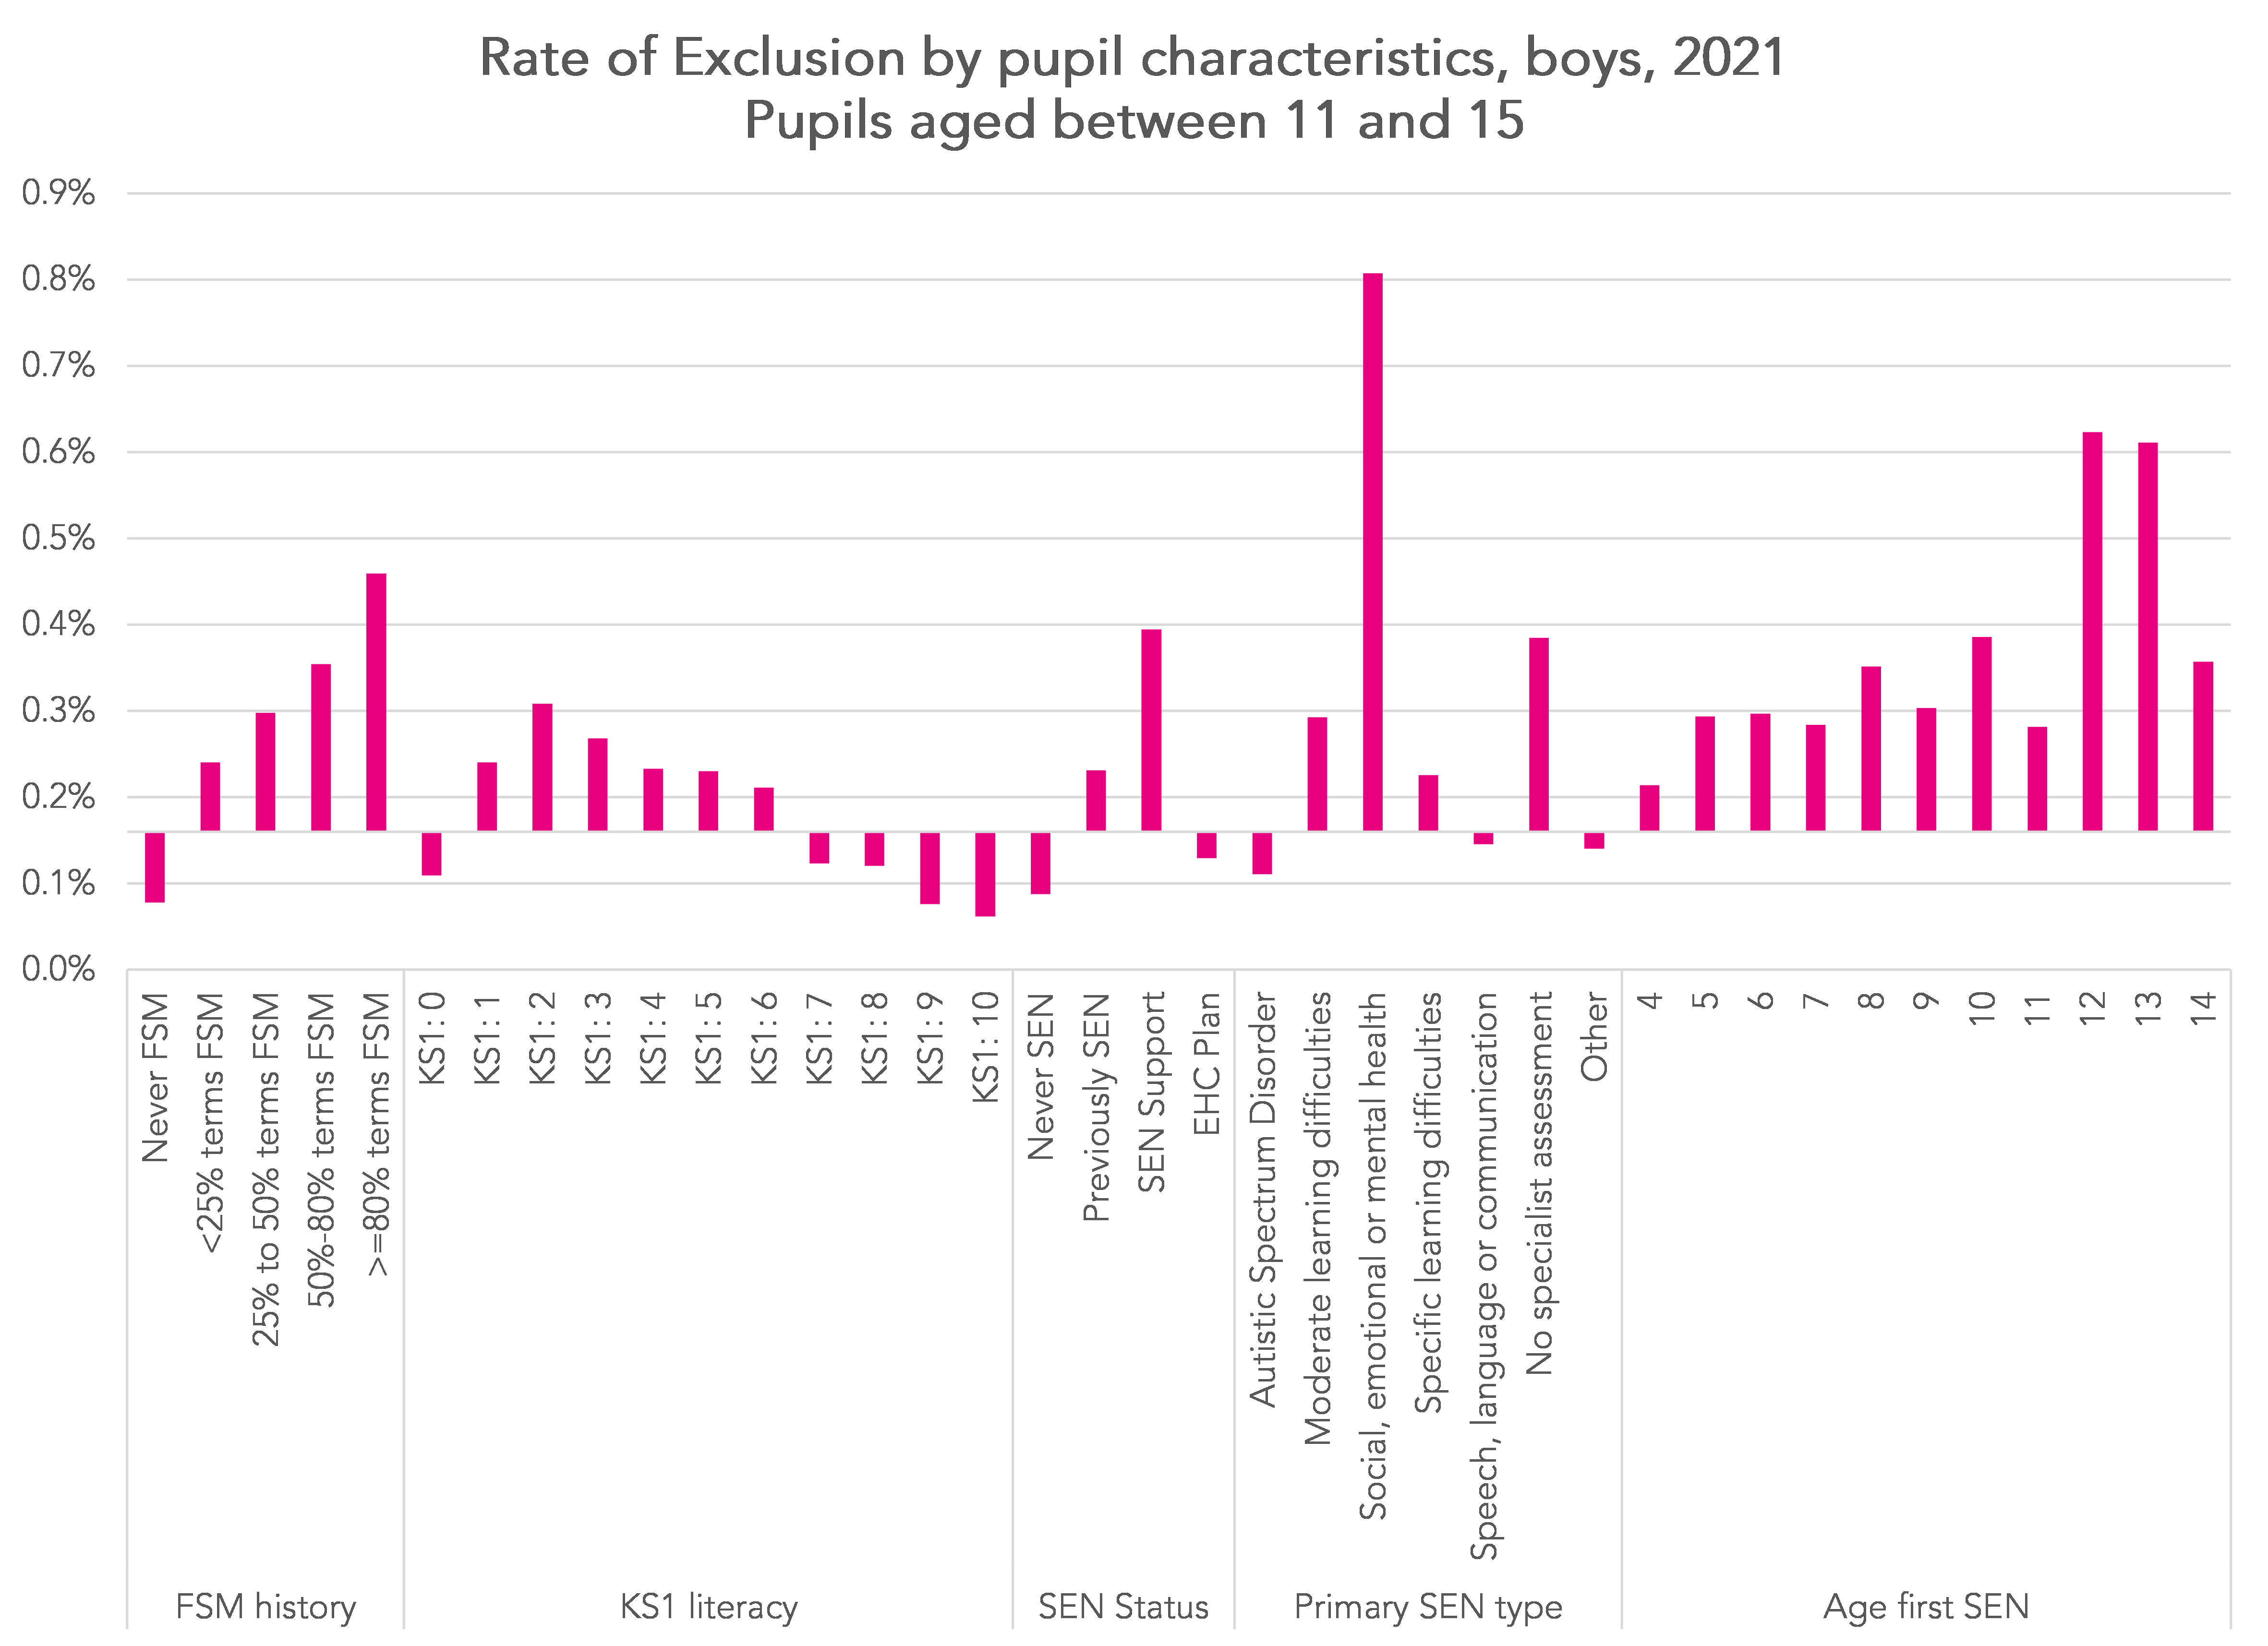
Next, we show a wider set of risk factors for boys. The axis is centred on the average rate for boys aged 11-15 (0.16%).
A similar chart for girls is shown below, this time the axis is centred on the average rate for girls aged 11-15 (0.06%).
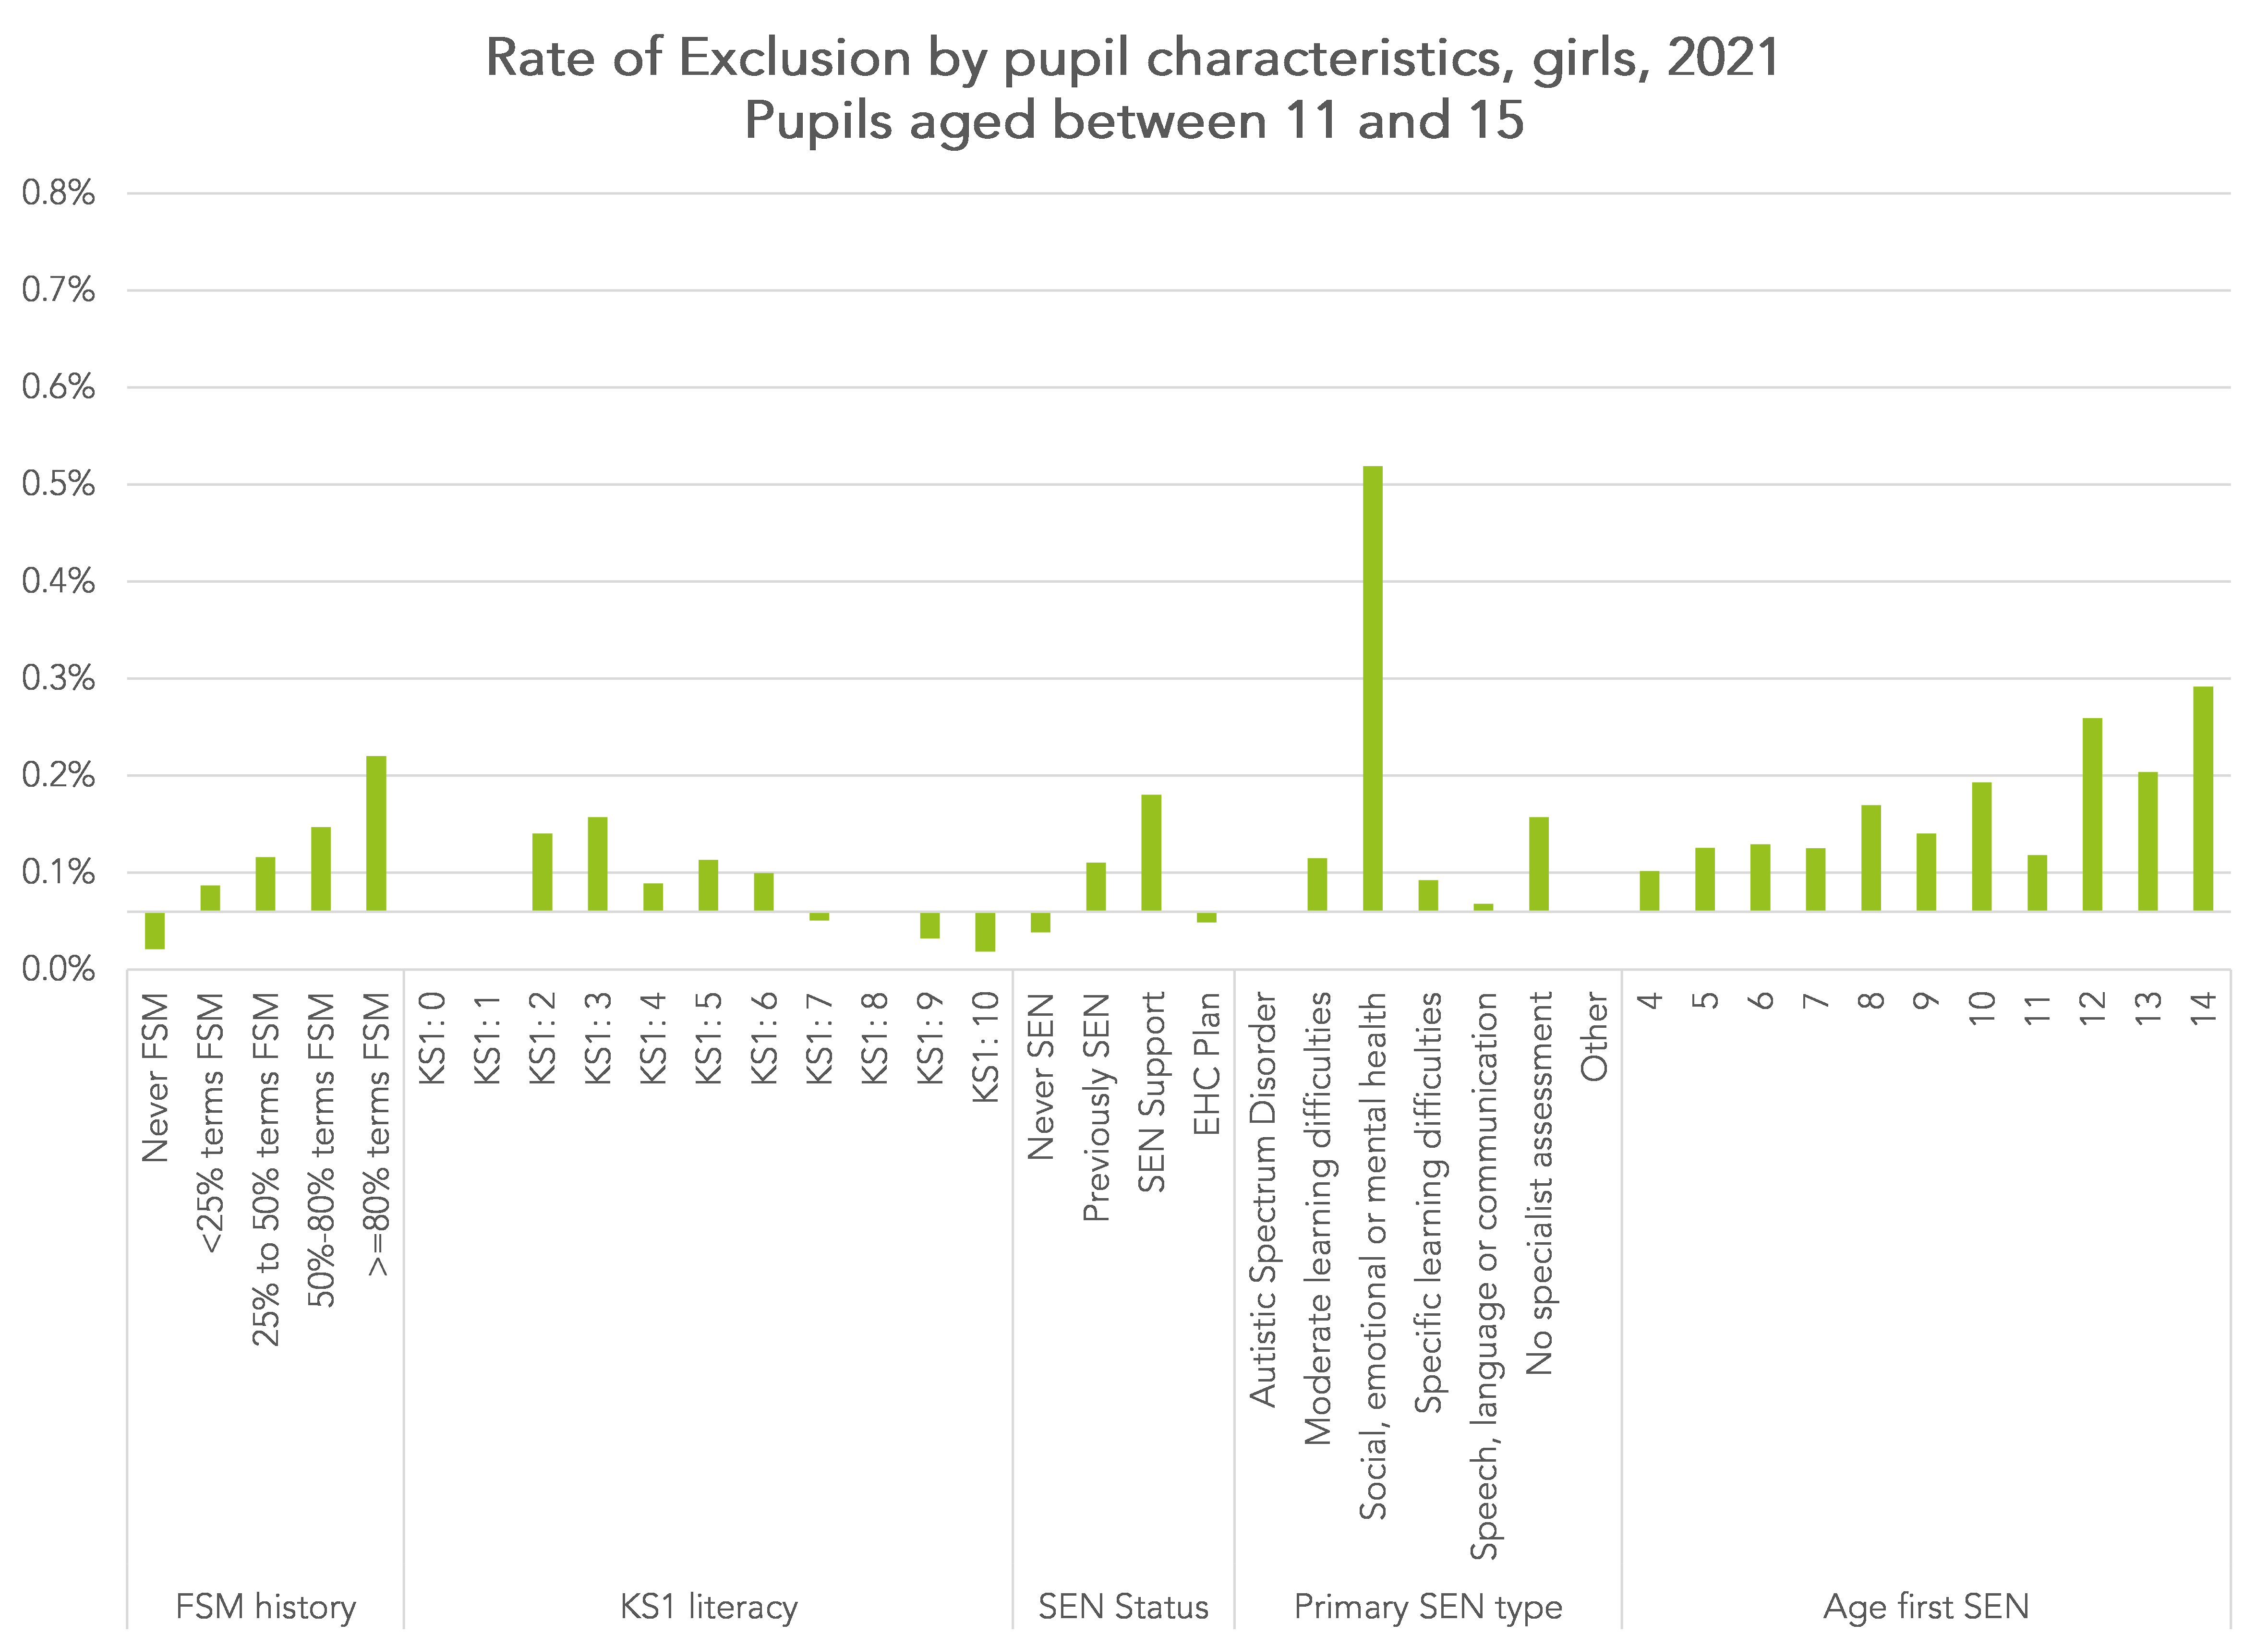
For both boys and girls the shape of the bars is broadly similar.
Pupils with SEN met by SEN support (but not those with EHC plans) and those previously identified as SEN were more likely to be permanently excluded.
The risk was particularly high among those with SEN with a primary type of social, emotional and mental health (SEMH) needs. Rates among pupils with moderate learning difficulties (MLD) and those without a specialist assessment were also above average.
The risk of exclusion also increases with persistence of free school meal eligibility.
Pupils with a Key Stage 1 literacy score in the range 1 to 6 were also more likely to be excluded.
The relationship between SEN, disadvantage and ethnicity
Clearly there are overlaps between low Key Stage 1 attainment, SEN, disadvantage and ethnicity.
Leaving Key Stage 1 attainment to one side for now, we examine a simple relationship between the other three variables.
For each pupil we identify those:
- Ever identified as having SEN up to Autumn 2020/21
- Ever eligible for free school meals up to Autumn 2020/21
- Of a Black Caribbean, mixed White/Black Caribbean, Gypsy/ Roma, White Irish Traveller ethnic background
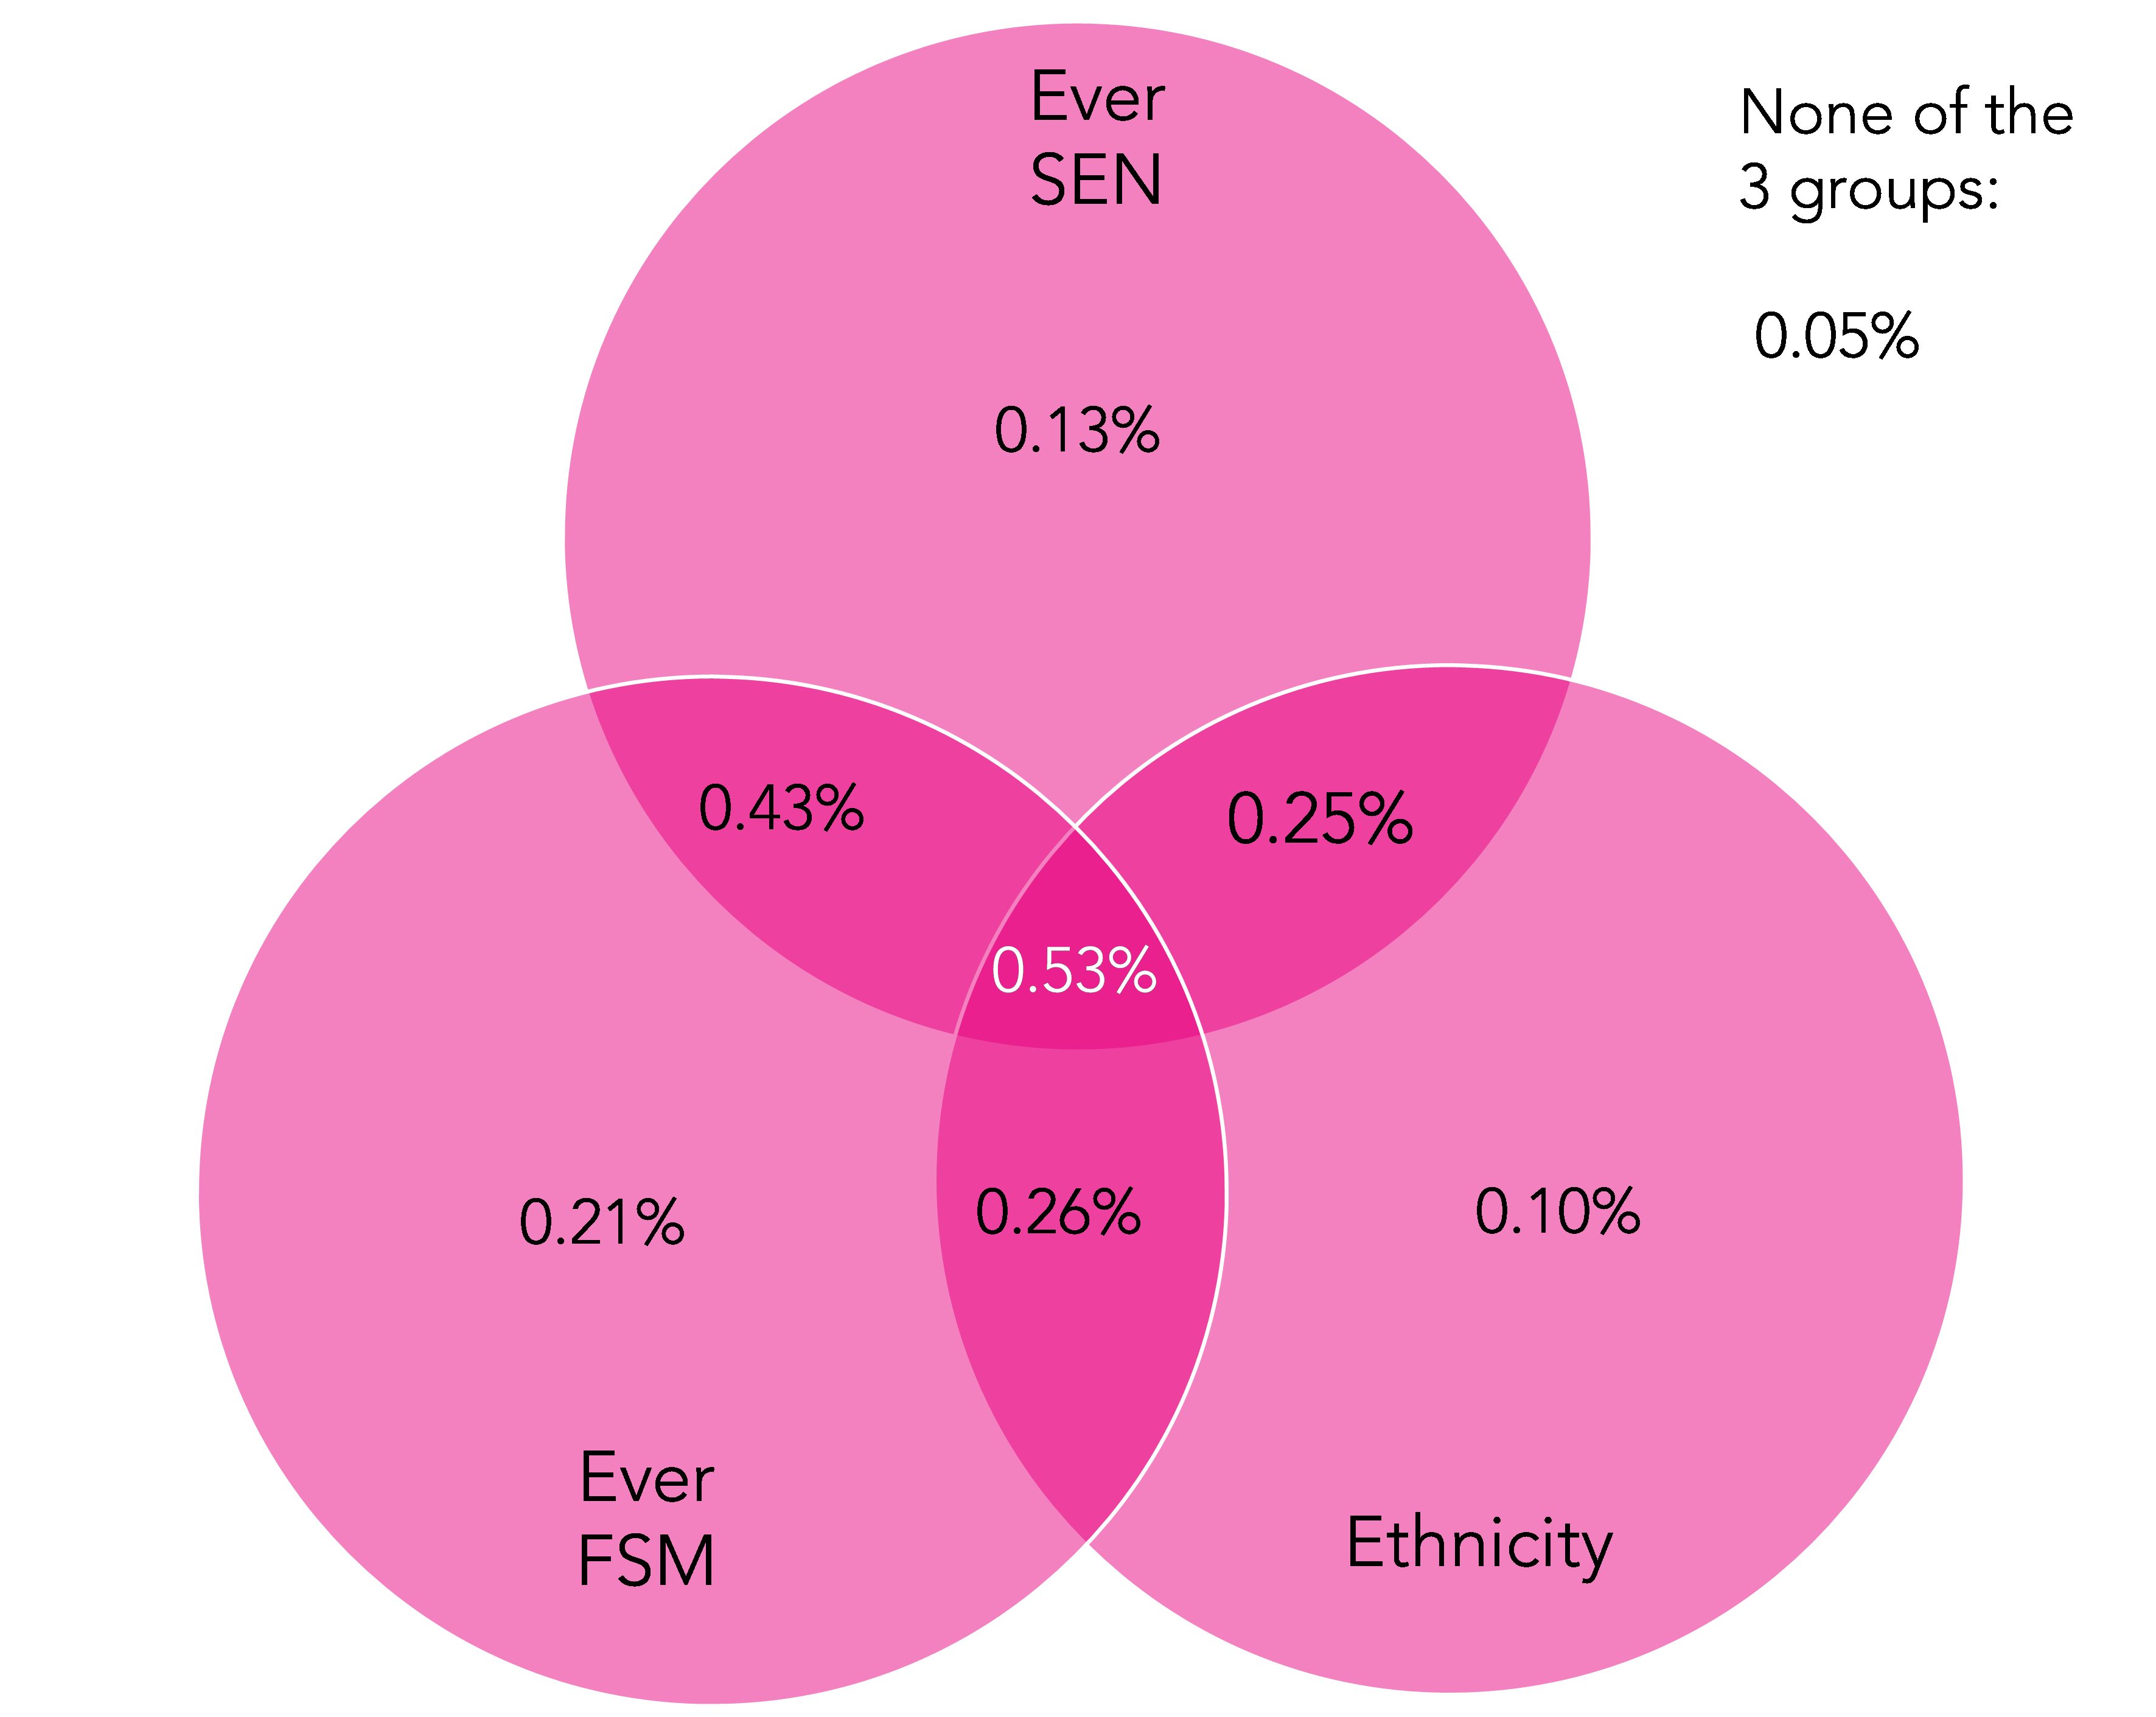
By identifying whether each pupil belongs to each group (or not) we create 8 groups of boys and girls and summarise the exclusion rate for each in the venn diagrams below.
Exclusion rate for boys by Ever SEN, Ever FSM and Ethnicity, 2021
Exclusion rate for girls by Ever SEN, Ever FSM and Ethnicity, 2021
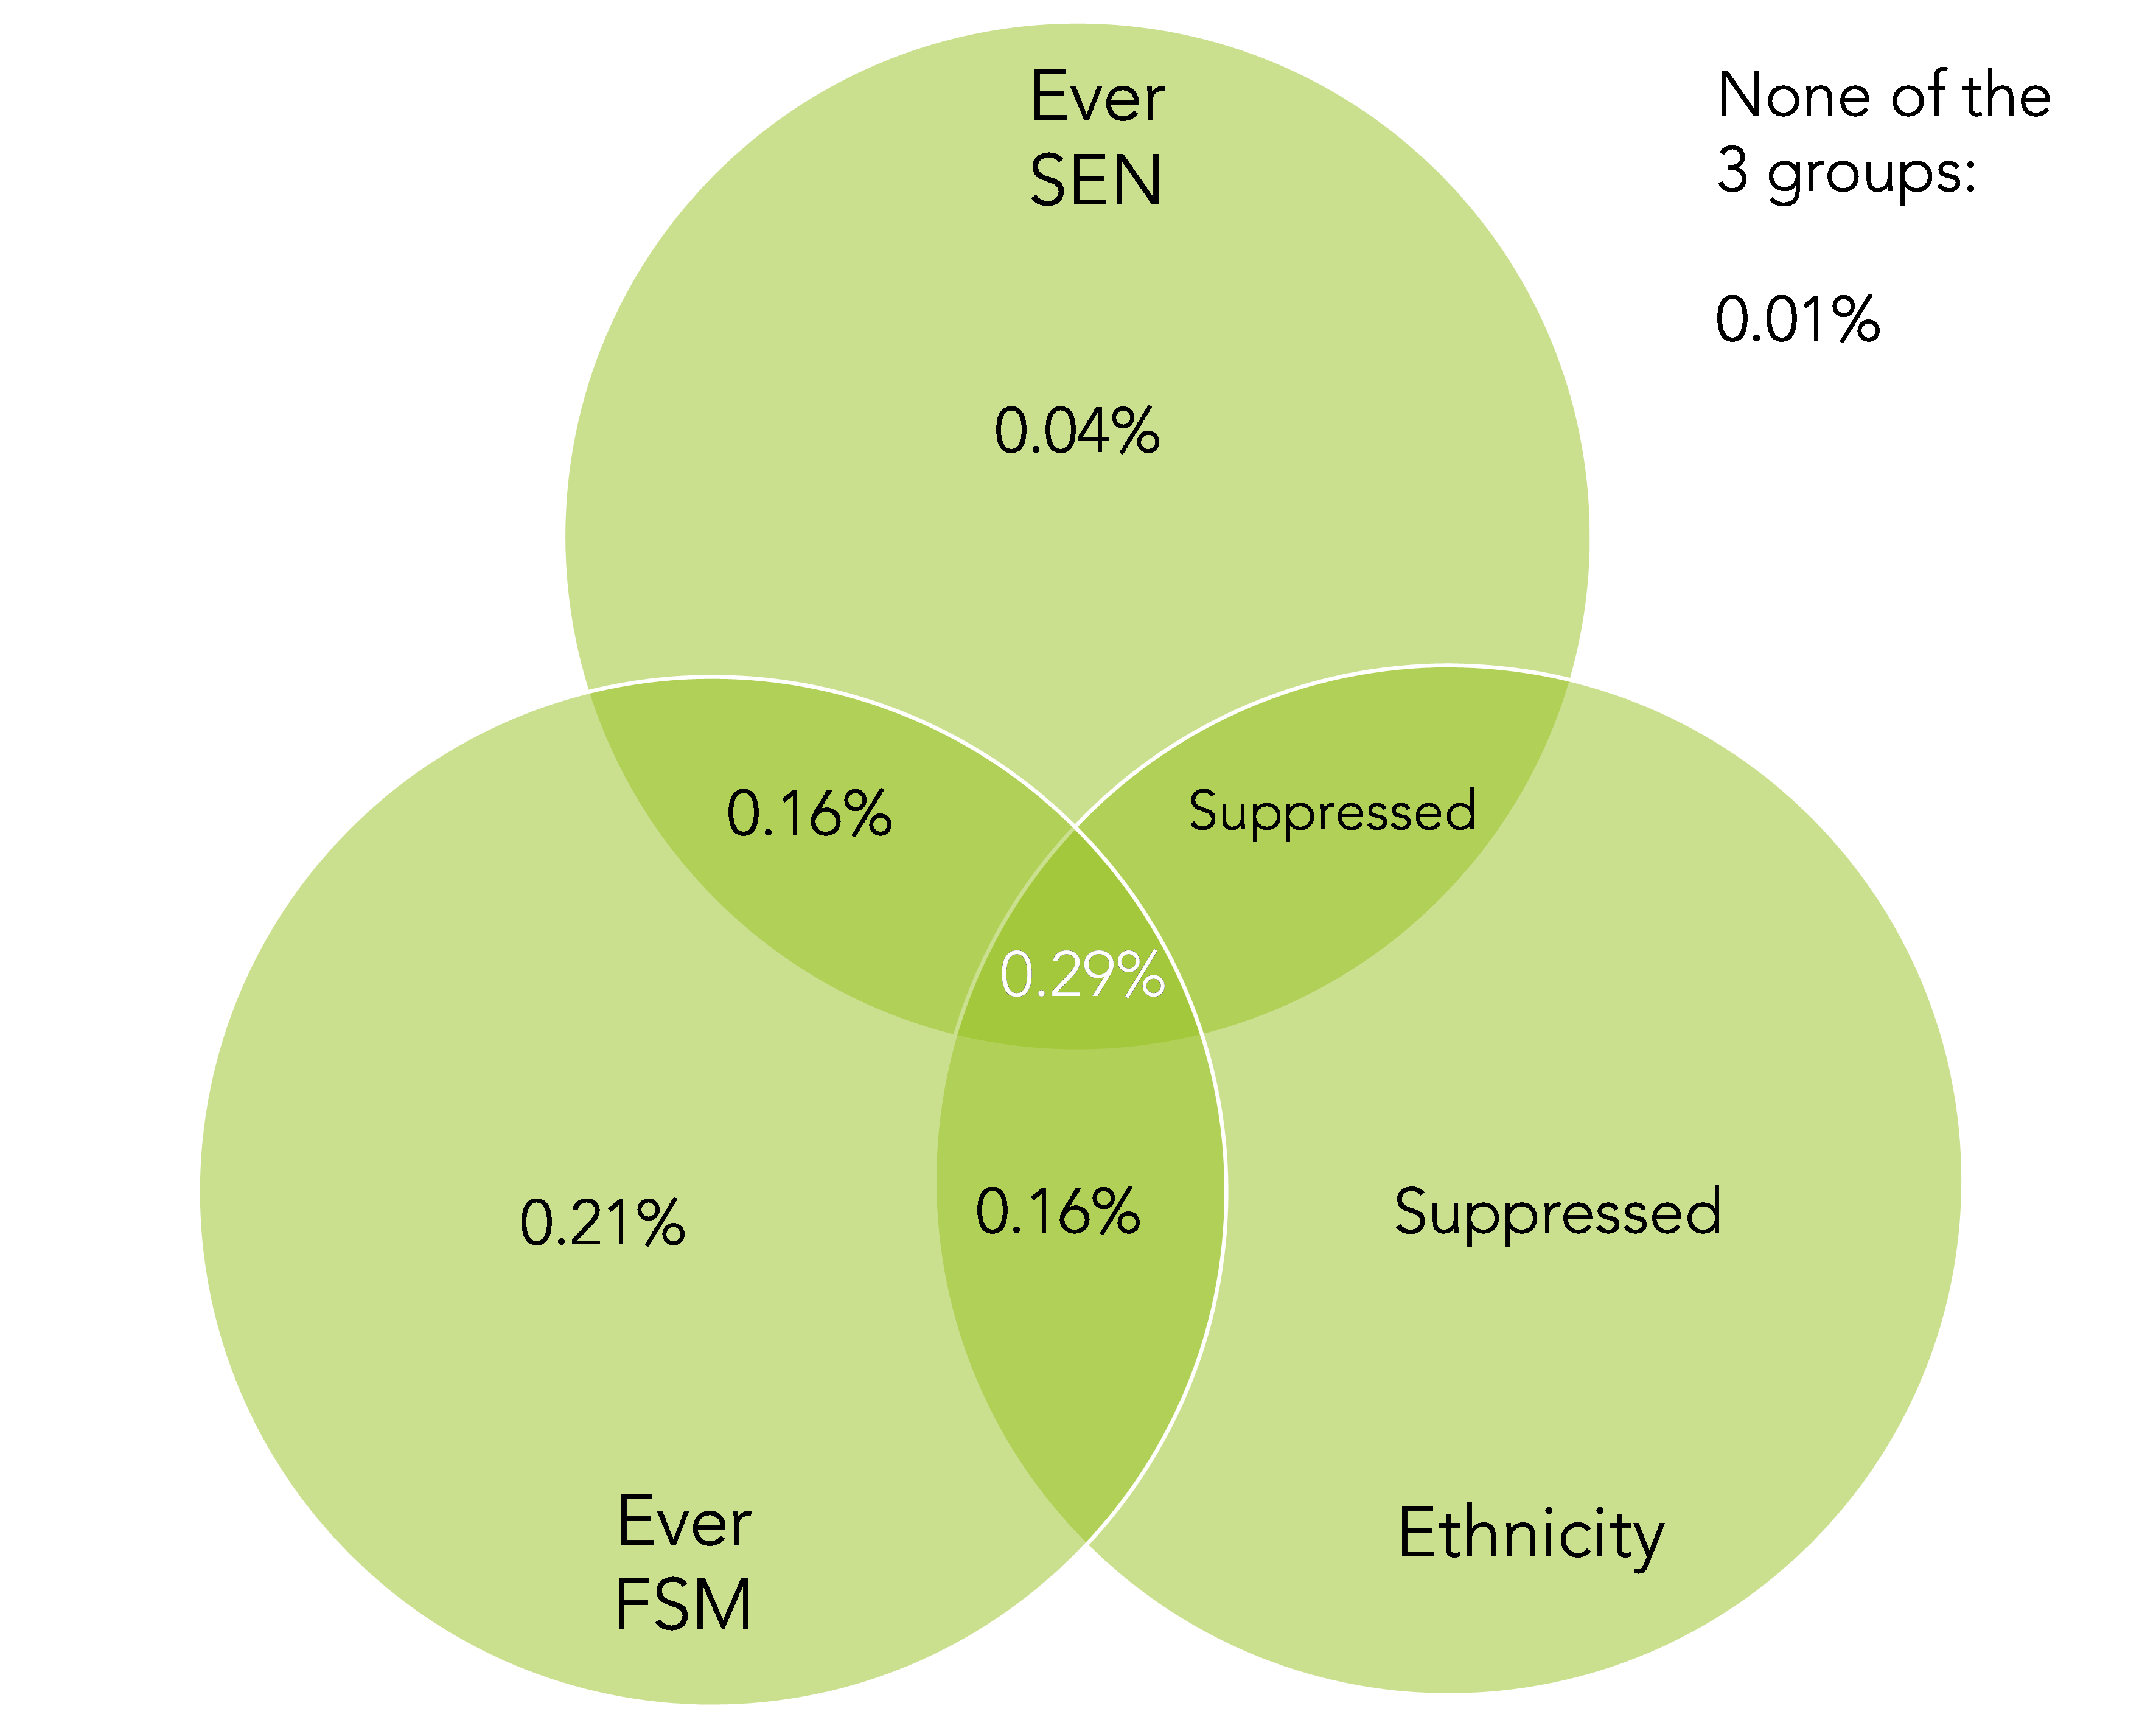
Among boys who have never been identified as having SEN, never eligible for free school meals and not from one of the ethnic groups listed above, the exclusion rate was 0.05%.
But among boys in the “ever SEN” and “ever FSM” groups and from one of the ethnic groups above, the risk of exclusion was ten times higher: 0.53%.
The relative difference among both groups of girls was even higher: (0.01% and 0.29% respectively).
Previous Suspensions
The risk of exclusion in 2020/21 was strongly associated with the number of previous suspensions pupils had up to the end of 2019/20.
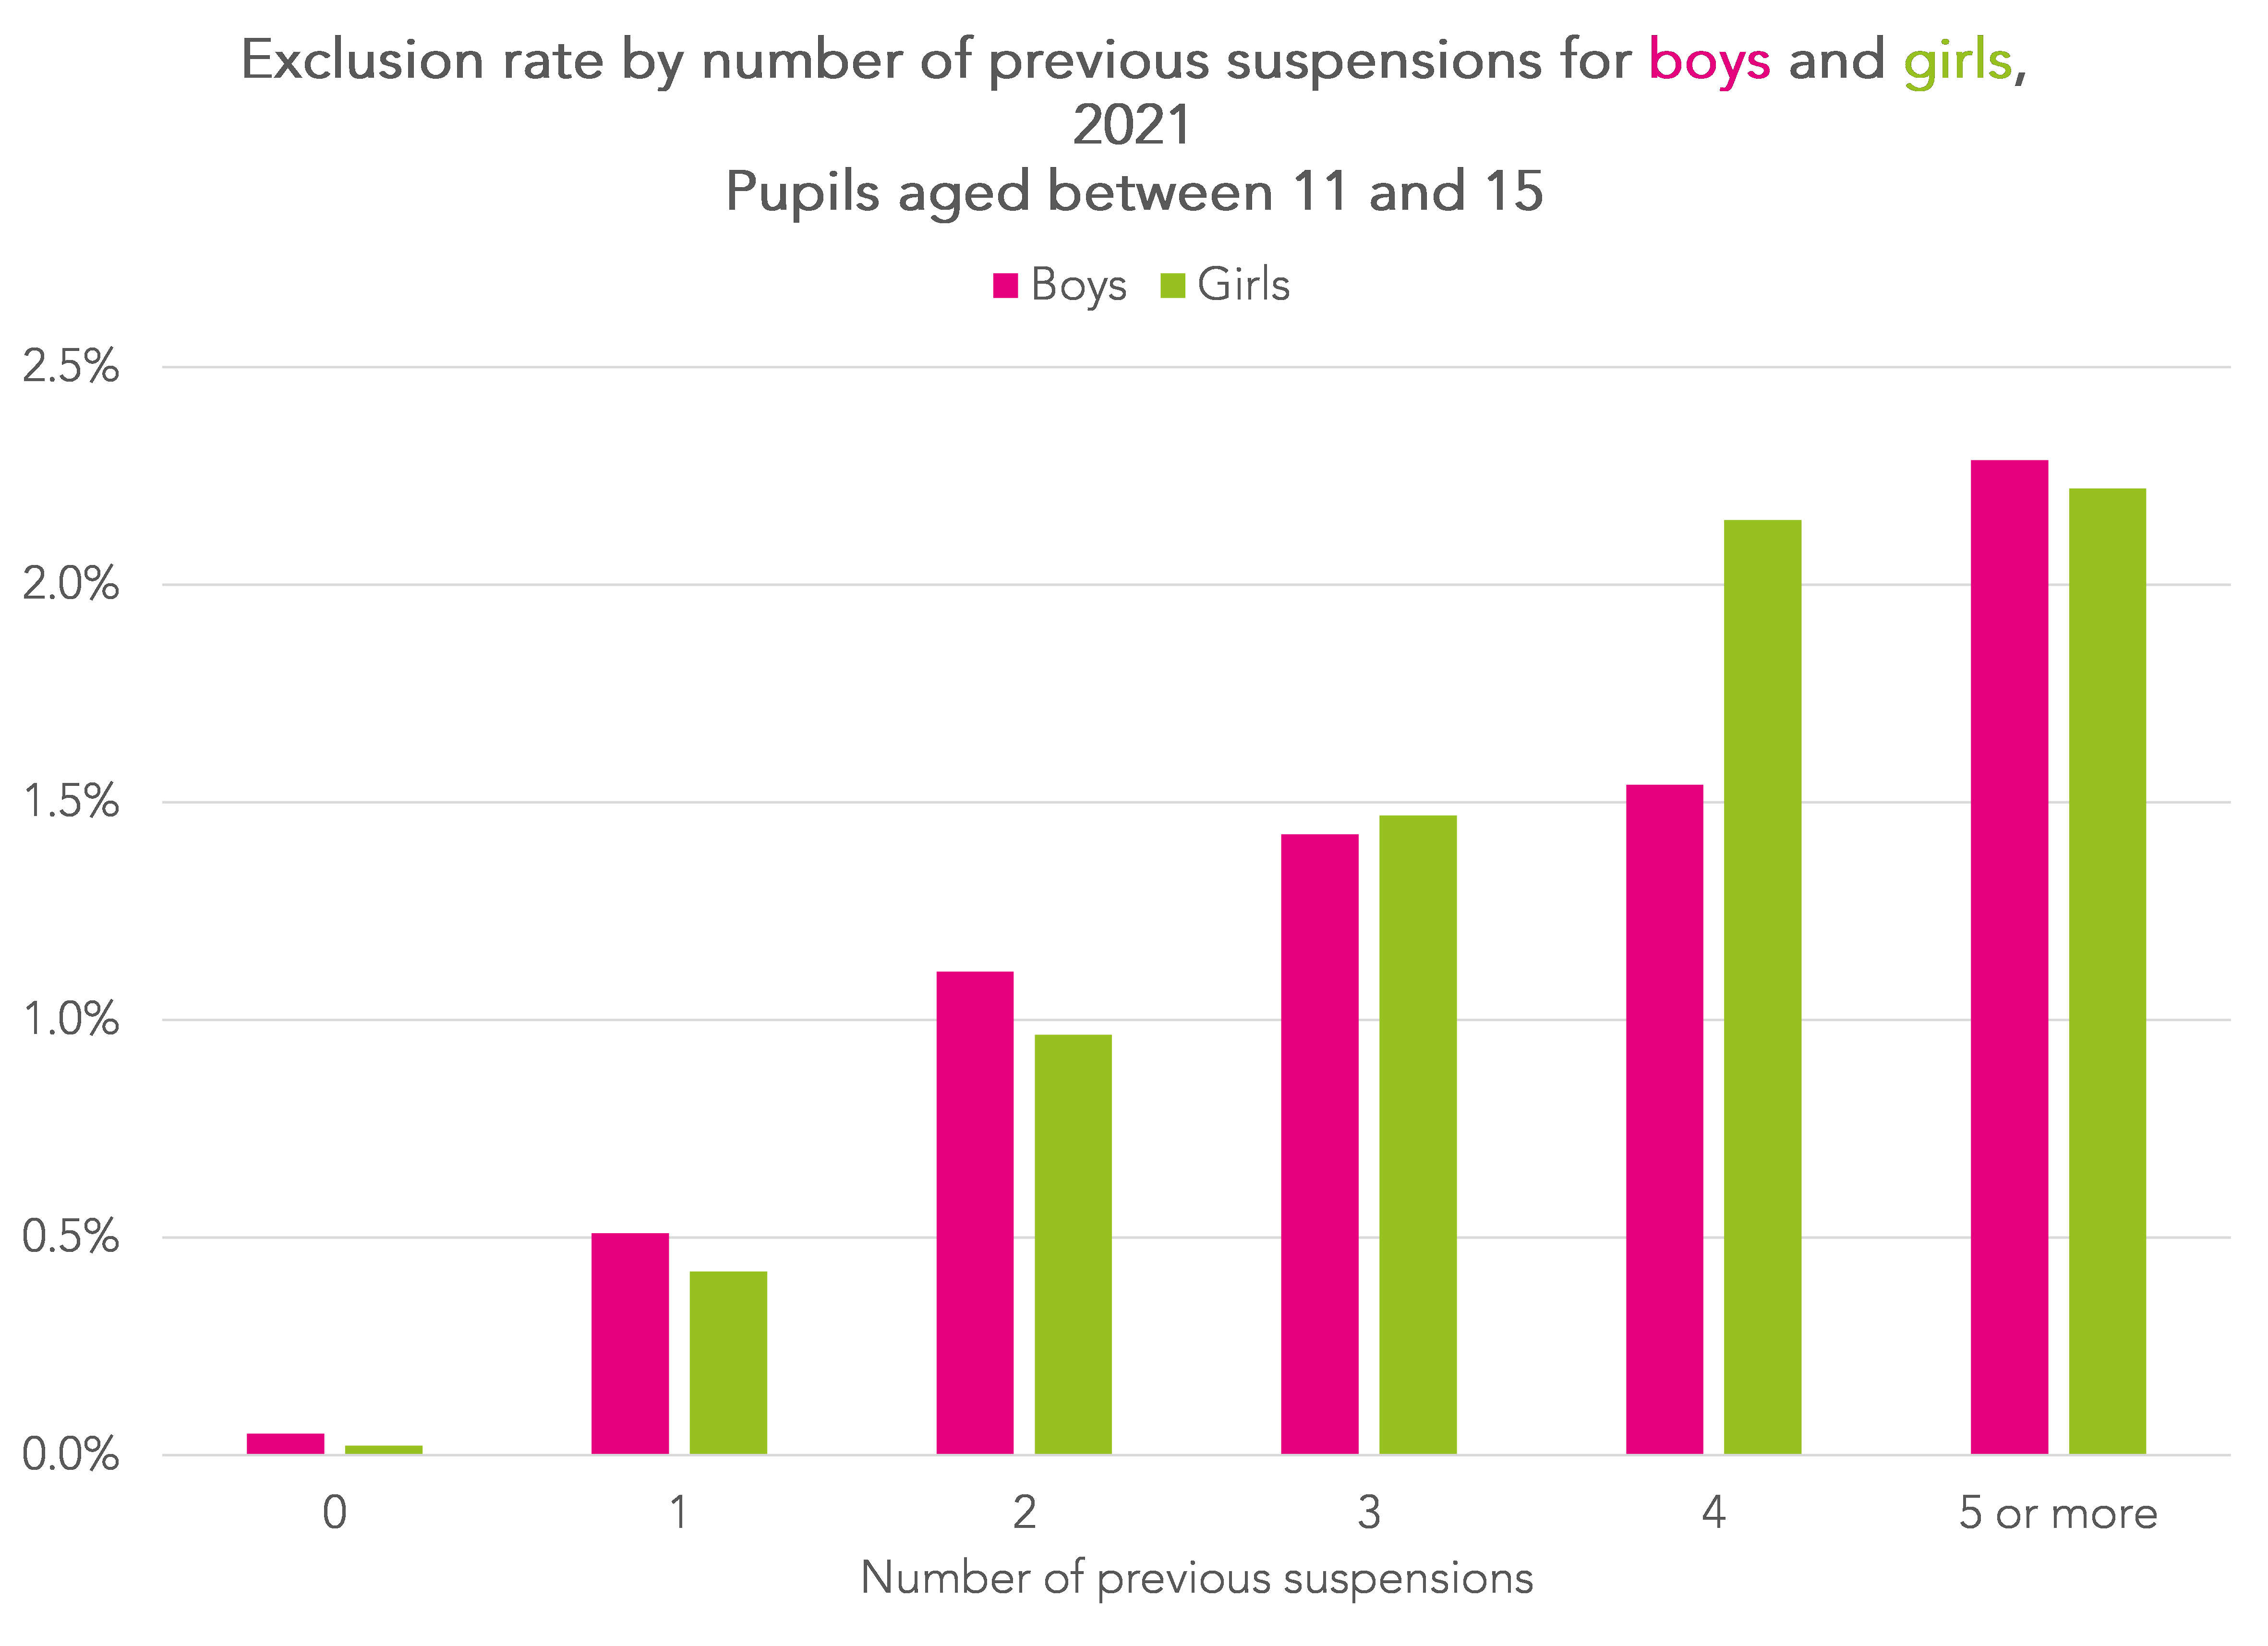
The risk of exclusion increased with the number of previous suspensions.
Among boys with just one previous suspension, the exclusion rate was 0.5%.
This increased to 2.3% among boys with 5 or more suspensions.
By way of comparison, the risk of exclusion for boys with SEMH was 0.8%.
It is also apparent that the risk of exclusion for girls is relatively similar to that of boys when accounting for number of previous suspensions. However, just 4% of girls had a previous suspension compared to 10% of boys.
Summarising Risk Factors
To finish off, we try to calculate a simple “risk factor score” for each pupil.
We do two versions of this, one with the number of previous suspensions and one without.
For the method without number of previous suspensions, each of the following risks scores 1 point:
- Boys
- Ever identified as having SEN up to Autumn 2020/21
- Ever eligible for free school meals up to Autumn 2020/21
- Of a Black Caribbean, mixed White/Black Caribbean, Gypsy/ Roma, White Irish Traveller ethnic background
- Key Stage 1 literacy score between 1 and 6
- Ever being identified as having SEN with a primary type of SEMH
The risk of exclusion in 2020/21 increased with the number of risk factors.
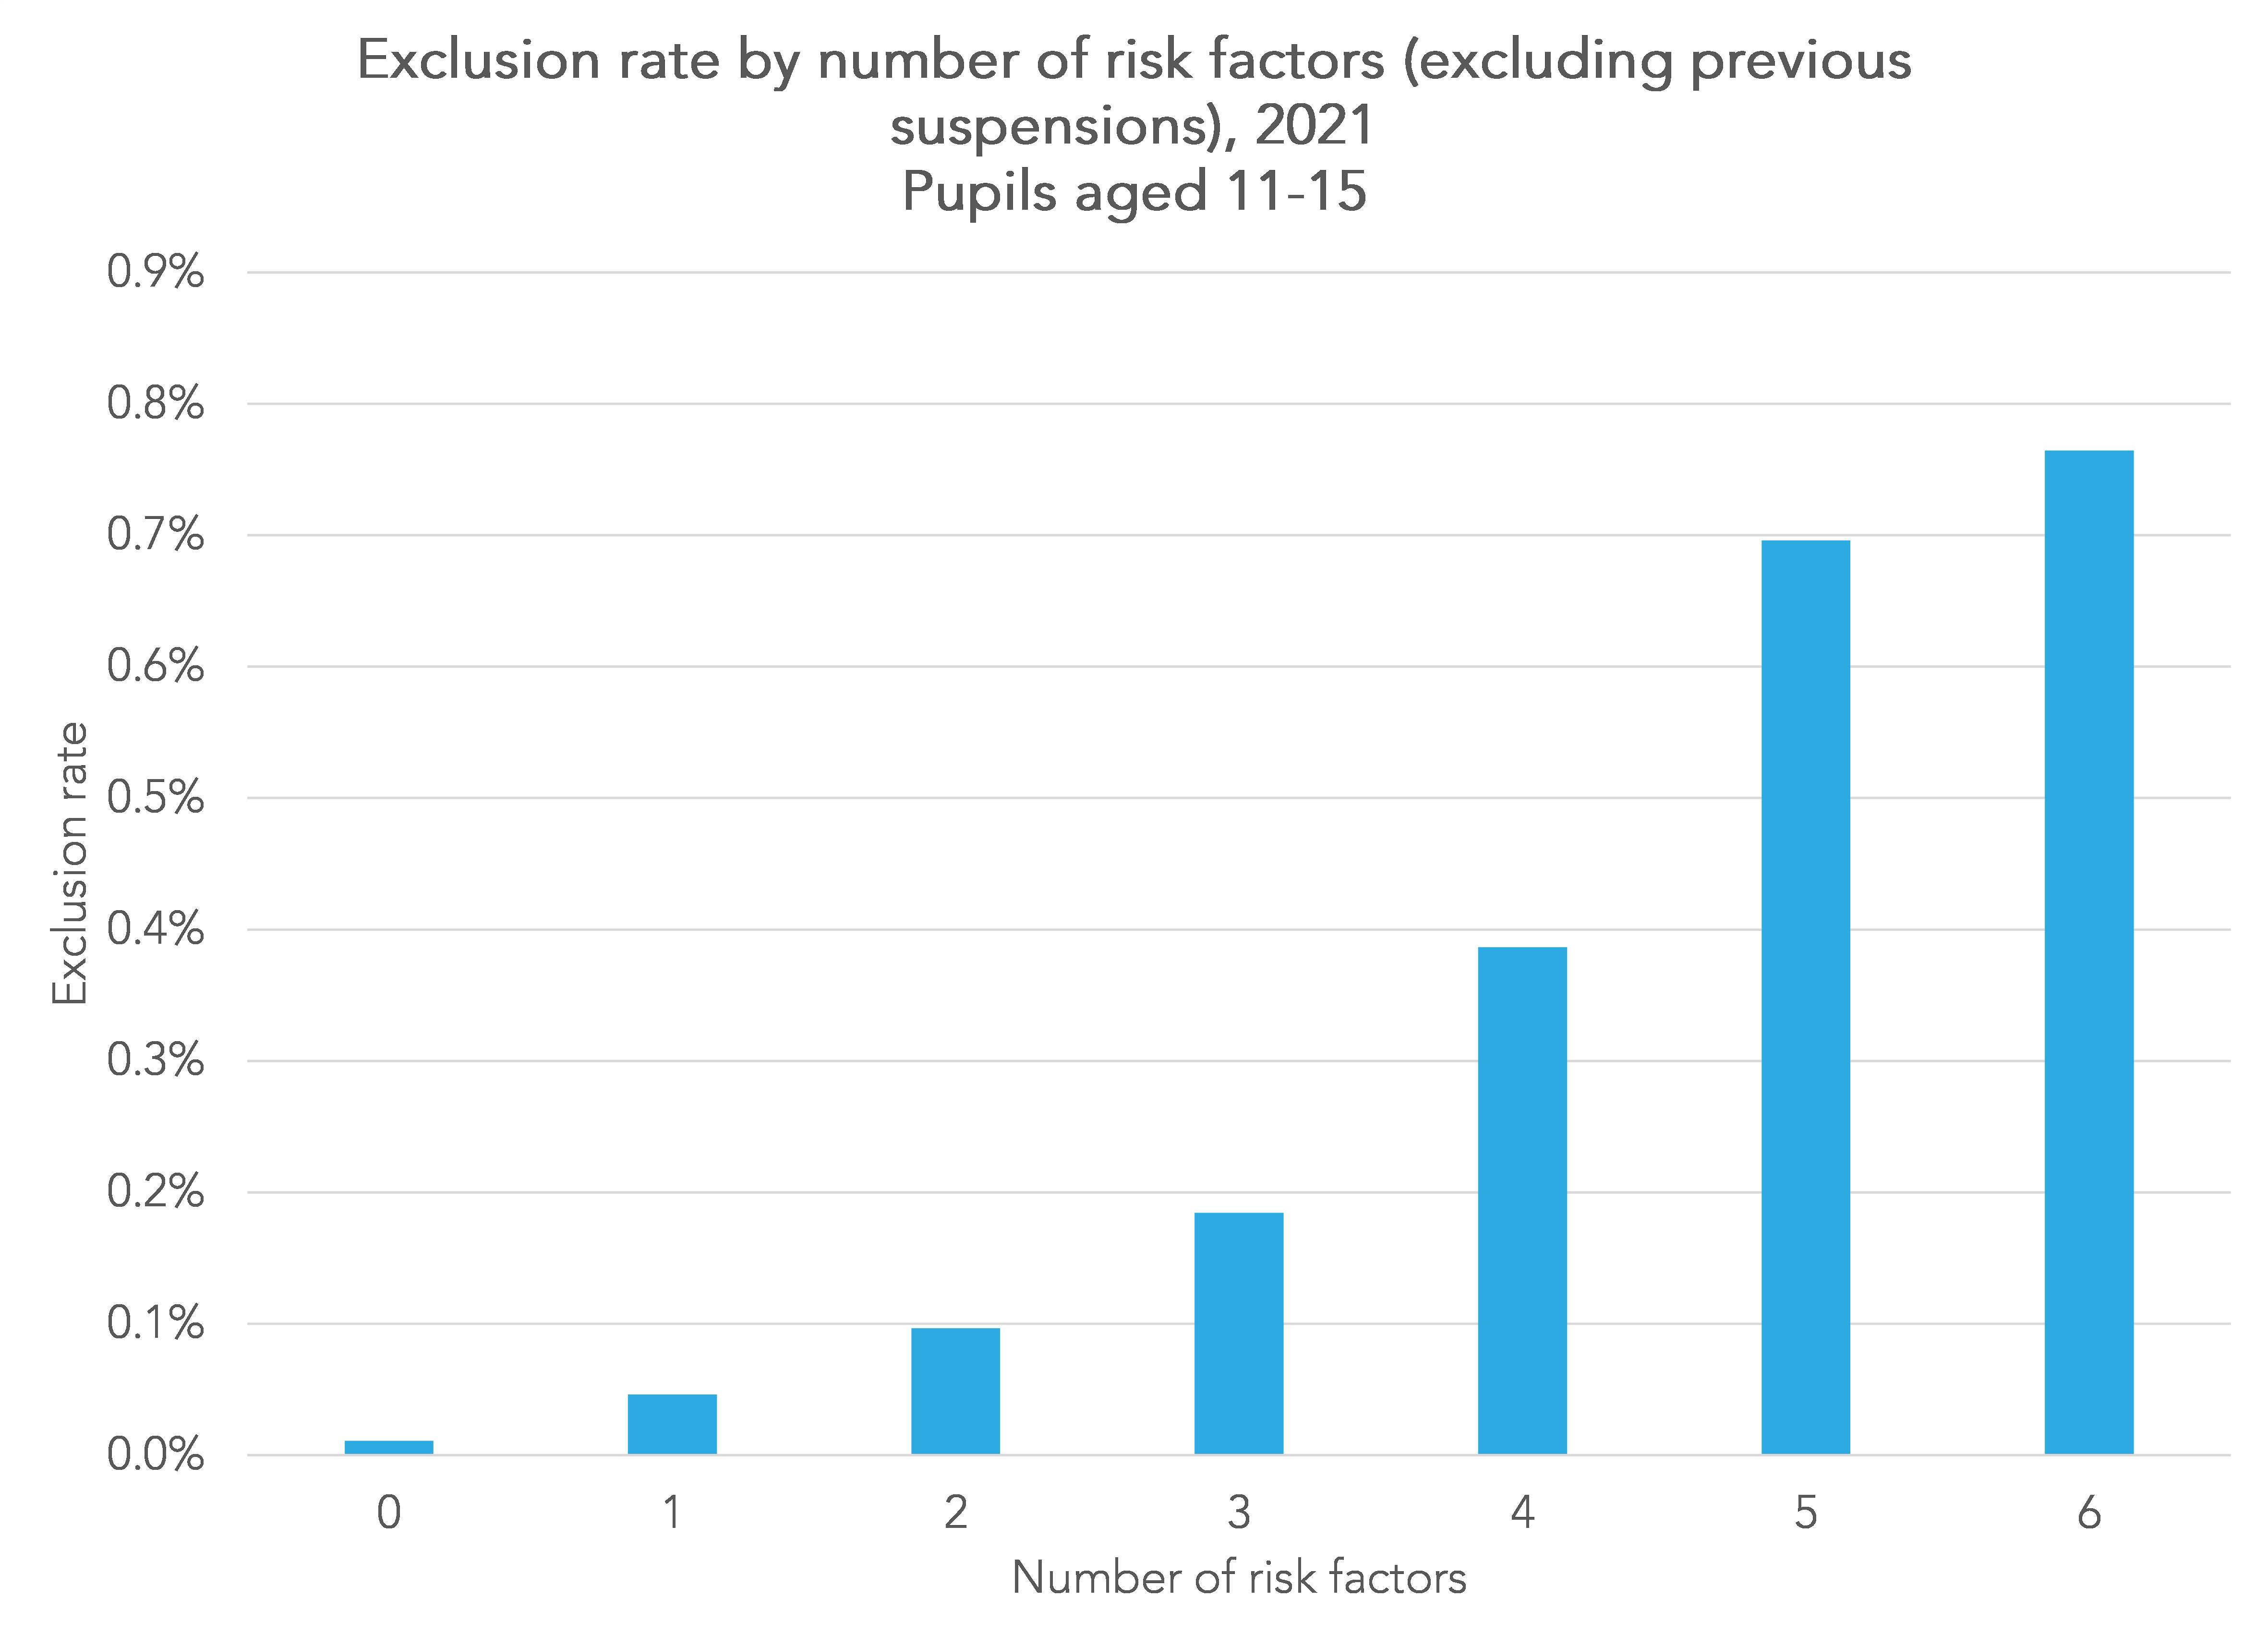
The exclusion rate for pupils with 3 risk factors was (almost) double that of those with 2 factors. Similarly, the rate for pupils with 4 risk factors was more than double that of those with 3 factors.
For the version including previous suspensions, we assign 2 points for each previous suspension up to a maximum of 10. However, we should recognise that previous suspensions are related to the other factors listed above.
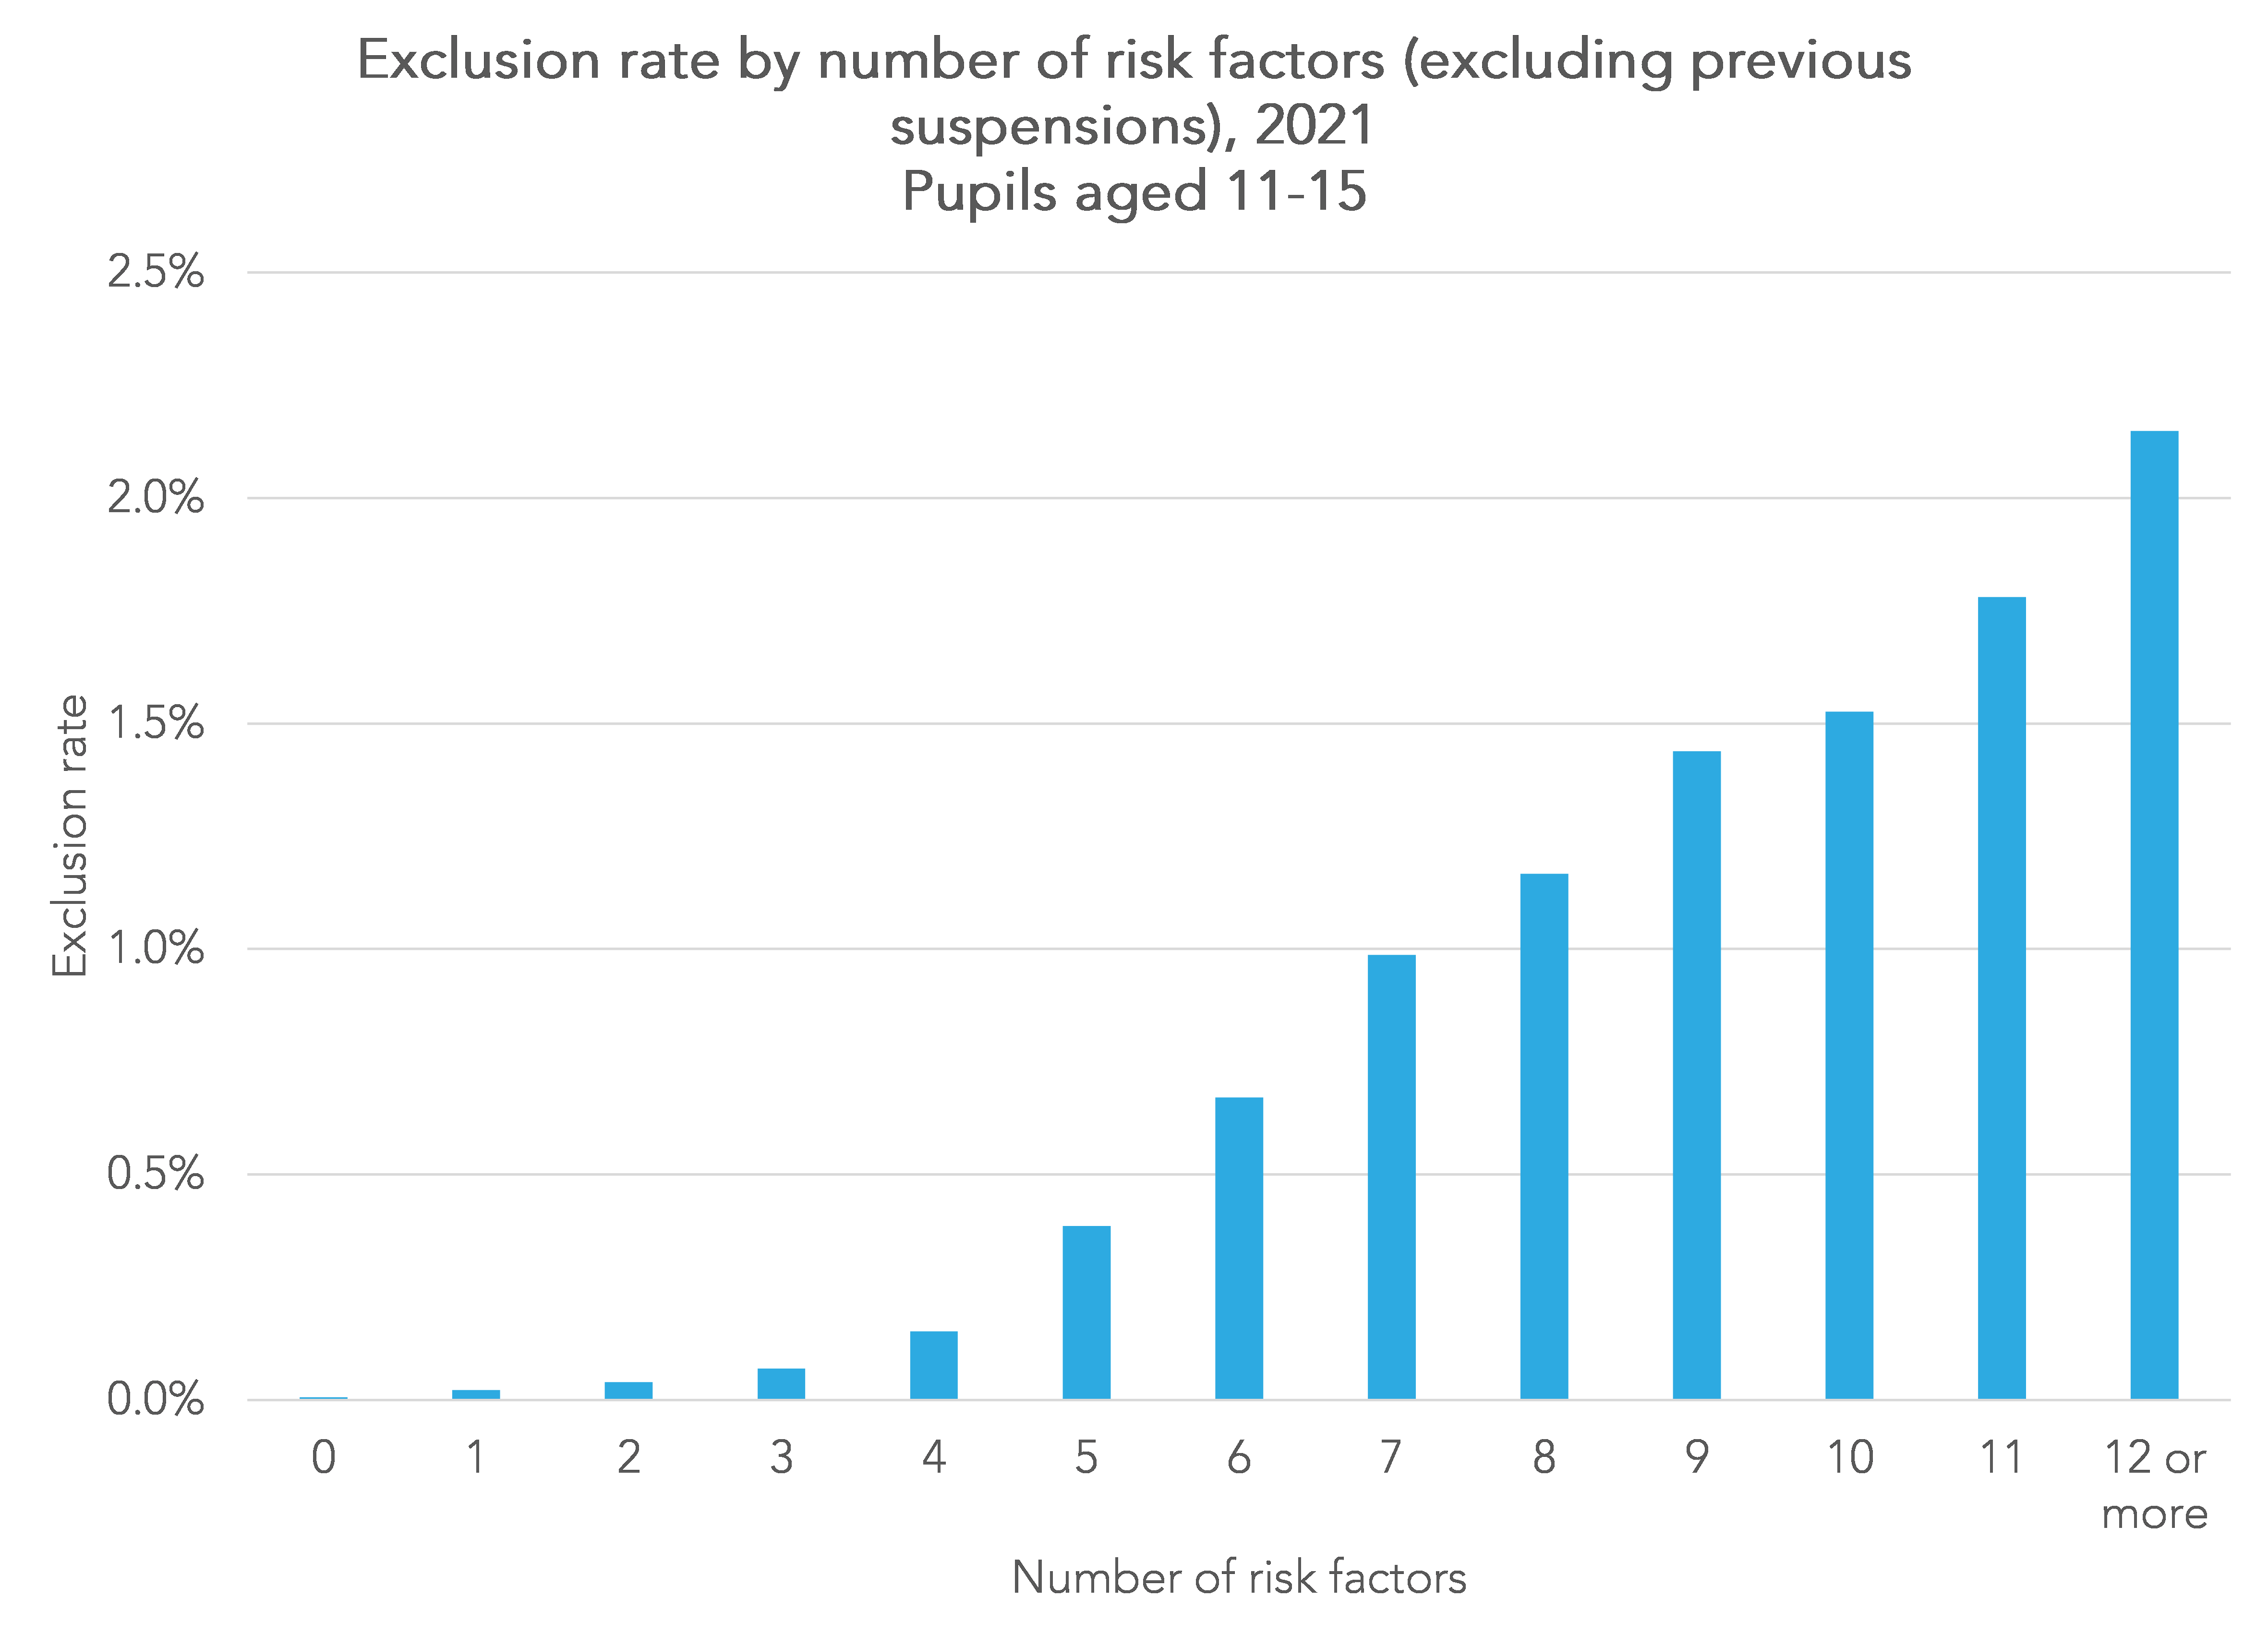
For girls without any risk factors (a score of 0) the risk of exclusion was 0.01%. In other words, 1 in every 10,000.
However, for pupils with a risk score of 12 or above, the risk of exclusion was 2.15%.
In fact, pupils with a risk score of 12 composed just 2% of the pupil population aged 11 to 15 but accounted for 33% of exclusions.
Summing Up
We can’t really claim to have done anything new here.
However, we have re-examined the risk factors of permanent exclusions included in the Timpson Review, in particular the interaction between some of them.
Some characteristics are associated with exclusion: gender, some types of SEN, persistence of disadvantage, low Key Stage 1 attainment and some ethnic groups.
Pupils with a history of previous suspensions are also at greater risk of exclusion.
Finally, we showed how some of these factors interact and that the more risk factors a pupil has, the greater their risk of exclusion.
That said, the risk of exclusion for those at greatest risk was still low in absolute terms. In addition, the year of data we’ve used was affected by a national lockdown in the Autumn. We’d expect to see a slightly higher risk when we update the work based on the 2022 data.
- This blog was written in June 2023
- Not SEN, SEN Support, Education, Health and Care (EHC) Plan. We also identify those previously identified as SEN but who were recorded as Not SEN in Autumn 2020/21
- This is only collected in the January School Census
- Figures denoted by a * indicate bars where we have supplied suppression as the number of girls excluded is below 10.
Want to stay up-to-date with the latest research from FFT Education Datalab? Sign up to Datalab’s mailing list to get notifications about new blogposts, or to receive the team’s half-termly newsletter.


Leave A Comment