Progress 8 was introduced as an accountability measure for all schools in England in 2016. It aimed to improve on the previous measure (the percentage of pupils achieving five GCSEs at A*-C including English and maths) by taking prior attainment into account. And incentivising schools to focus their efforts on all pupils, rather than those at the C/D borderline[1].
But what we’re interested in here is what’s happened since then. There are a number of ways schools might have acted to optimise their P8 scores, beyond simply improving the quality of teaching and education. Some, e.g. changing their curricula, perhaps more ethical than others, e.g. off-rolling.
There have also been a variety of external factors which may have affected some schools more than others: reforms to GCSEs, teacher recruitment issues, and, of course, the pandemic, to name a few.
With last week’s announcement that Progress 8 scores will not be calculated in 2025 and 2026, and Labour’s plans to reform Progress 8 should they win the next general election, it’s possible that 2024 will be the last time we see Progress 8 in its current form.
So in this post we’re going to look at how Progress 8 scores for individual schools have changed since the first full set of scores were released in 2016.
Data
We’ll use public data on schools’ Key Stage 4 results in 2016 (available here) and 2023 (available here). Unless otherwise stated, we’ll limit the analysis to state-funded mainstream schools[2]. And when we link scores in 2016 to scores in 2023, we link schools with new identifiers to their predecessors, where possible[3].
Distribution of schools by Progress 8 score
Let’s start by plotting the proportion of schools by Progress 8 score. The green bars show the distribution in 2016, and the pink bars the distribution in 2023.

Overall, the 2023 distribution is more spread out than 2016’s. In 2016, around 61% of schools had a Progress 8 score of between -0.3 and +0.3, compared with 46% of schools in 2023. Similarly, extreme scores were more common in 2023 than in 2016. In 2016, 3.5% of schools had a score of less than -0.8 or more than +0.8. In 2023, it was 12% of schools – over three times as many.
To some extent, this flattening of the distribution is to be expected. GCSEs in 2016 were graded on an eight-point scale (A*-G) while 2023’s were graded on a nine-point scale (9-1). This meant that pupil-level Progress 8 scores were more spread out in 2023 than 2016[4]. But without looking at pupil-level data, we can’t know how much of the change in distribution is due to this vs other factors.
We can look in a bit more depth at the 2023 distribution though by splitting schools into those which existed (and had a published Progress 8 score) in 2016 and those which didn’t. We reckon there are around 250 schools[5] in the latter group.
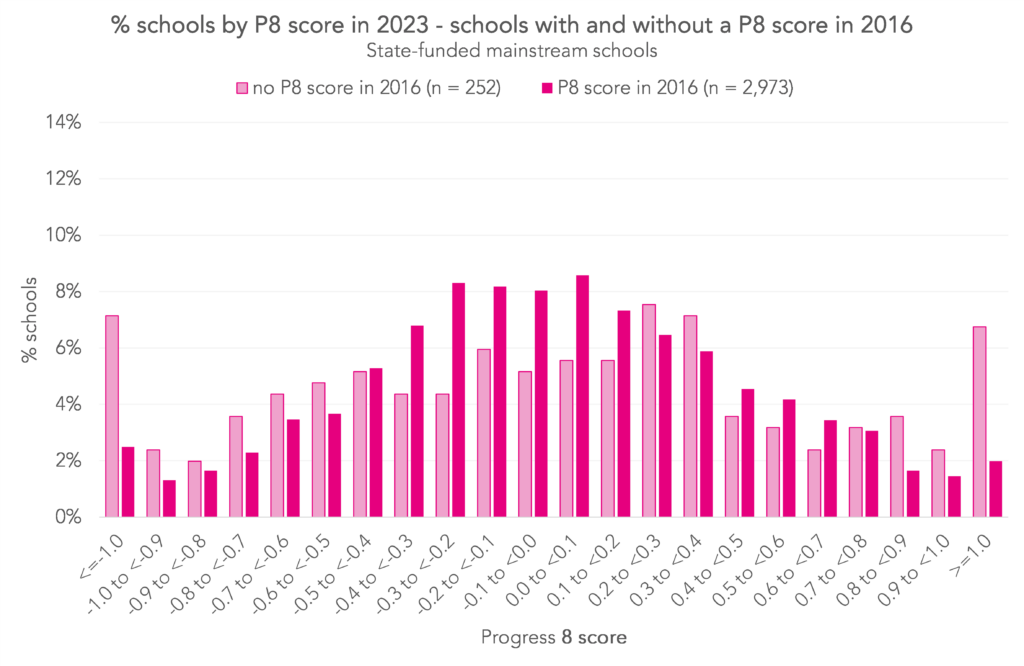
The distribution for “new” schools is a bit uneven, as we’d expect with a relatively small population size. But one thing is clear: schools which had their first Progress 8 score published after 2016 were more likely to record extreme scores than those with a score published in 2016 or earlier. Around 14% of “new” schools had a Progress 8 score in 2023 of -1.0 or less, or +1.0 or more, compared with 4.5% of “old” schools.
That aside, both groups of schools performed similarly overall. 49% of “old” schools had a 2023 P8 score of 0.0 or better, as did 51% of “new” schools.
Distribution of schools by change in Progress 8 score
Now that we’ve seen what Progress 8 scores looked like in 2016 and 2023 separately, let’s bring the two together. Below we plot the distribution of schools by the difference between their Progress 8 score in 2016 and 2023. By definition, we’ll be limiting the population to schools with a published score in both years.
Schools to the left of the dotted line saw their scores fall, and those to the right saw them stay the same or increase.
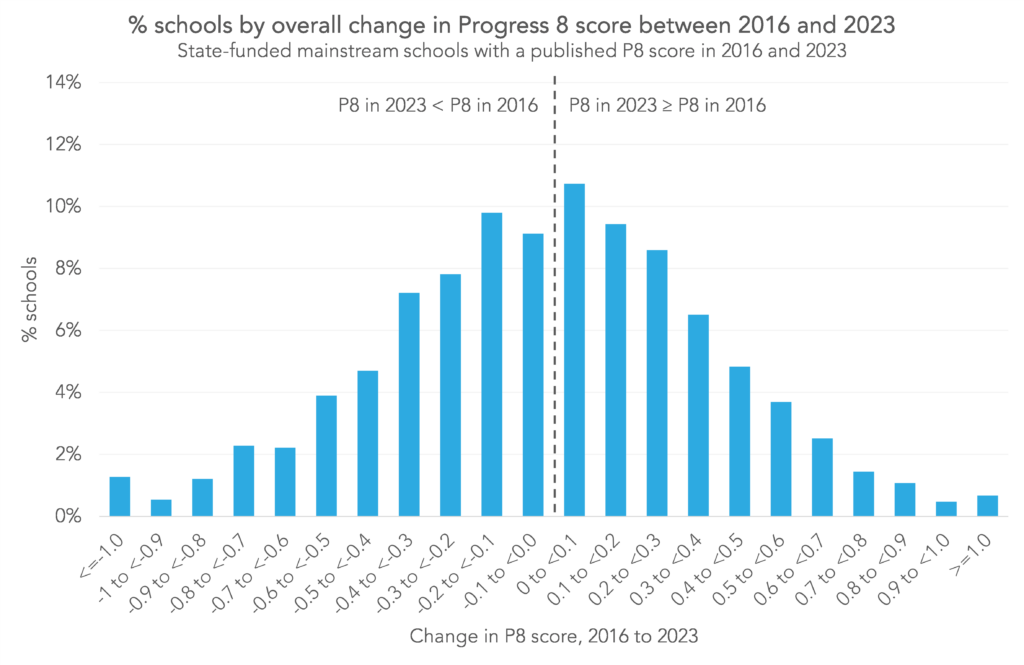
As you’d expect in a scoring system devised around a mean of zero, half of schools saw their scores drop, and half saw them rise or stay the same.
Big swings were uncommon, but not negligible. Around 5% of schools saw their scores change by at least 0.8 in either direction. And 21% saw changes of at least 0.5 – 11% fell by more than 0.5, and 10% rose by 0.5 or more.
Overall, around 40% of schools had a 2023 Progress 8 score which was within 0.2 points of their 2016 score.
Changes by region
Let’s turn now to how Progress 8 scores have changed by school characteristics. We’ll start with region. Below, we plot schools’ average Progress 8 score in 2016 on the horizontal axis, and their average 2023 score on the vertical axis. Regions above the dotted diagonal line saw higher average scores in 2023 than 2016, and vice versa.

Most regions’ scores were similar in 2016 and 2023 – the South West, West Midlands, Yorkshire and the Humber, East, and South East had scores between -0.1 and +0.1 in 2016 and again in 2023. The biggest average fall was among schools in the North East (from -0.09 in 2016 to -0.20 in 2023), and the biggest rises were in the East Midlands (-0.10 to -0.01) and London (+0.21 to +0.31).
Changes by school type
Now, let’s look at school type. Because lots of schools changed type over this period, we’ll break the data down by the combination of school type in 2016 and 2023. We’re only including school type combinations which apply to at least ten schools.
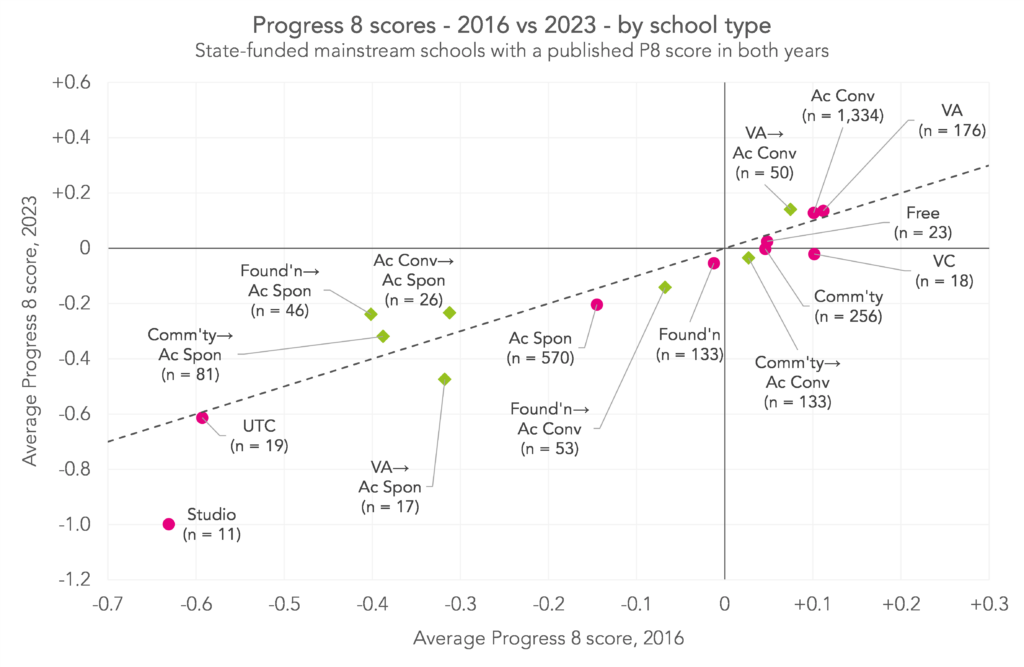
Studio schools and UTCs are negative outliers. The 11 studio schools with Progress 8 scores in both 2016 and 2023 saw their average scores fall from -0.63 to -1.00, and the 19 UTCs saw scores close to -0.60 in both years. This isn’t too surprising, as these schools tend to have curricula which are poorly aligned with the “buckets” of Progress 8. (In 2023, 14% of pupils in studio schools and 5% in UTCs entered an EBacc language subject, compared with 46% of all pupils. 43% of pupils in studio schools and 22% in UTCs entered an EBacc humanities subject, compared with 84% of all pupils.)
Schools that changed to sponsored academies tended to improve their scores a little, albeit from a relatively low base (and with the exception of the 17 voluntary aided schools which changed to sponsored academies – their average score changed from -0.31 to -0.47). Schools which were sponsored academies in both years saw a small negative change, from -0.14 to -0.20.
Schools that changed to converter academies tended to see their scores drop a little, apart from those which changed from voluntary aided, which saw a small rise from +0.07 to +0.14. Schools which were converter academies in both years saw little change.
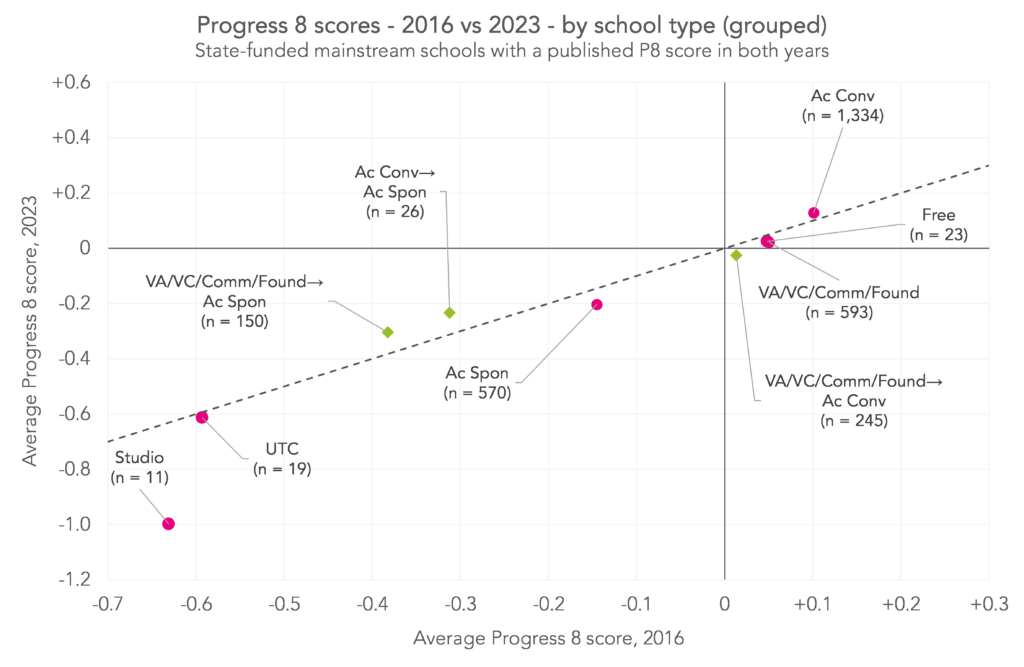
We can see this pattern a little more clearly by grouping voluntary aided, voluntary controlled, foundation, and community schools together.
Changes by disadvantage
To finish, we’ll divide schools into five groups of equal size, or quintiles, according to the proportion of their Year 11 cohorts eligible for free school meals in the preceding six years (FSM6). Quintile 1 contains the least disadvantaged schools, and quintile 5 the most disadvantaged. As cohort composition changes over time, we calculate a school’s quintile in 2016 and 2023 separately, and show the results for both
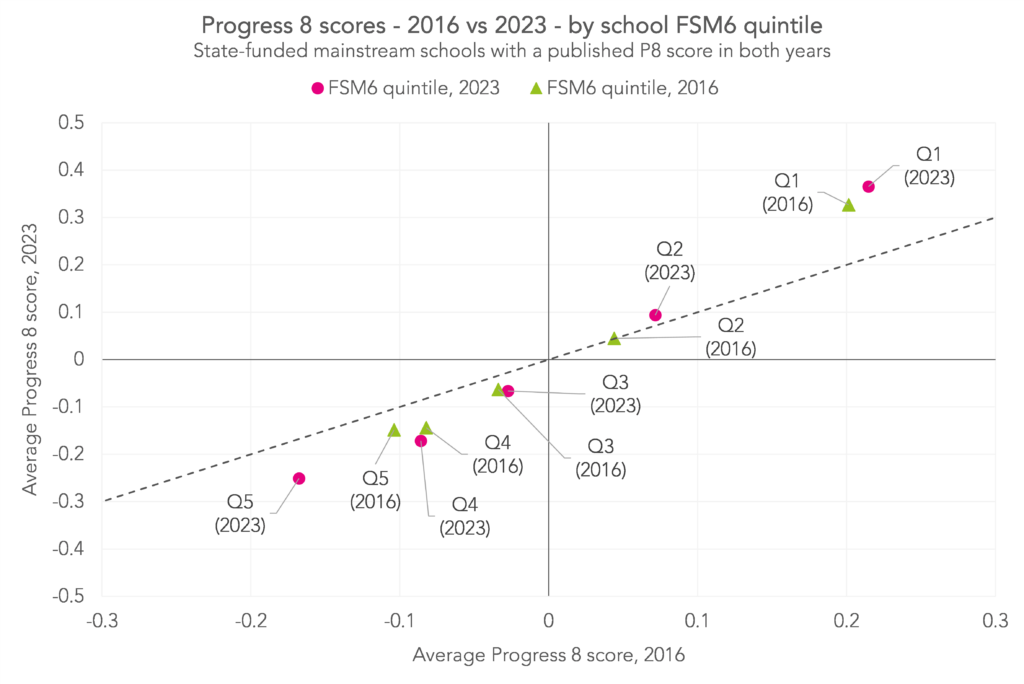
Broadly, schools with the least disadvantaged cohorts saw the biggest increases in Progress 8 scores, while those with the most disadvantaged cohorts saw the biggest falls. Schools in the highest quintile in 2023 saw an average increase of around 0.15, from +0.21 to +0.37. Schools in the lowest quintile in 2023 saw an average fall of 0.08, from -0.17 to -0.25.
Interestingly, schools in the fourth and fifth quintiles in 2016 had similar average scores, while those in the fourth and fifth quintiles in 2023 had quite different scores. We think this is the impact of schools in London becoming less disadvantaged over time. A greater proportion of “Q5” schools in 2016 were in London than “Q5” schools in 2023. And London schools tend to do better on Progress 8 than schools elsewhere (largely due to other demographic factors, like having a larger proportion of pupils with English as an additional language).
Summing up
Some schools have seen big changes in their Progress 8 scores between the first and most recent sets, with around one in five seeing swings of at least 0.5 in either direction.
This seems, in part, to be related to school disadvantage – the most disadvantaged schools tended to see their scores fall, and the least disadvantaged tended to see them rise. Of course, there will be many other factors at play for these schools too.
However, a large proportion of schools – around 40% – achieved similar scores in both years. The (admittedly unanswerable) question is: would this number would have been higher or lower without the turbulence schools experienced in the intervening time?
Want to stay up-to-date with the latest research from FFT Education Datalab? Sign up to Datalab’s mailing list to get notifications about new blogposts, or to receive the team’s half-termly newsletter.
[1] You can read more about the extent to which this has been achieved here
[2] Also excluding any further education institutions
[3] We see a lot of these in the data over this period because one of the most common reason for a school to change its identifier (URN and/or LAESTAB) is when it becomes an academy.
[4] The pupil-level standard deviation in Progress 8 scores in 2016 was 1.07 vs 1.41 in 2023.
[5] Around 70% of them were listed as free schools, studio schools, or UTCs in 2023.
[6] Of the 2,970 schools in our sample, around 1,200 were in a different FSM6 quintile in 2023 than 2016. Of those, around 140 moved more than one quintile (e.g. from 3 to 5).


Leave A Comment