In this post I’ll be returning to a favourite topic: the choices that students make at Key Stage 5. I’ve looked at how these vary by gender, ethnicity, disadvantage (and so on) in previous posts, but one area I’ve neglected is how these interact with one another. If we were just to look at gender, for example, we might conclude that female students are far less likely to choose to certain subjects at A-Level than their male peers, but is that still true of disadvantaged girls from, say, an Indian background?
I’m planning a series of posts that will try to answer these sorts of questions, looking at the type of qualifications students choose to pursue and the subjects they choose to study. In this first post, I’m going to focus in on whether students go on to study A-Levels or not.
Data
I’ll be using data from the KS5 exam, KS4 pupil and census tables of the National Pupil Database. We include those who completed KS4 in 2021 at a mainstream, state-funded school in England and who went on to complete KS5 exams in 2023.
We should note that pupils who took GCSEs in 2021 will have been awarded their grades via TAGs rather than exams. This could well have affected how likely pupils were to go on to take A-Levels, and some groups of pupils may have been more likely to get achieve higher grades via TAGs than they might have achieved via exams.
So it’s possible that progression to A-Levels for this cohort of pupils doesn’t reflect what might have happened in a more typical year. In future posts in this series, assuming it’s available by then, we’ll use data for the cohort that took GCSEs in 2022 to avoid this issue. We also plan to take a look at how prior attainment feeds in to the differences we observe between groups.
Gender vs ethnicity
Overall, just over a third (36%) of pupils who completed Key Stage 4 in a state-funded mainstream school in 2021 went on to take at least one A-Level in 2023. But girls were more likely to do so than boys, as were pupils from some ethnic backgrounds, particularly Chinese and Indian.
Let’s look at how the gender gap in A-Level entry compared across students from different ethnic backgrounds.
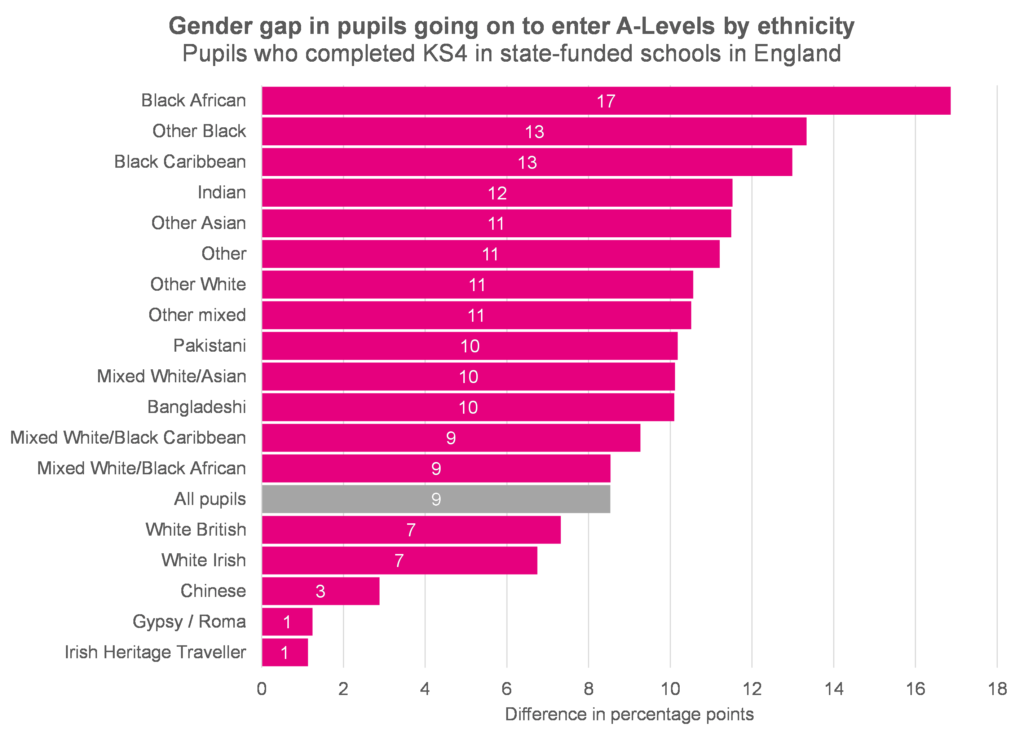
Across all ethnic groups, there was a difference of 9 percentage points in the proportion of female and male pupils going on to enter A-Levels. But among students from a Chinese, Gypsy/Roma and Irish Traveller background that gender gap was far lower, and among Black students it was far higher.
We can dig into where those differences are coming from by looking at the proportion of male and female pupils who went on to take A-Levels.
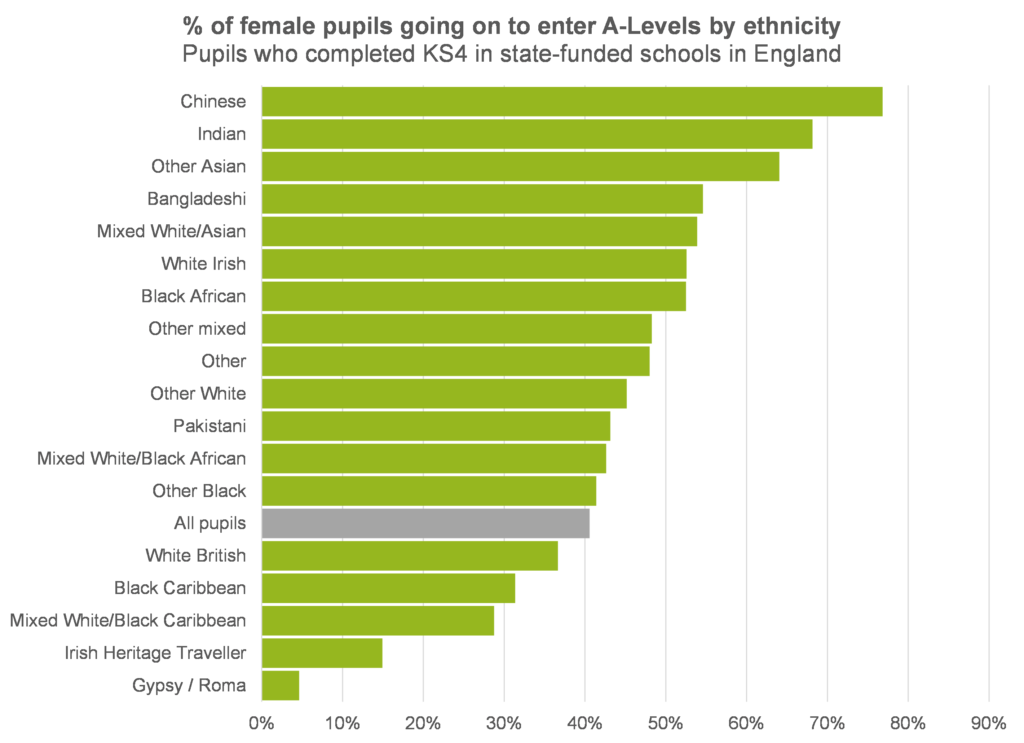
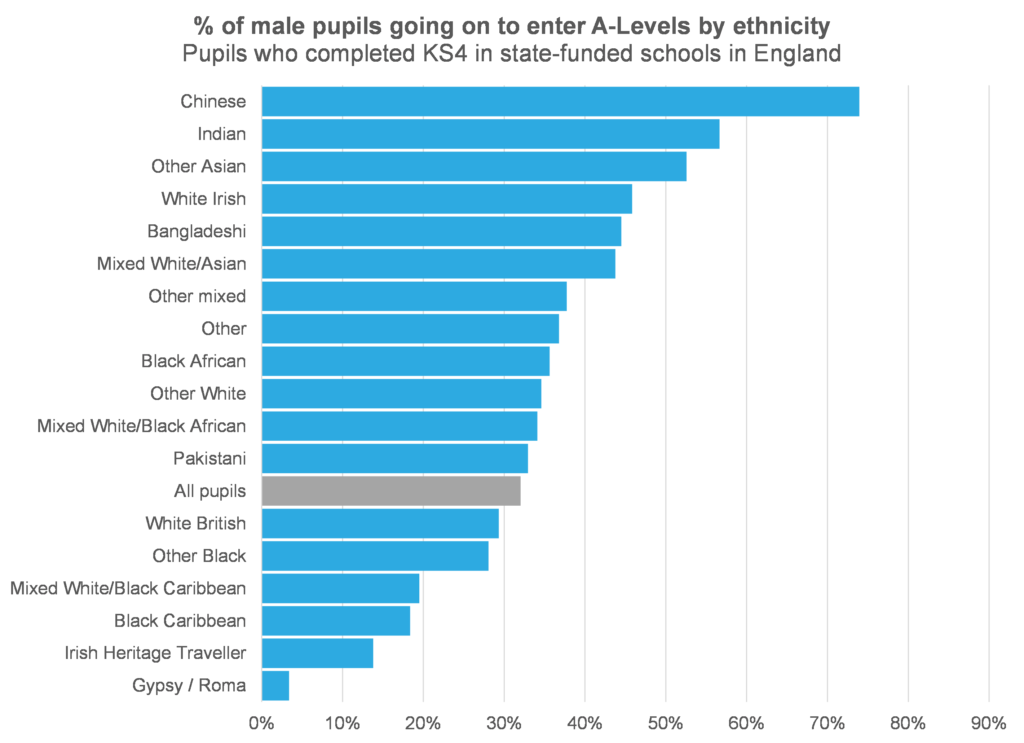
We can see that the gender gap for Chinese pupils was low because very high proportions of both male and female pupils went on to take A-Levels, while the opposite was true of Gypsy/Roma and Irish Heritage Traveller pupils. The situation for Black pupils is more complex.
Among Black African pupils, while both male and female pupils were more likely to progress to A-Levels than the average for their gender, the difference was particularly large for female pupils. Among Black Caribbean pupils, essentially the opposite is true: both male and female pupils were less likely to progress than their peers, but the difference is particularly marked for male pupils.
Finally, among Black pupils from other backgrounds, the larger gender gap was driven by female pupils being slightly more likely to progress to A-Level than their peers, while male pupils were slightly less likely.
FSM6 vs ethnicity
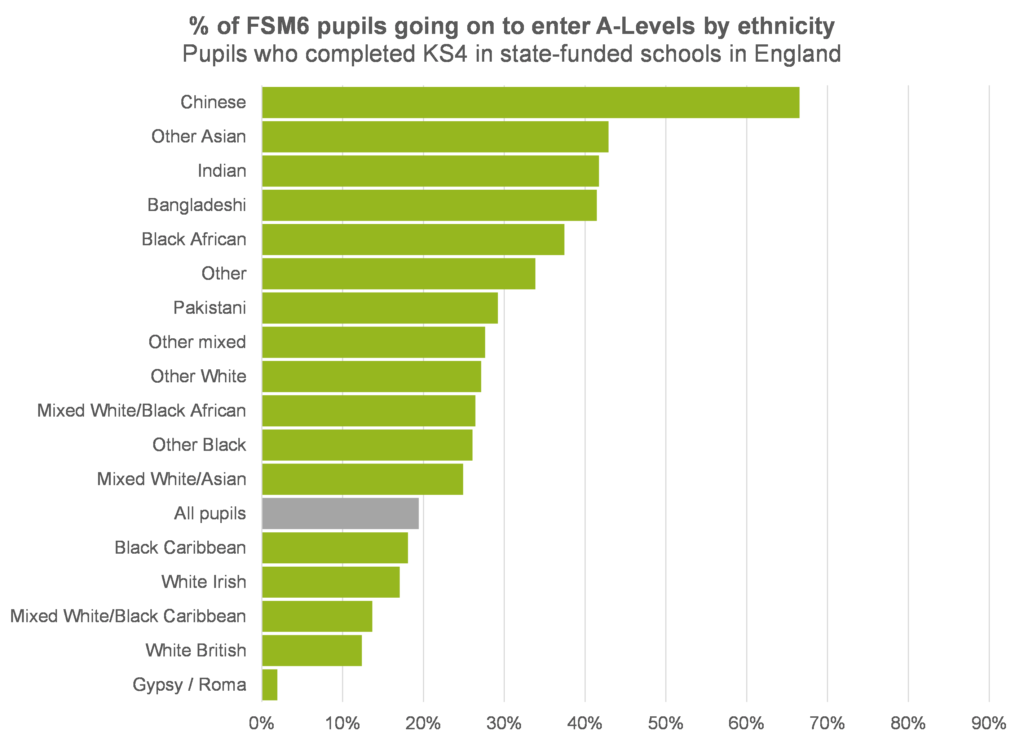
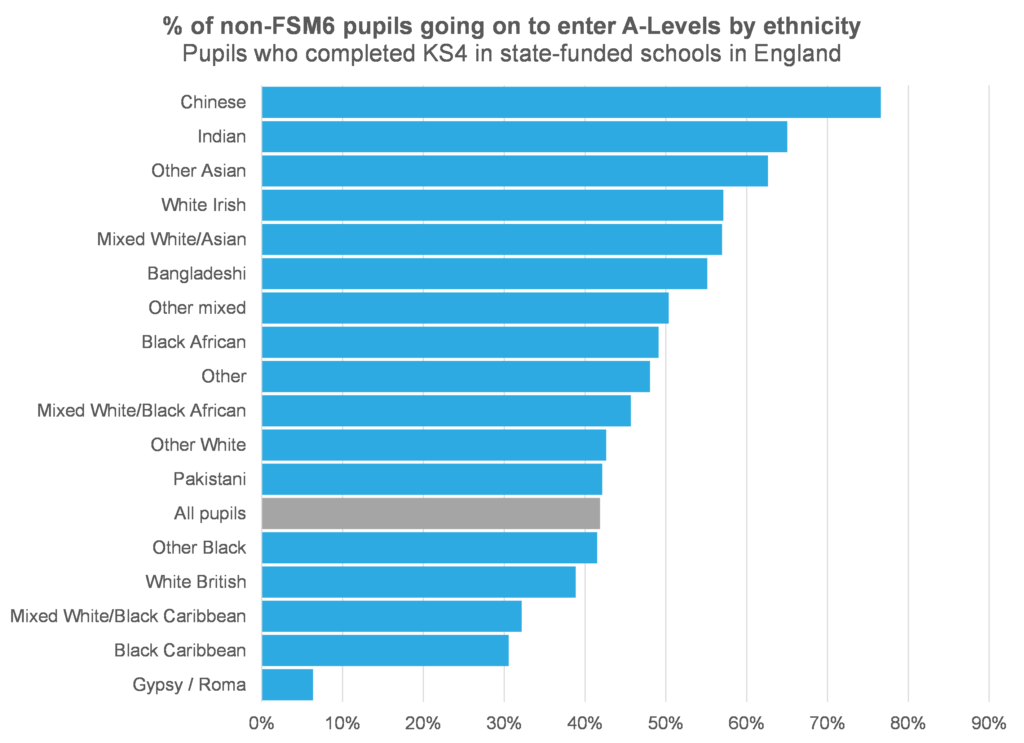
Pupils from disadvantaged backgrounds were less likely than their peers to go on to study A-Levels. Just a fifth of those who completed KS4 in 2021 went on to do so, compared to 42% of pupils not known to be disadvantaged.
Let’s look at how that disadvantage gap in progression breaks down by ethnic background.
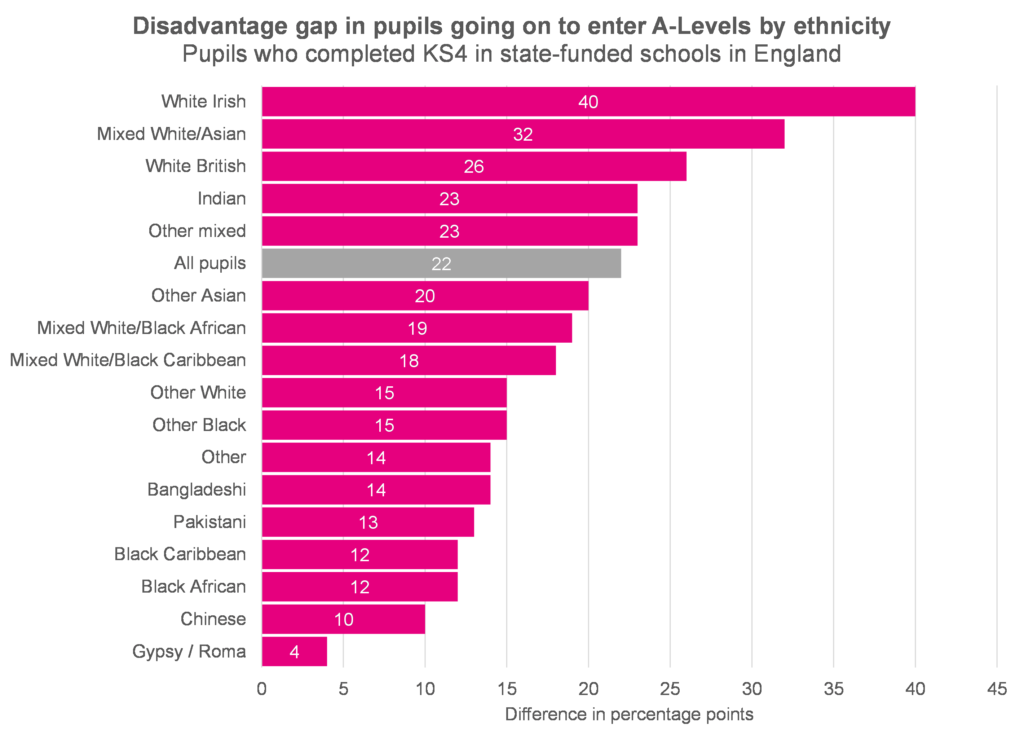
The gap was smaller than the national average for quite a number of groups, particularly Black Caribbean, Black African, Chinese and Gypsy/Roma, and larger than average for White Irish, mixed White/Asian, and White British pupils.
Again, we can try to understand where the differences are coming from by looking at the proportion of disadvantaged and non-disadvantaged pupils who went on to take A-Levels.
Let’s look first at some of the groups with relatively small disadvantage gaps: Black Caribbean, Black African, Chinese and Gypsy/Roma pupils.
Disadvantaged Black Caribbean pupils were only very slightly less likely to go on to take A-Levels than the average for all disadvantaged pupils. Their peers who are not known to be disadvantaged, on the other hand, wee quite a lot less likely to progress to A-Level than the average for all non-disadvantaged pupils – the difference is 11 percentage points, compared to just 1 percentage point for disadvantaged pupils.
The situation for Gypsy/Roma pupils is somewhat similar. The difference in progression between disadvantaged Gypsy/Roma pupils and the average for all disadvantaged pupils was 11 percentage points, while the difference for non-disadvantaged Gypsy/Roma pupils was 36 percentage points – although the small numbers of pupils in this group, and particularly the small numbers progressing to A-Level, mean that we should perhaps take these figures with a pinch of salt.
Both disadvantaged and non-disadvantaged Black African pupils were more likely to progress onto A-Level than average.
Among both disadvantaged pupils and their peers, Chinese pupils were more likely to progress onto A-Level than pupils from any other background. But this effect was particularly marked for disadvantaged pupils, meaning that the disadvantage gap was fairly small.
Now we’ll consider groups with relatively large disadvantage gaps: White Irish, mixed White/Asian, and White British pupils.
Among both White Irish and mixed White / Asian pupils, the progression rates for disadvantaged pupils were not very far from the average for all disadvantaged pupils, but rates for non-disadvantaged pupils were far higher than the average.
For White British pupils, progression rates for pupils not known to be disadvantaged were similar to the overall rate. This is to be expected, as this group of pupils make up the majority of KS4 pupils in our dataset (53%). Disadvantaged White British pupils, on the other hand, had progression rates well below the average for disadvantaged pupils.
Gender vs FSM
Next let’s look at the intersection of gender and disadvantage.
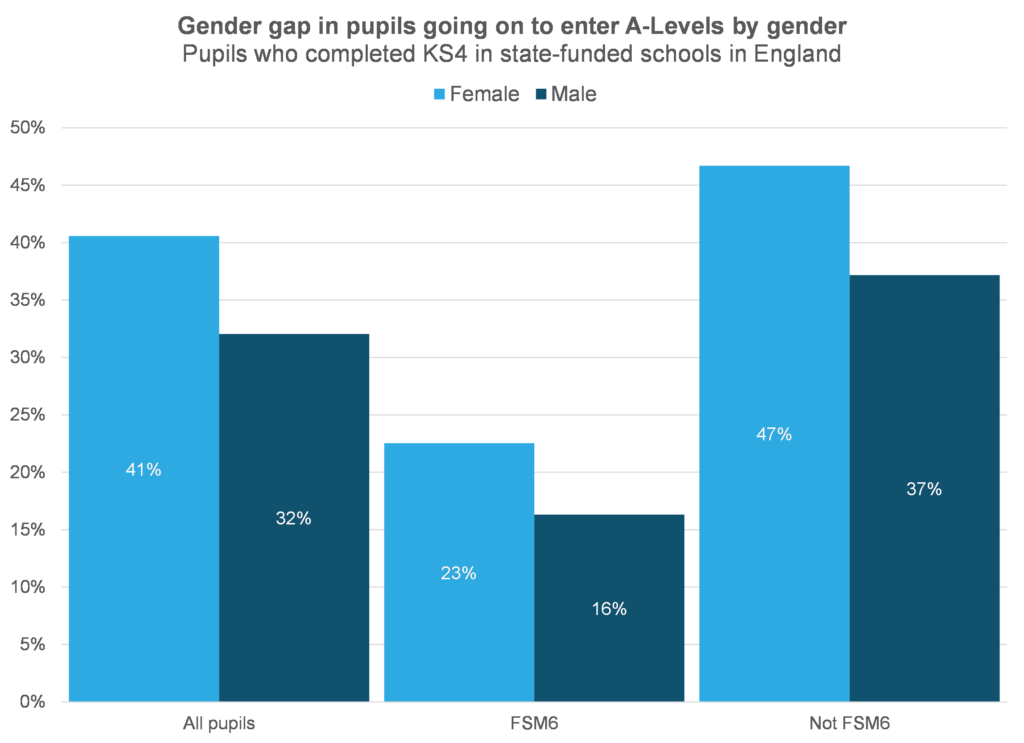
Among all pupils, the gender gap in progression was 9 percentage points. This was slightly lower among disadvantaged pupils than their peers.
If we instead look at the disadvantage gap by gender, we can get another angle.
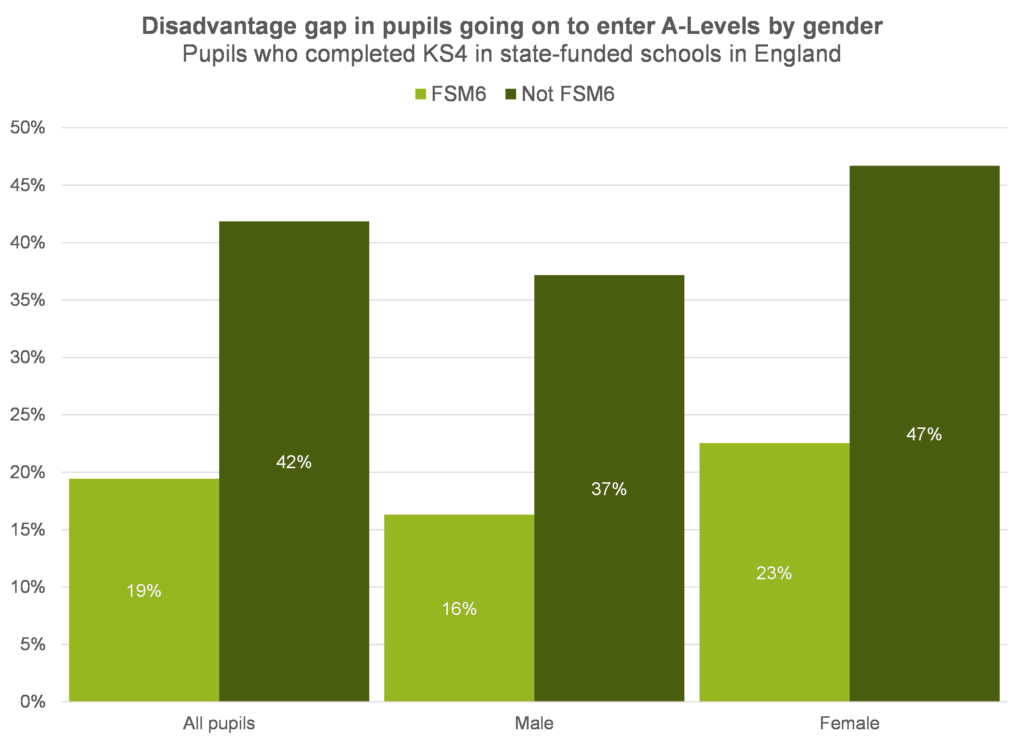
The overall disadvantage gap in progression was 22 percentage points, but it’s slightly higher for female students.
Three-way interactions
Finally, we’ll see what happens when we include all three characteristics: gender, ethnicity and disadvantage. The entire list is available here as an appendix. We should note that some of the resulting groups are quite small, so bear this in mind when interpreting the data.
The groups most likely to progress to study A-Level(s) were:
- female, non-disadvantaged pupils from Chinese backgrounds (78%)
- male, non-disadvantaged pupils from Chinese backgrounds (75%)
- female, non-disadvantaged pupils from Indian backgrounds (71%)
- female, non-disadvantaged pupils from other Asian backgrounds (68%)
- male, disadvantaged pupils from Chinese backgrounds (67%)
The groups least likely to progress to study A-Level(s) were:
- male, disadvantaged pupils from White Irish backgrounds (13%)
- male, disadvantaged pupils from White British backgrounds (11%)
- male, disadvantaged pupils from mixed White / Black Caribbean backgrounds (10%)
- female, non-disadvantaged female pupils from Gypsy/Roma backgrounds (8%)
- male, non-disadvantaged male pupils from Gypsy/Roma backgrounds (5%)
We should note that we have suppressed data on disadvantaged Gypsy/Roma and Irish Heritage Traveller pupils due to small numbers; these groups would otherwise have appeared low on the list.
Summing up
Gender gaps, ethnicity gaps and disadvantage gaps in rates of progression to A-Level do seem to exist across most groups of pupils. But they are more extreme for some groups than others.
The gender gap is particularly high among Black pupils, while the disadvantage gap is higher than average for White British, White Irish and mixed White / Asian pupils. While for some other groups, the gaps are lower.
All of this feeds into some huge differences in progression rates when we look at pupils broken down by all three characteristics.
Want to stay up-to-date with the latest research from FFT Education Datalab? Sign up to Datalab’s mailing list to get notifications about new blogposts, or to receive the team’s half-termly newsletter.


Hi, Natasha. I’d be very interested to understand how these differences play out across different subject areas as well as different regions.
Hi Alison. Me too! I will try to get on to this over the next few months – ideally I’ll hang on until the data for students taking A-Levels in 2024 is available for analysis.
Delving even deeper into the rabbit hole, subject analysis would be amazing. As an English tutor, mostly dealing with A Level English Literature at the moment, it would be fascinating to scrutinise this with a subject which seems to be struggling.
Thanks for your work so far. This was an interesting read.
Thanks Abel. Glad to hear that people are interested in subject analysis. Watch this space!