In this article I’m going to examine the extent to which national attainment gaps between disadvantaged pupils and their peers varies within and between schools.
In part two I will examine how these vary by region.
The “within school” part of the gap refers to the fact that even in the same school disadvantaged pupils tend to achieve lower outcomes than their peers.
By contrast, the “between school” part of the gap refers to the way disadvantaged (and non-disadvantaged) pupils are shared out between schools, for example if disadvantaged pupils being more likely to attend lower achieving schools.
It is the between school part that could be influenced by the way that disadvantaged pupils are allocated to (or sorted into) schools. For example, if schools’ admissions criteria changed over time to favour disadvantaged pupils, we would expect the between school part to reduce over time.
Some caveats
The analysis I present here, like a lot of analysis of education data, splits pupils into two groups: those who are disadvantaged[1] and those who aren’t. In layman’s terms “poor” and “non-poor”.
Obviously these two groups cover a wide range of individual circumstances. The “non-poor” group, for example, will include pupils from very affluent backgrounds as well as those who are in poverty but who have either not claimed free school meals or not been eligible for some reason.
This is a limitation of the data that we have to work with. Or put another way, the reality will be more complicated than what is presented here.
The gap in 2024
National Key Stage 4 data for 2024 was published just before the Christmas break.
The Department for Education produces a “gap index”. However, this isn’t an easily interpretable measure so I’m going to work with two of the headline performance tables measures: Attainment 8 and Progress 8 (although arguably these aren’t particularly easy to interpret either).
In state-funded mainstream schools[2] the overall gaps (consisting of both within-school and between-school parts) between disadvantaged pupils and their peers on both measures were as follows:
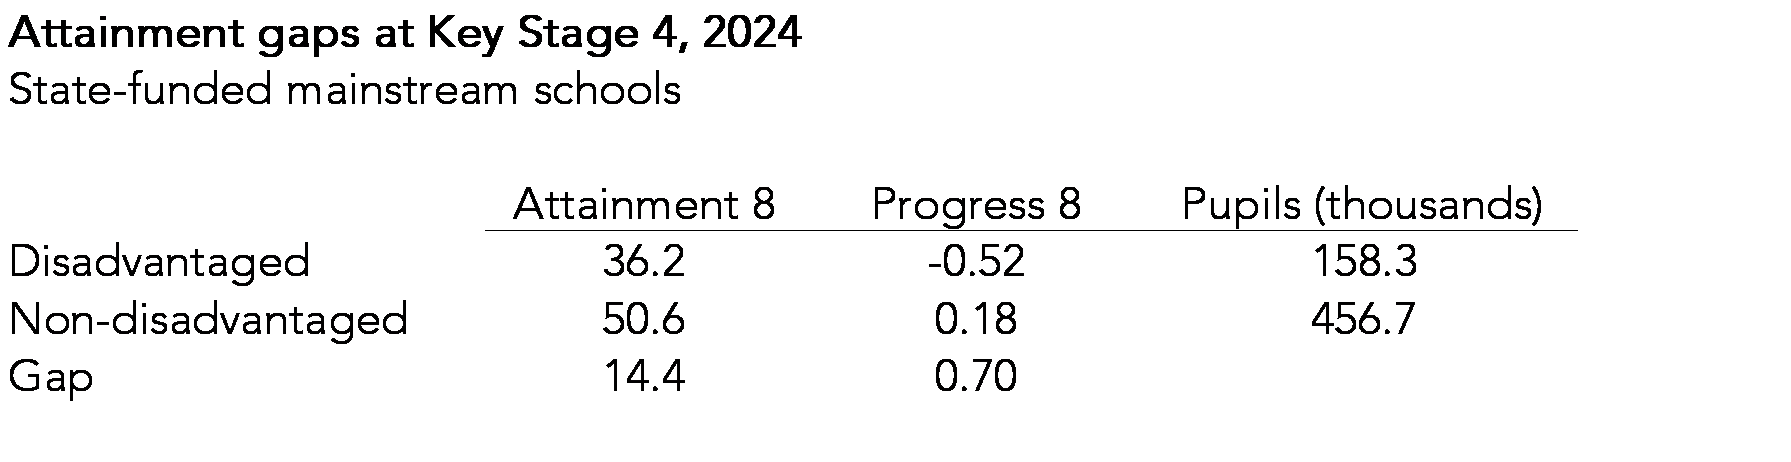 Attainment 8 is composed of grades achieved in “eight”[3] subjects at Key Stage 4. Non-disadvantaged pupils achieve a total of 14.4 points more on average than disadvantaged pupils on this measure, almost a grade and a half per subject.
The Progress 8 gap was 0.7 points. This is a per subject measure so to put it back onto the same scale as Attainment 8 we multiply by 10[4] to arrive at 7.0 points.
Progress 8 is a value-added measure based on Attainment 8. The gap of 7 points means that when we adjust for differences in prior attainment between disadvantaged pupils and their peers, just over half of the Attainment 8 gap remains. Or put another way, differences in prior attainment “explain” roughly half of the attainment gap.
Sticking with Progress 8, we can examine differences between the two groups of pupils in state-funded schools on the following scatterplot.
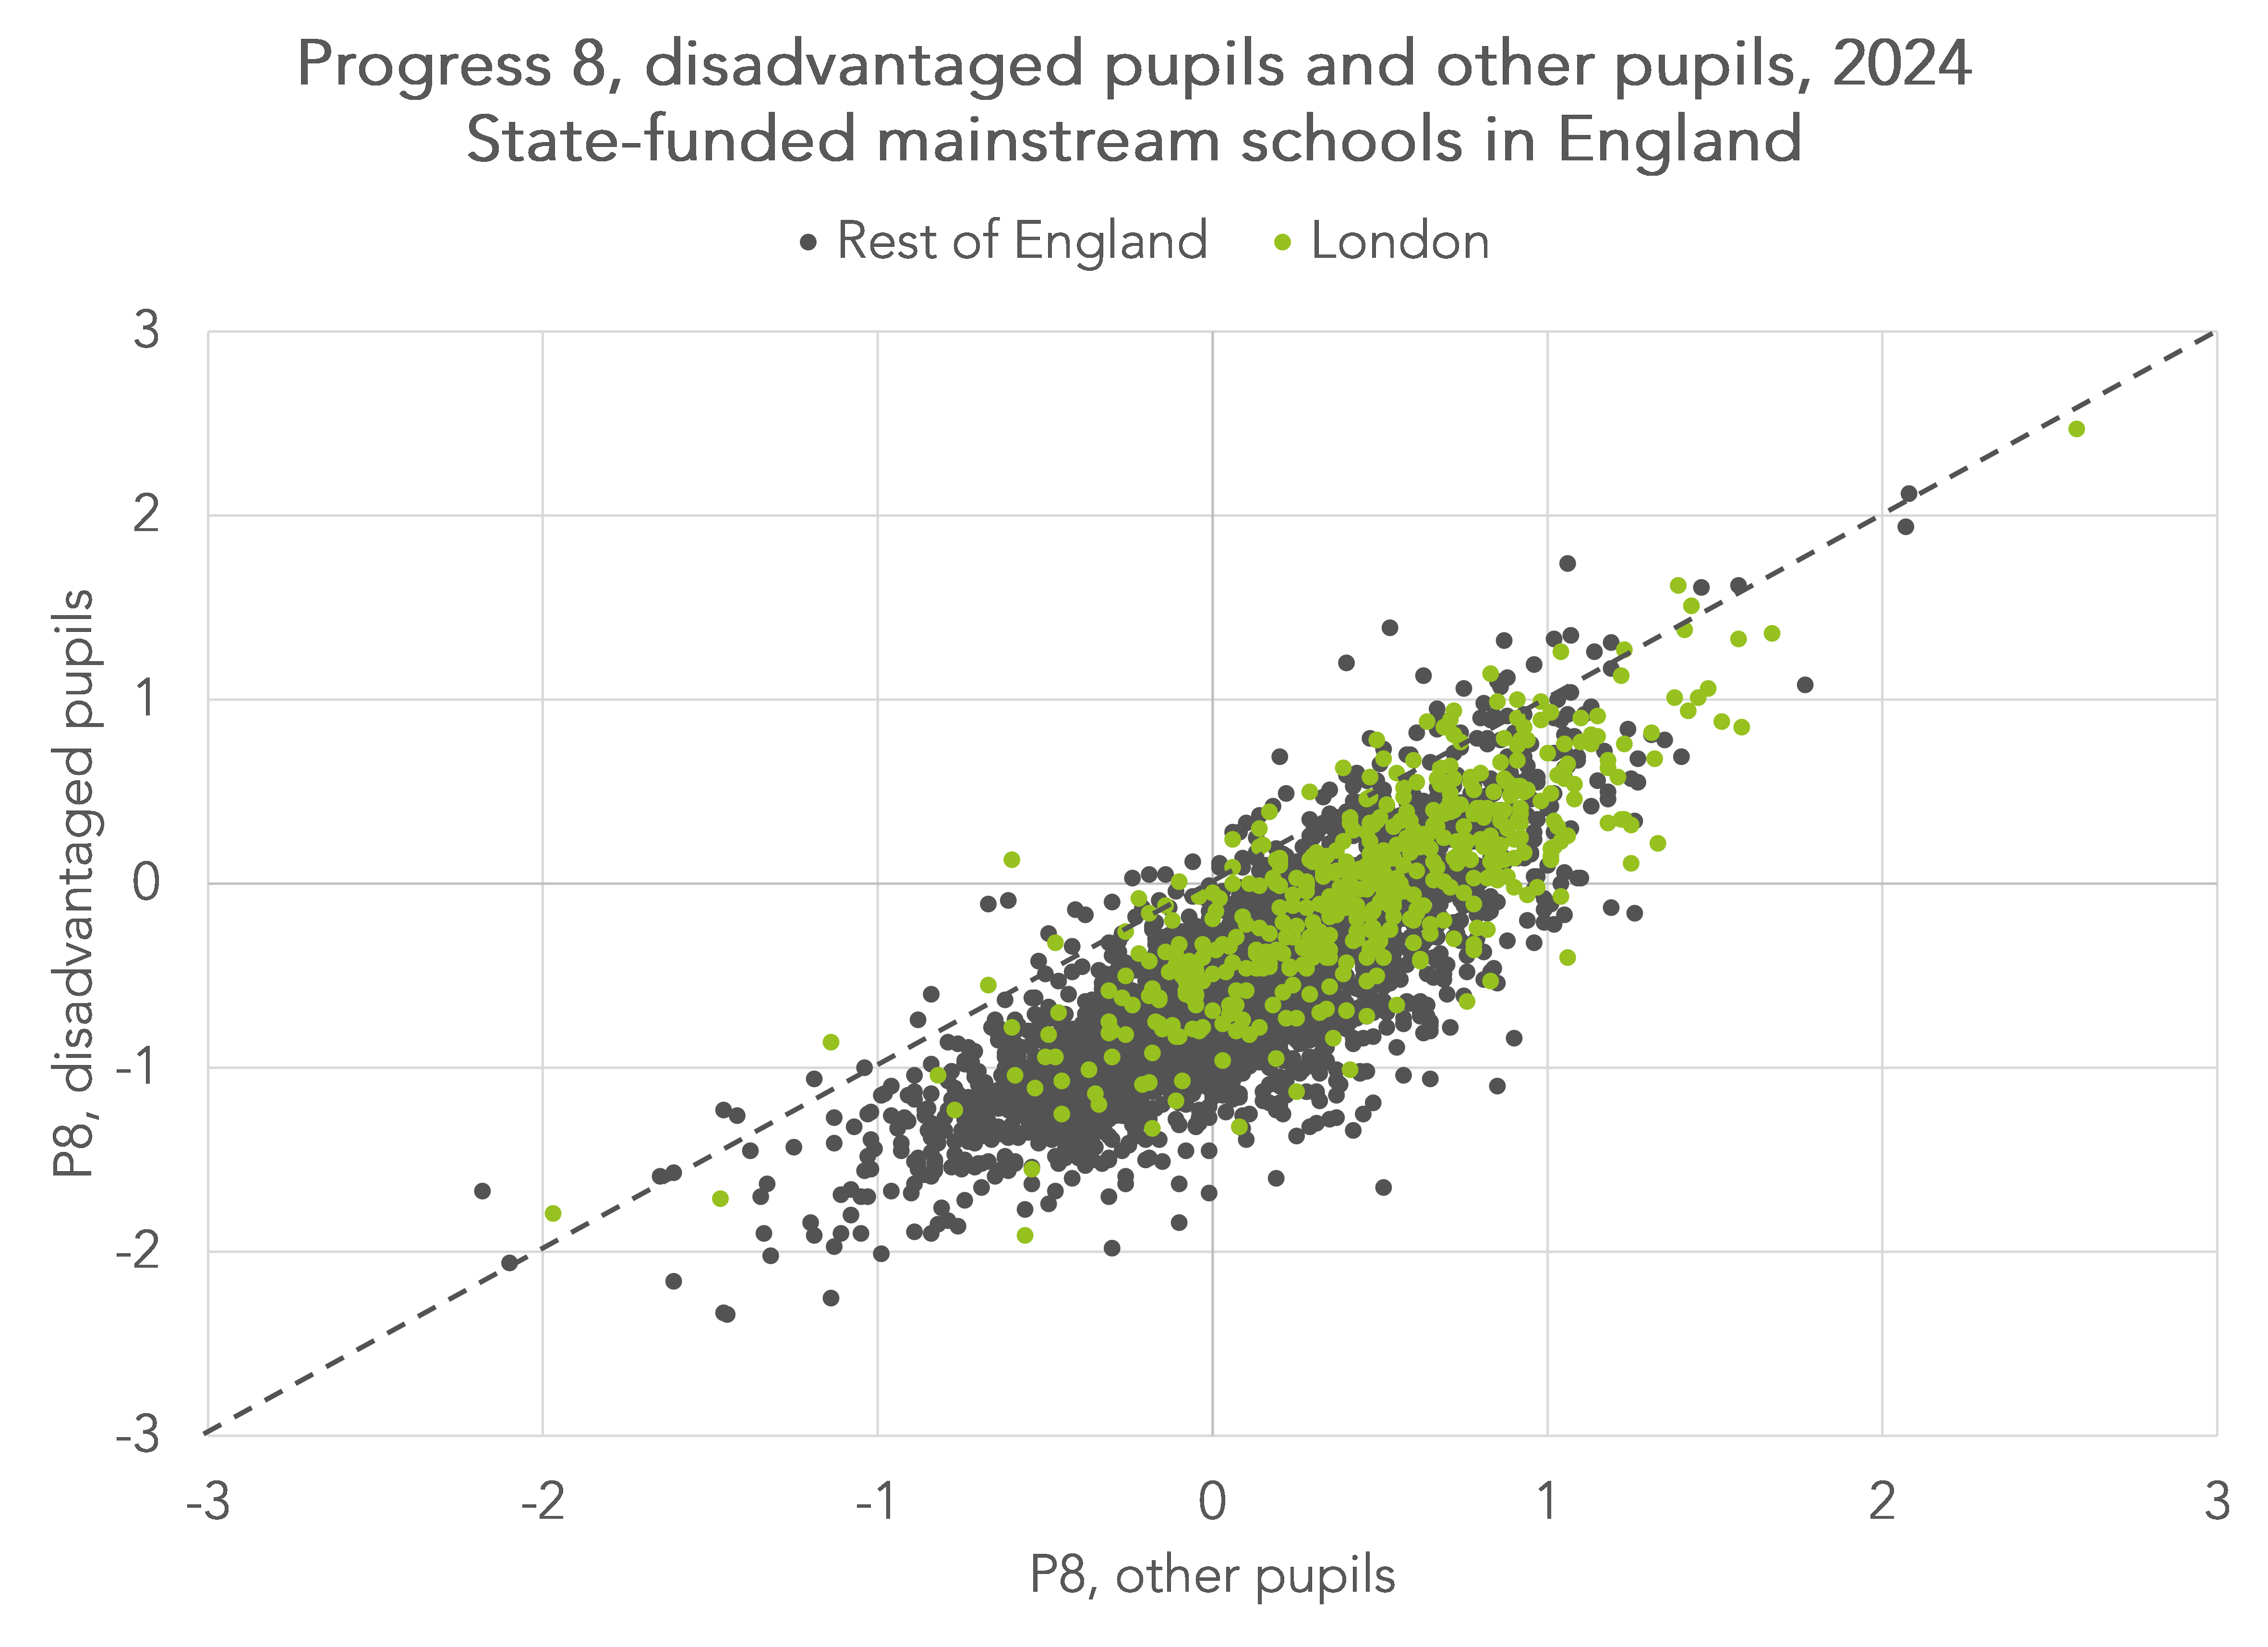
In general, non-disadvantaged pupils tended to achieve higher Progress 8 scores in most schools but this isn’t always the case. Disadvantaged pupils achieved higher Progress 8 scores in the schools plotted above the dashed diagonal line. There aren’t many of these but there are some.
National gaps would remain, even if there were no gaps in schools
Even if there were no gaps in schools, there would still be a gap nationally.
Here’s an example. Imagine there are just two schools: A and B. Let’s say that 70% of disadvantaged pupils go to School A and 30% go to School B. Progress 8 scores for both schools are shown in the following table.
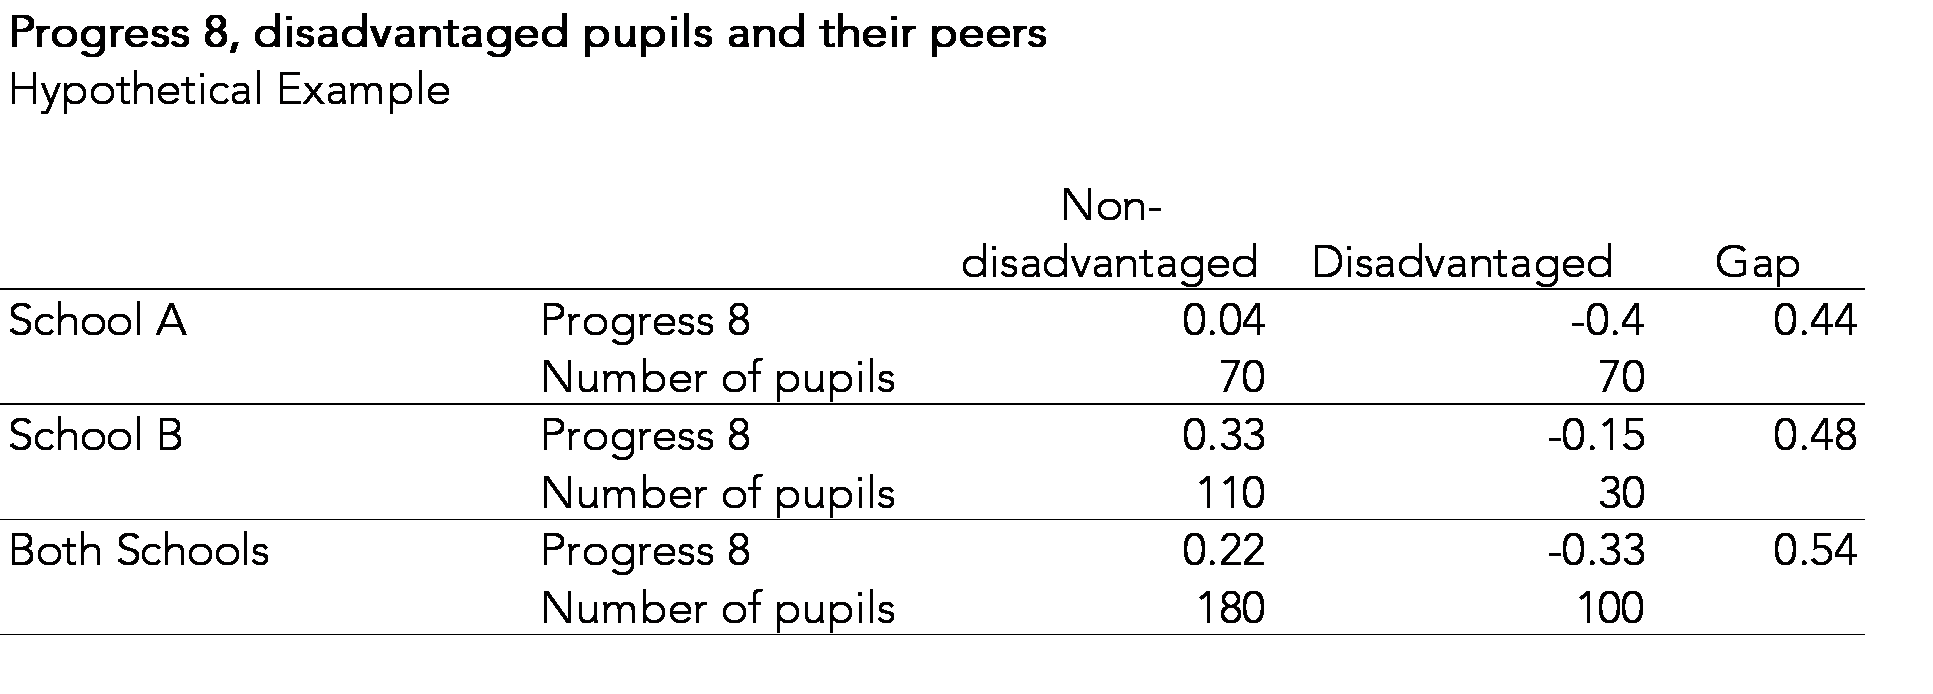
This results in a gap of 0.54 points between disadvantaged pupils and their peers.
Now let’s imagine that in both schools disadvantaged pupils achieved the same Progress 8 score on average as their peers.
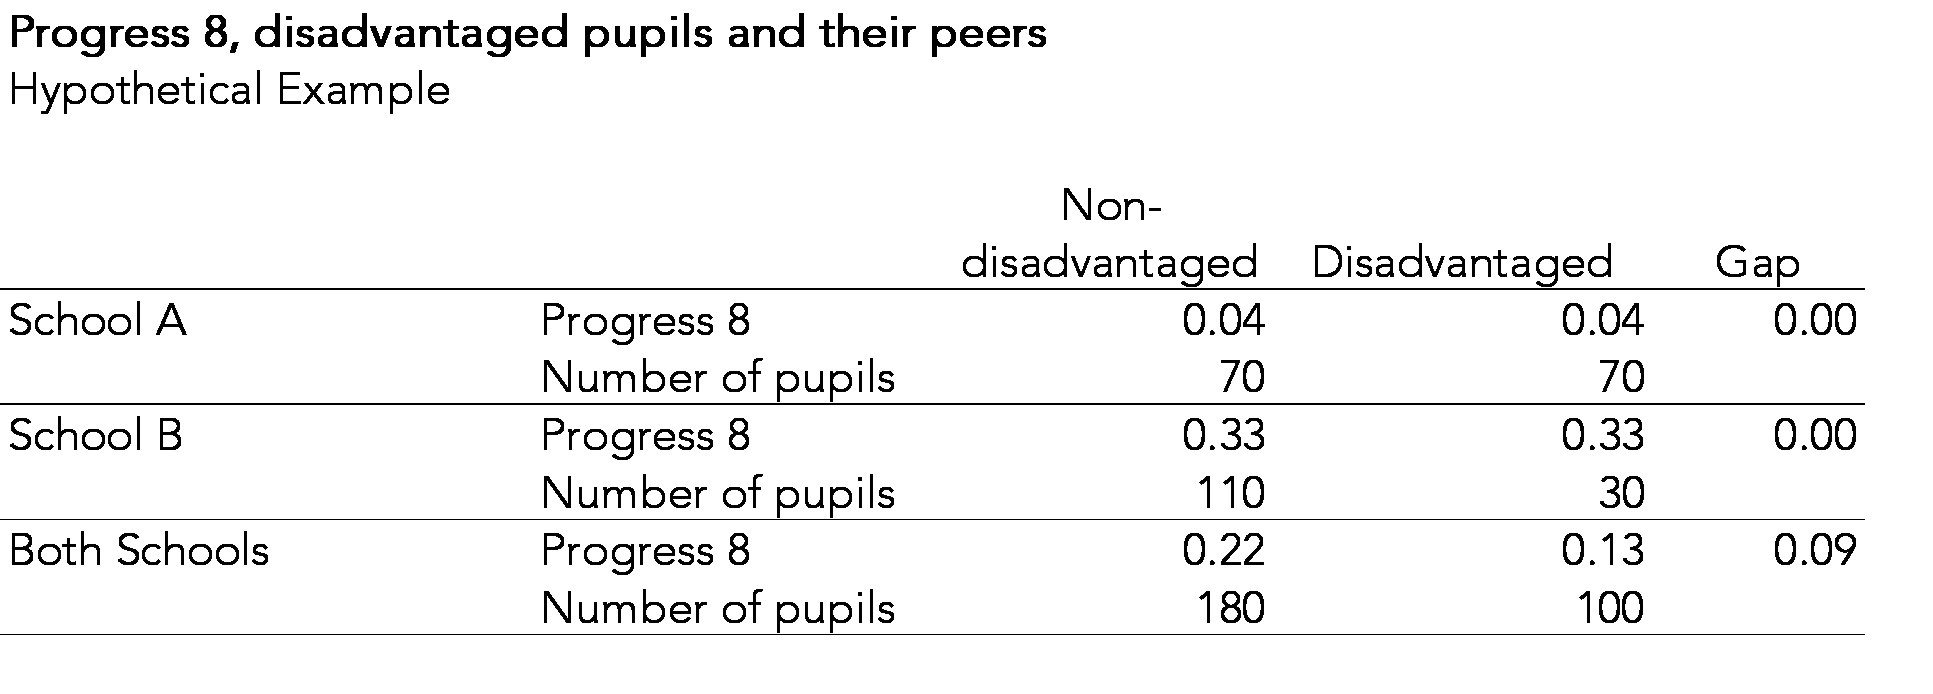
This results in a reduced gap of 0.09 points which arises because disadvantaged pupils were disproportionately more likely to attend the lower attaining school, School A.
Splitting the gap between and within schools
In the hypothetical example above, 100% of the gap would be due to between-school differences (as there would be no within-school differences).
So let’s see what happens when we run the calculation on real data, using the national 2024 school-level Key Stage 4 data.
The calculation shown above can be expressed using some algebra that Professor Simon Burgess of Bristol University once shoved under my nose one wet afternoon a few years ago. I am grateful to him for doing so and for permitting me to use it here.
First, we split the Progress 8 gap into between-school and within-school parts for the last three years.
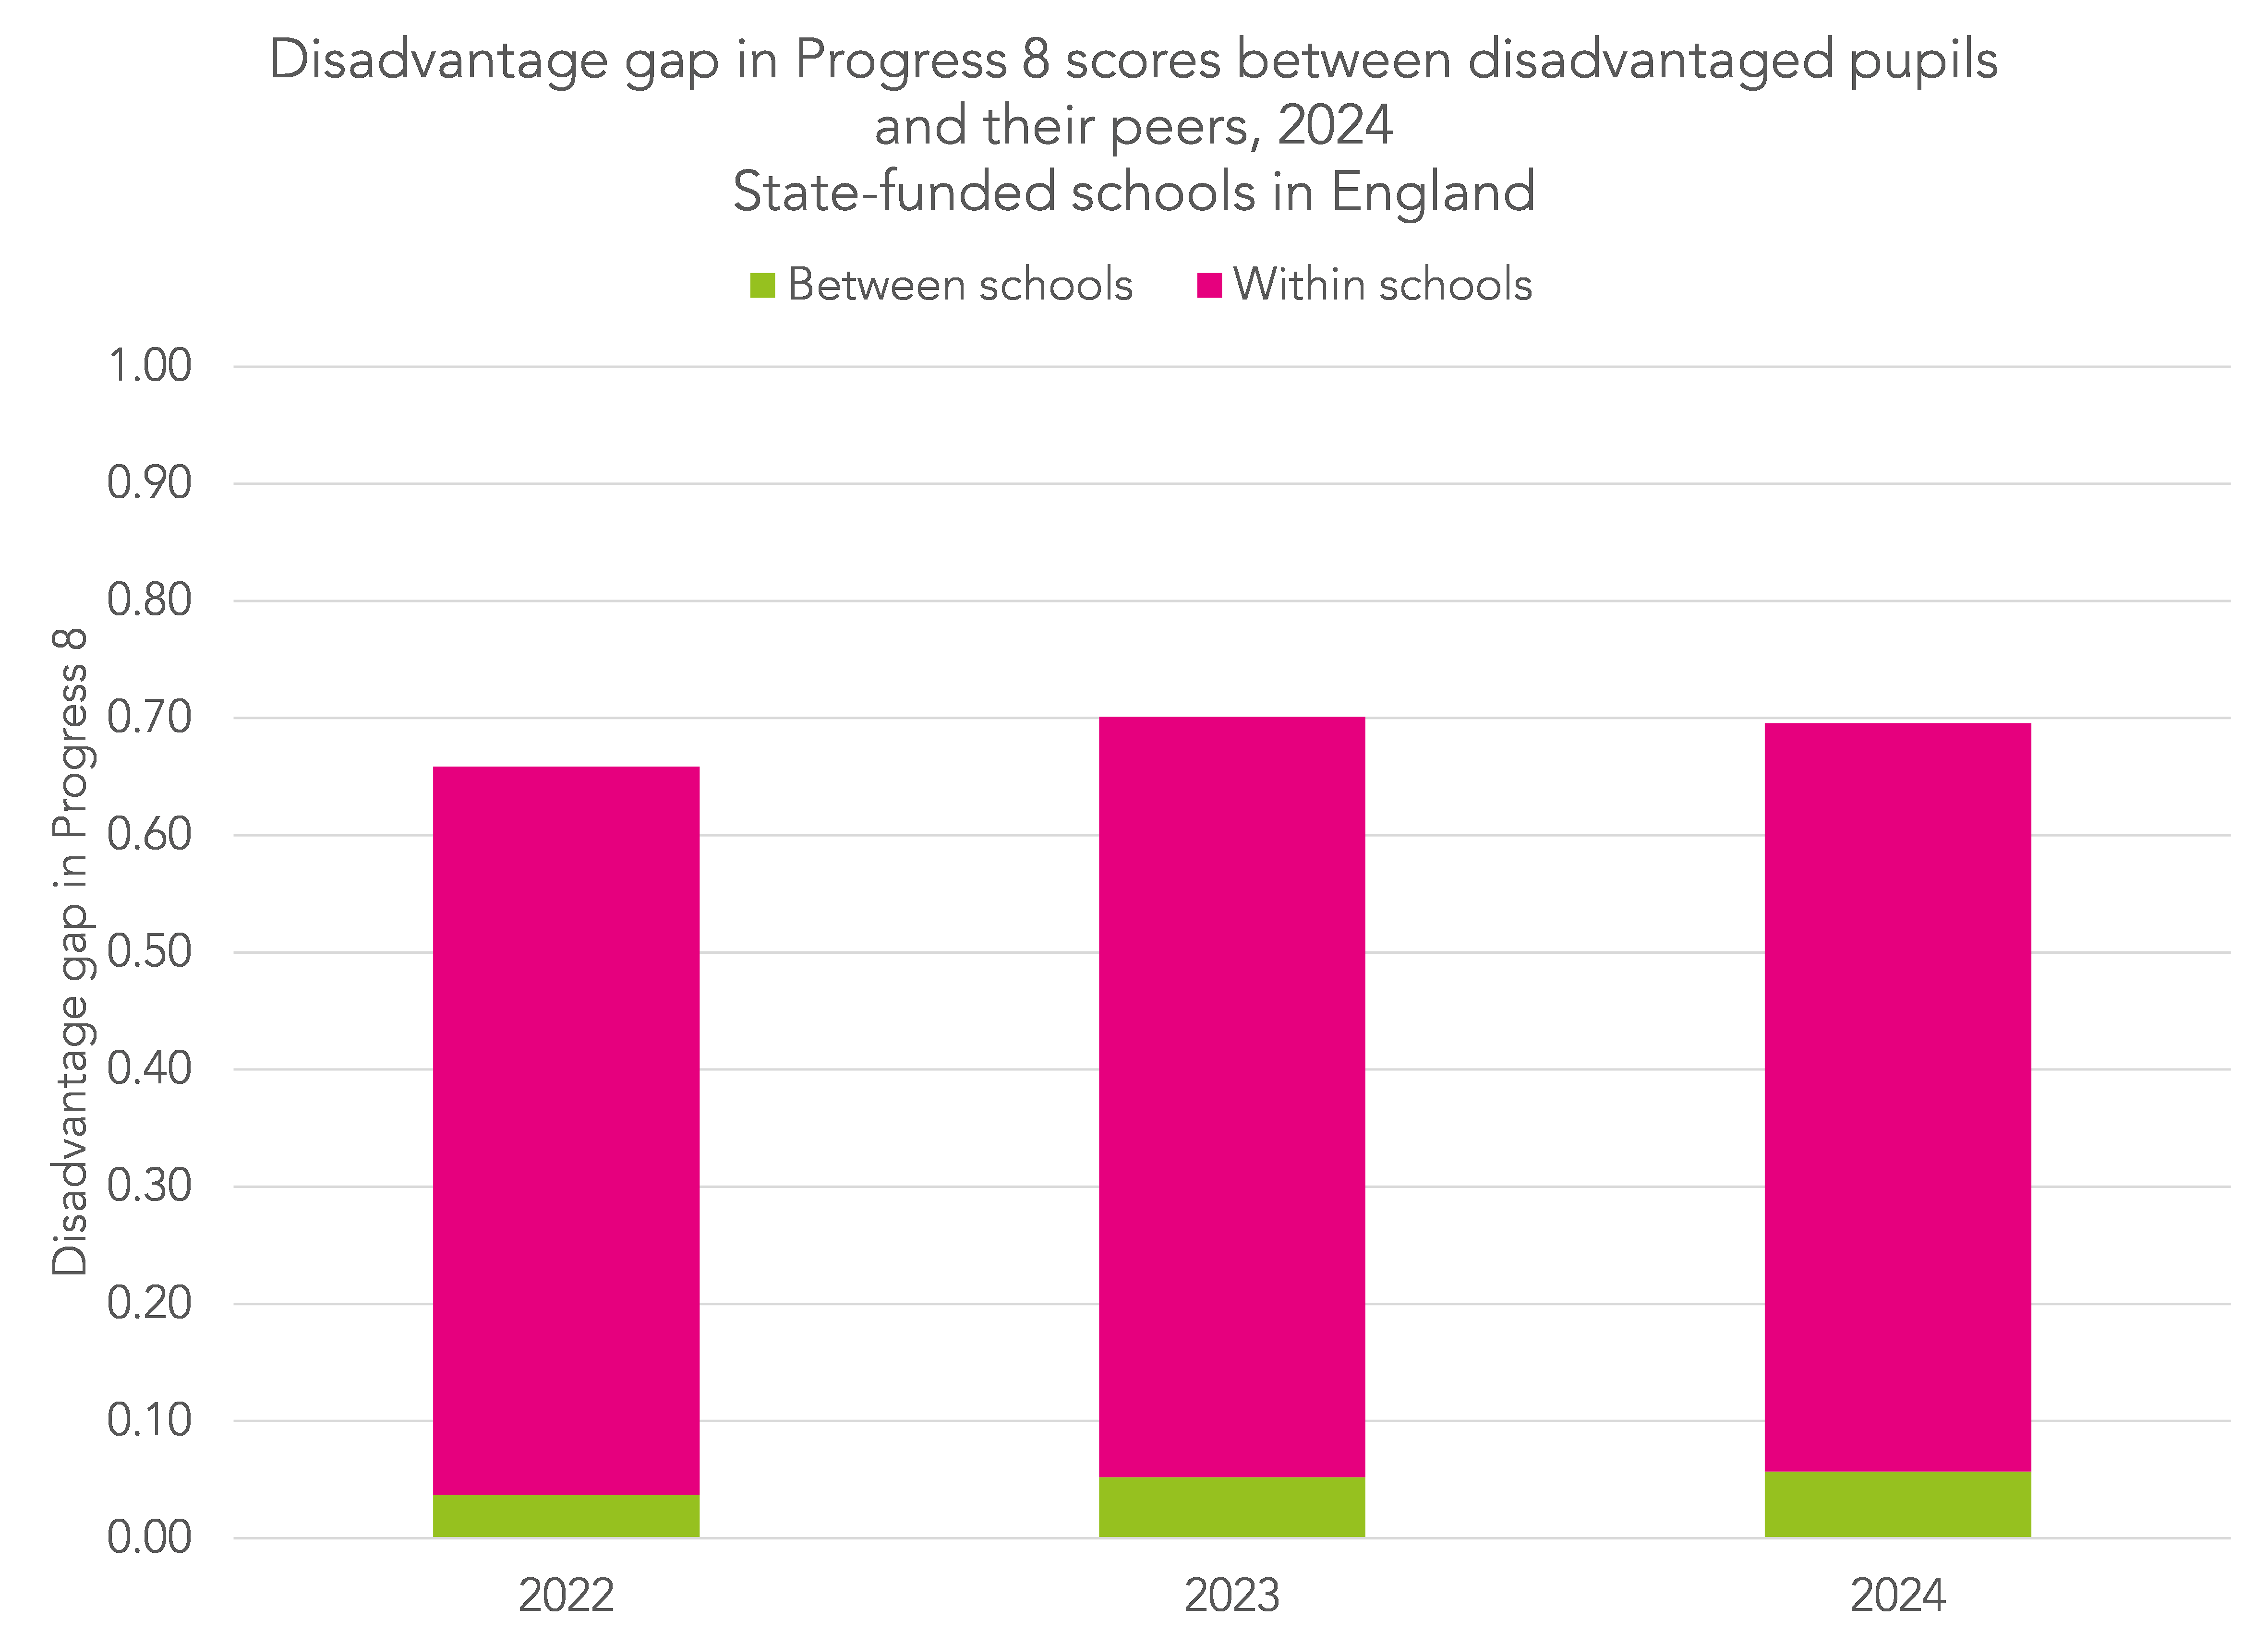
In 2024, the gap stood at 0.7 grades per subject. Roughly 8% was between schools. In other words, the vast majority can be attributed to within school gaps, i.e. the fact that disadvantaged pupils tend to achieve lower Progress 8 schools than their peers in most schools.
The gap increased slightly between 2022 and 2023, possibly as a result of returning to pre-pandemic grading standards, and the percentage attributed to between school differences also increased, from just under 6% to just over 7%.
We can produce a similar chart for Attainment 8.
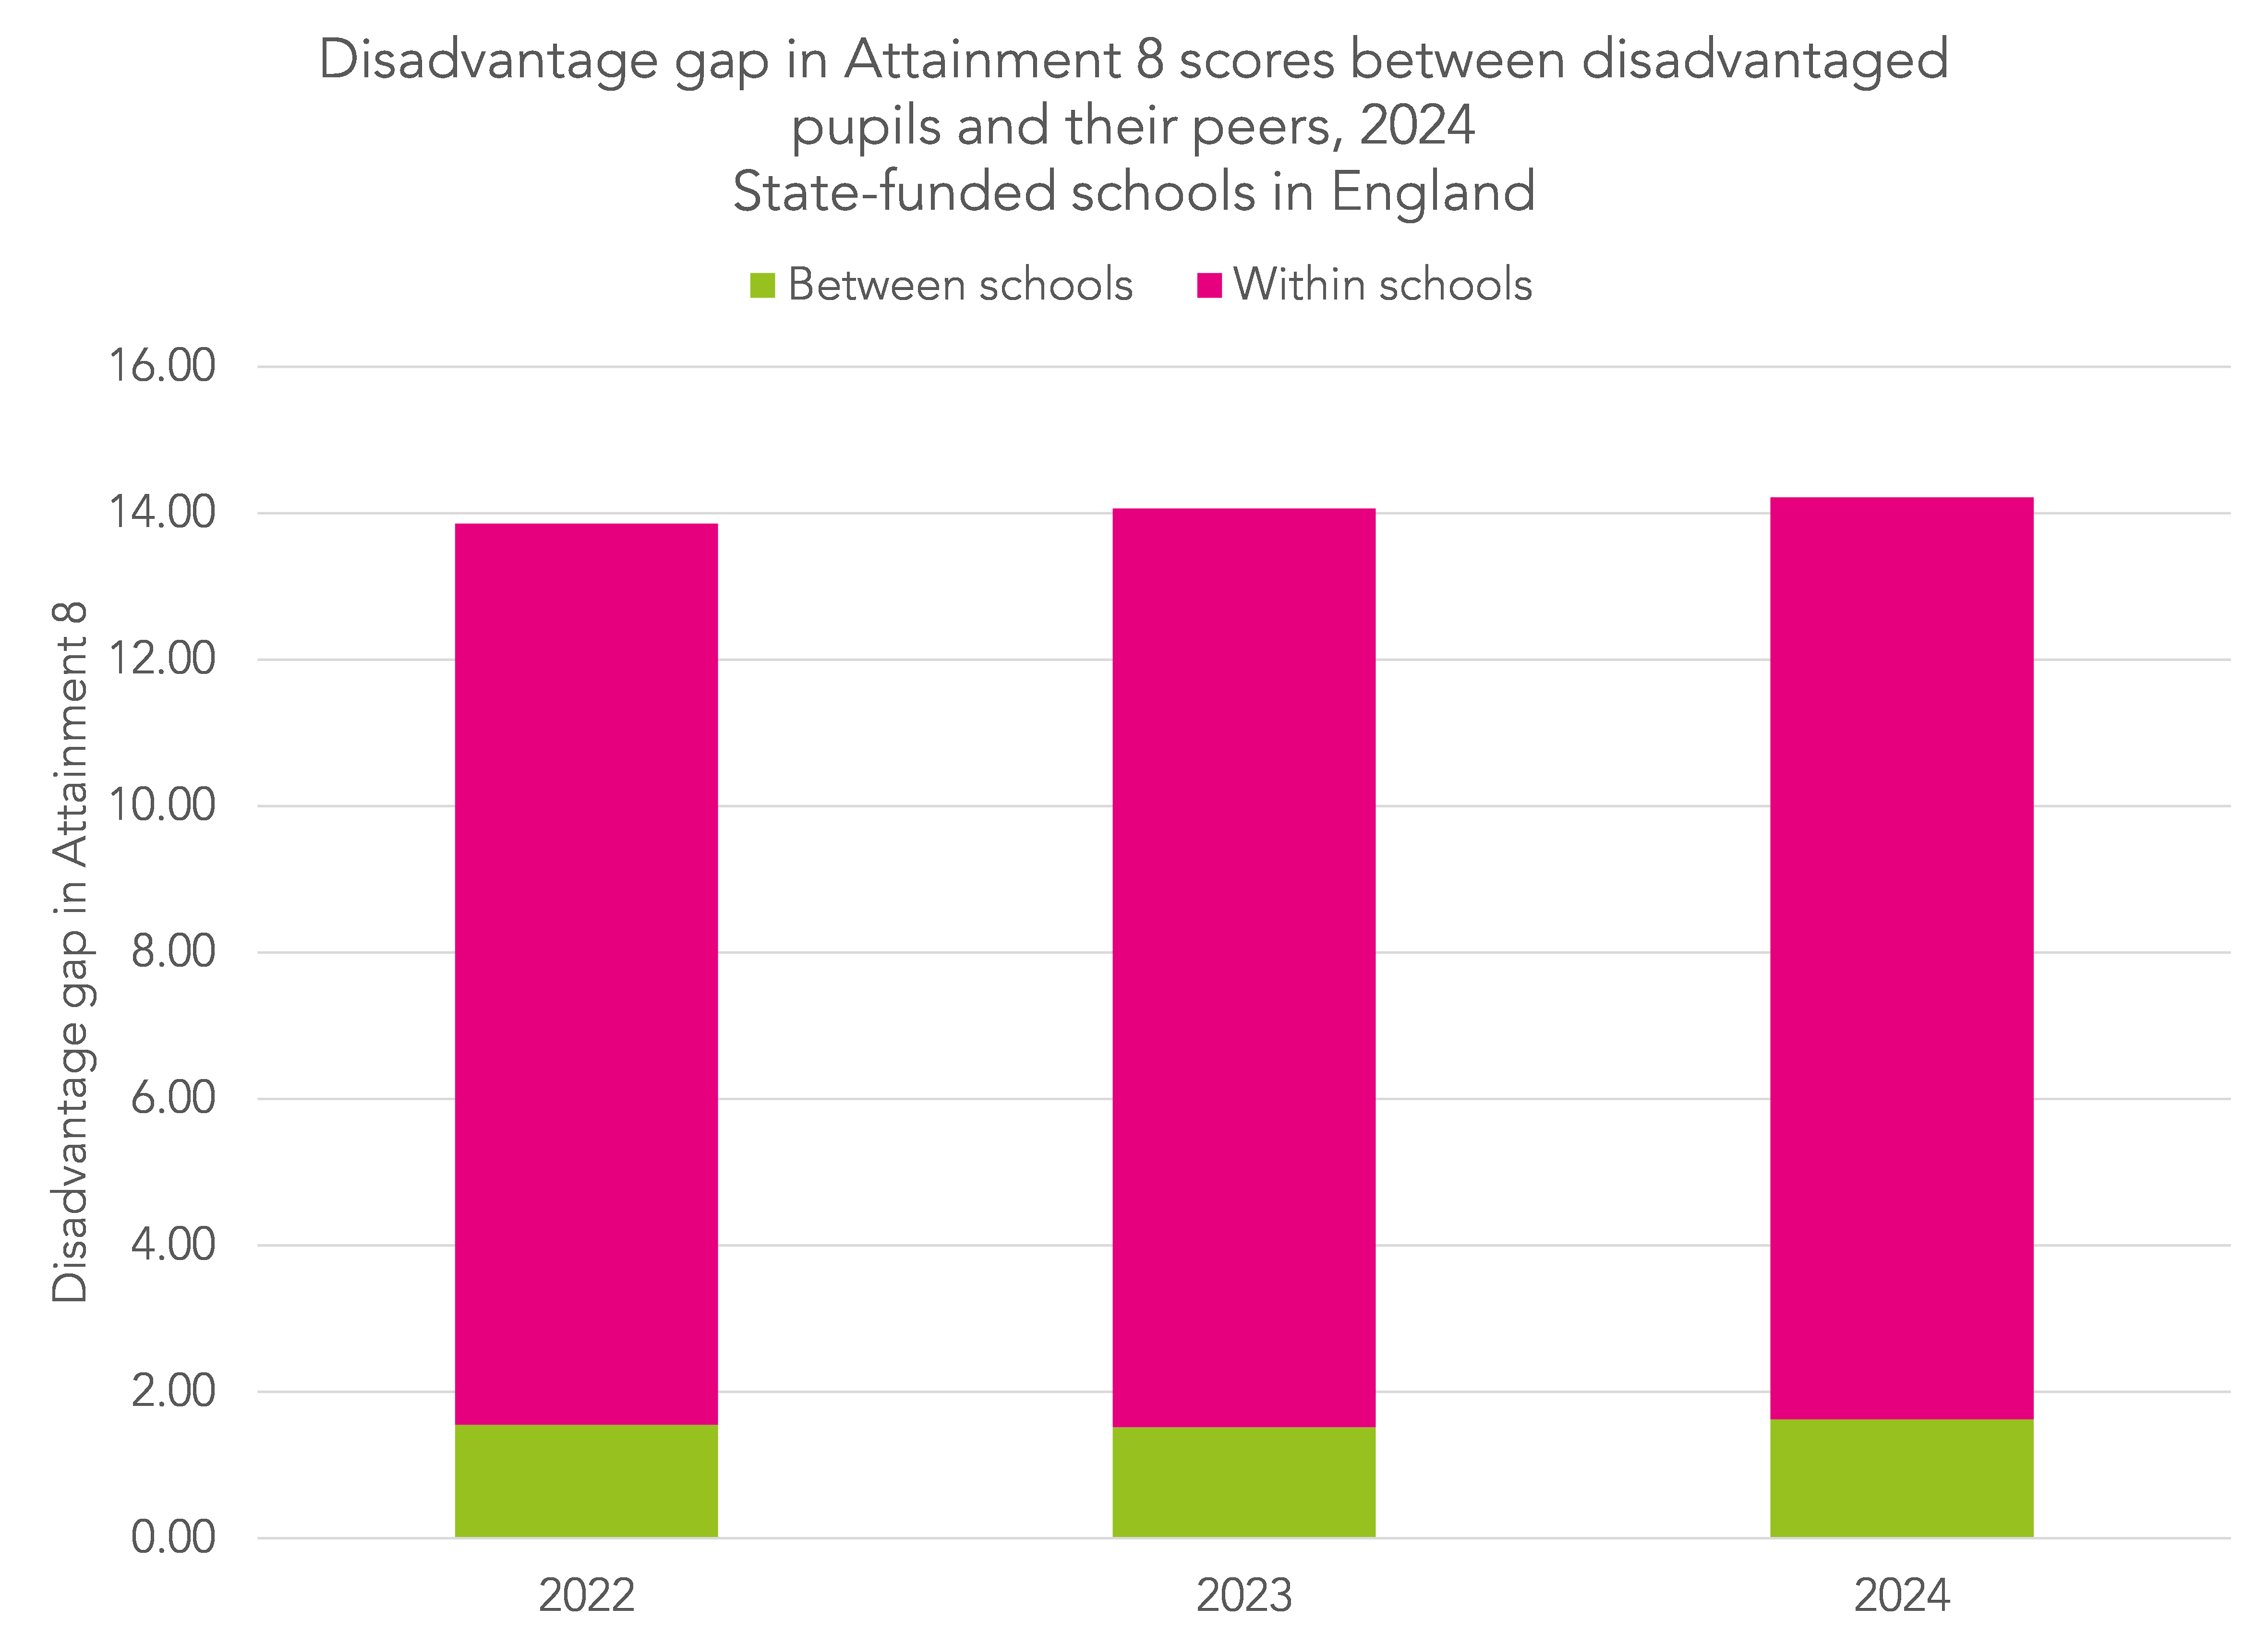
This time we see very similar results for all three years. The total gap is around 14 points, and 11% can be attributed to between-school differences.
Summing up
Fairer admissions are a good thing in and of itself.
However, based on this analysis, we would not expect giving disadvantaged pupils a greater chance of being admitted to higher performing schools to have a massive impact on the disadvantage gap. That said, a small impact at (relatively) low cost could be worth having.
This all assumes that the attainment of pupils who would benefit from fairer admissions would be higher as a result of attending a higher-performing school. This is a causal question and the answer is by no means certain.
Finally, it is worth saying that, in principle, the between-school could be negative. This would arise if disadvantaged pupils were disproportionately allocated to schools with higher than average scores for disadvantaged pupils. We will see this more in the second part of this article.
Now read part two
- Eligible for free school meals (FSM) in the last 6 years, although due to changes in FSM eligibility this is now eligible in the last 7 years.
- Neither measure is particularly appropriate for most special schools
- Actually it is 10 since English and maths are double-weighted.
- As there are 10 slots in Attainment 8 (see footnote above).
Want to stay up-to-date with the latest research from FFT Education Datalab? Sign up to Datalab’s mailing list to get notifications about new blogposts, or to receive the team’s half-termly newsletter.


Excellent article.
I would be very interested to know what proportion of non-disadvantaged pupils do badly at GCSE eg grade 3 or below. And what proportion of disadvantaged pupils do well (high attainment score). The REASON I am interested is that we tend to talk about disadvantaged pupils as if they all do badly etc which is untrue.
Thanks Barnaby. Yes, there is a tendency to focus too much on differences between groups (and schools) and not enough on the variation within groups (or schools). In answer to your question, the first part is straightforward- 27% of non-disadvantaged pupils achieved 3 or below in both English and maths in 2024. DfE don’t really publish a measure of a high attainment score. If it helps, 26% of disadvantaged pupils achieved 9-5 in both English and maths (53% non-disadvantaged).
Hi Dave,
I find the approach used in this article to split within and between school variation really interesting and I would love to chat more about it if that would be possible. We are thinking of a new project that aims to look at this in more detail.
Thanks, Julia