In the first part of this article, we examined how national gaps in Progress 8 scores between disadvantaged pupils and their peers could be split into two parts, one based on within-school gaps and the other based on between-school gaps.
In this second part, we look at how these gaps vary by region.
Data
Once again, we use published school-level Key Stage 4 data for 2024.
Part one gives details about how we split the Progress 8 gap between and within schools at a national level. We use the same methodology here, essentially running the same calculations for each region.
Results
The chart below splits the 2024 Progress 8 gap between disadvantaged pupils and their peers into between-school and within-school parts.
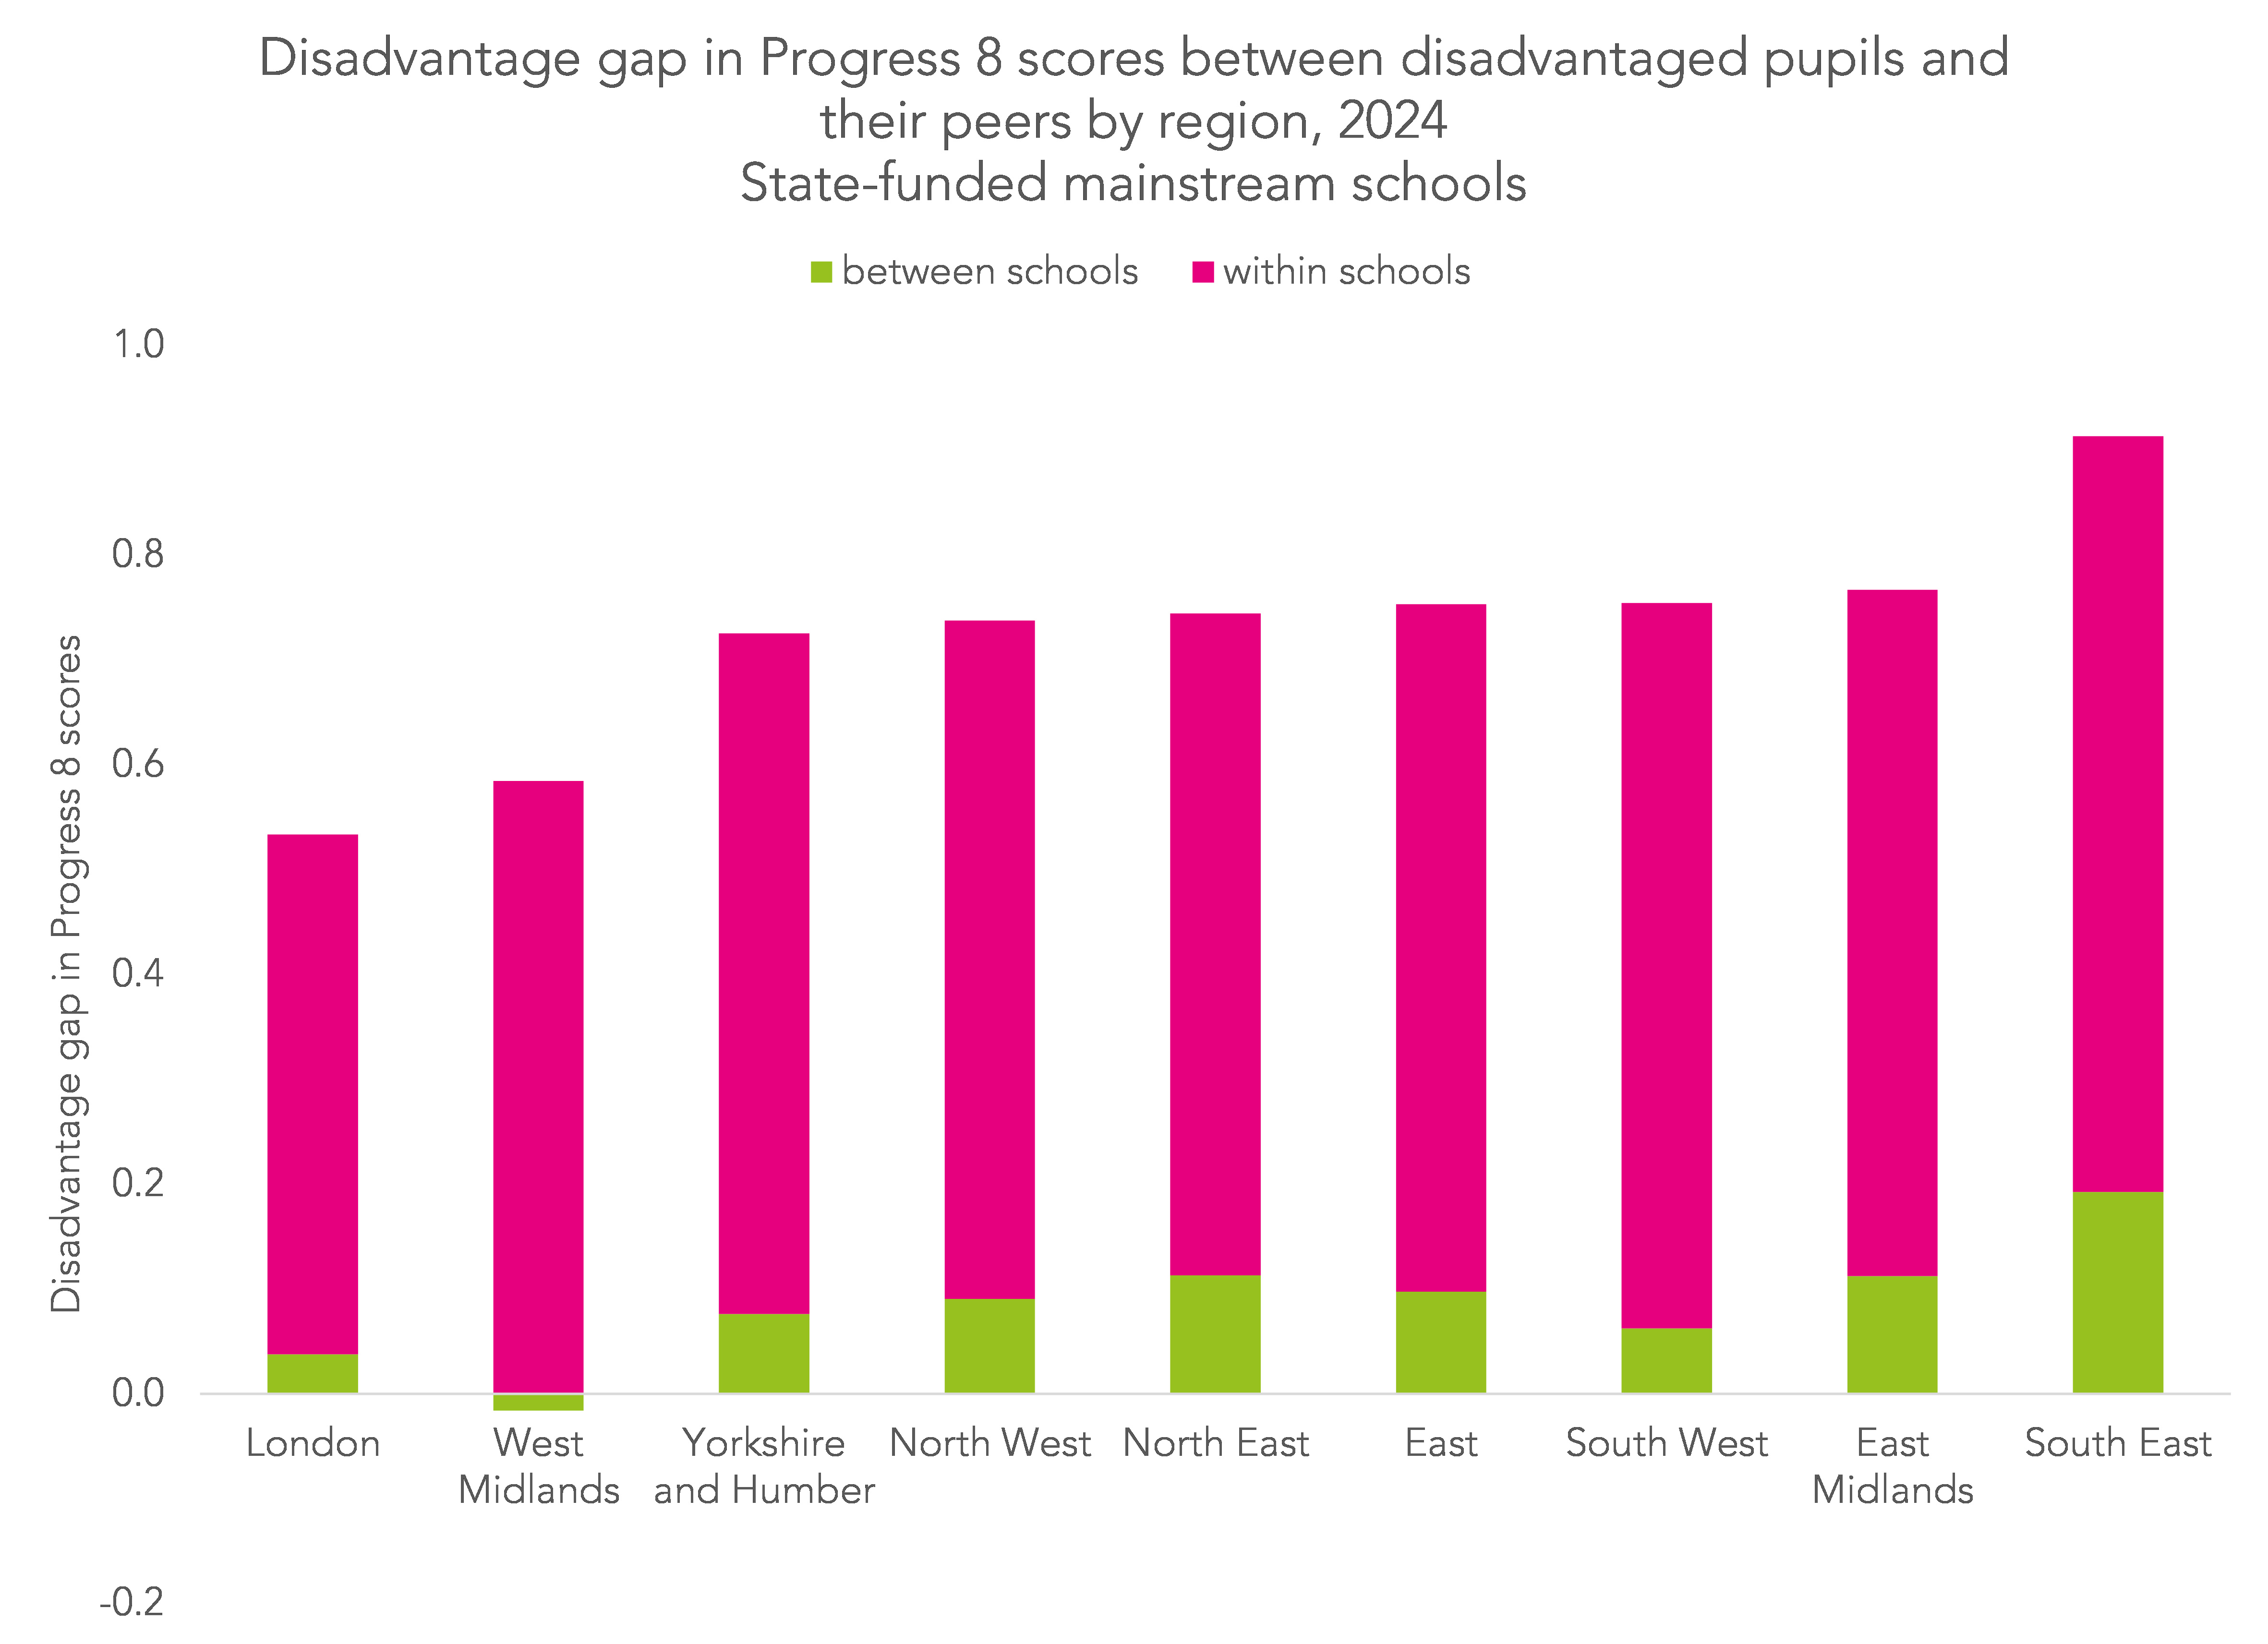
The regions are ordered from left to right by size of the gap, with the region with the largest gap (the South East) plotted on the far right (gap=0.91), and the region with the smallest gap (London) plotted on the far left (gap=0.53).
The between-school part as a proportion of the total gap also varies by region.
In the South East, around 21% of the gap can be attributed to between-school differences.
By contrast, and perhaps most interestingly, the between-school gap in the West Midlands is negative. This suggests that the allocation of pupils to schools is actually helping reduce the Progress 8 gap.
Results for 2023 were similar.
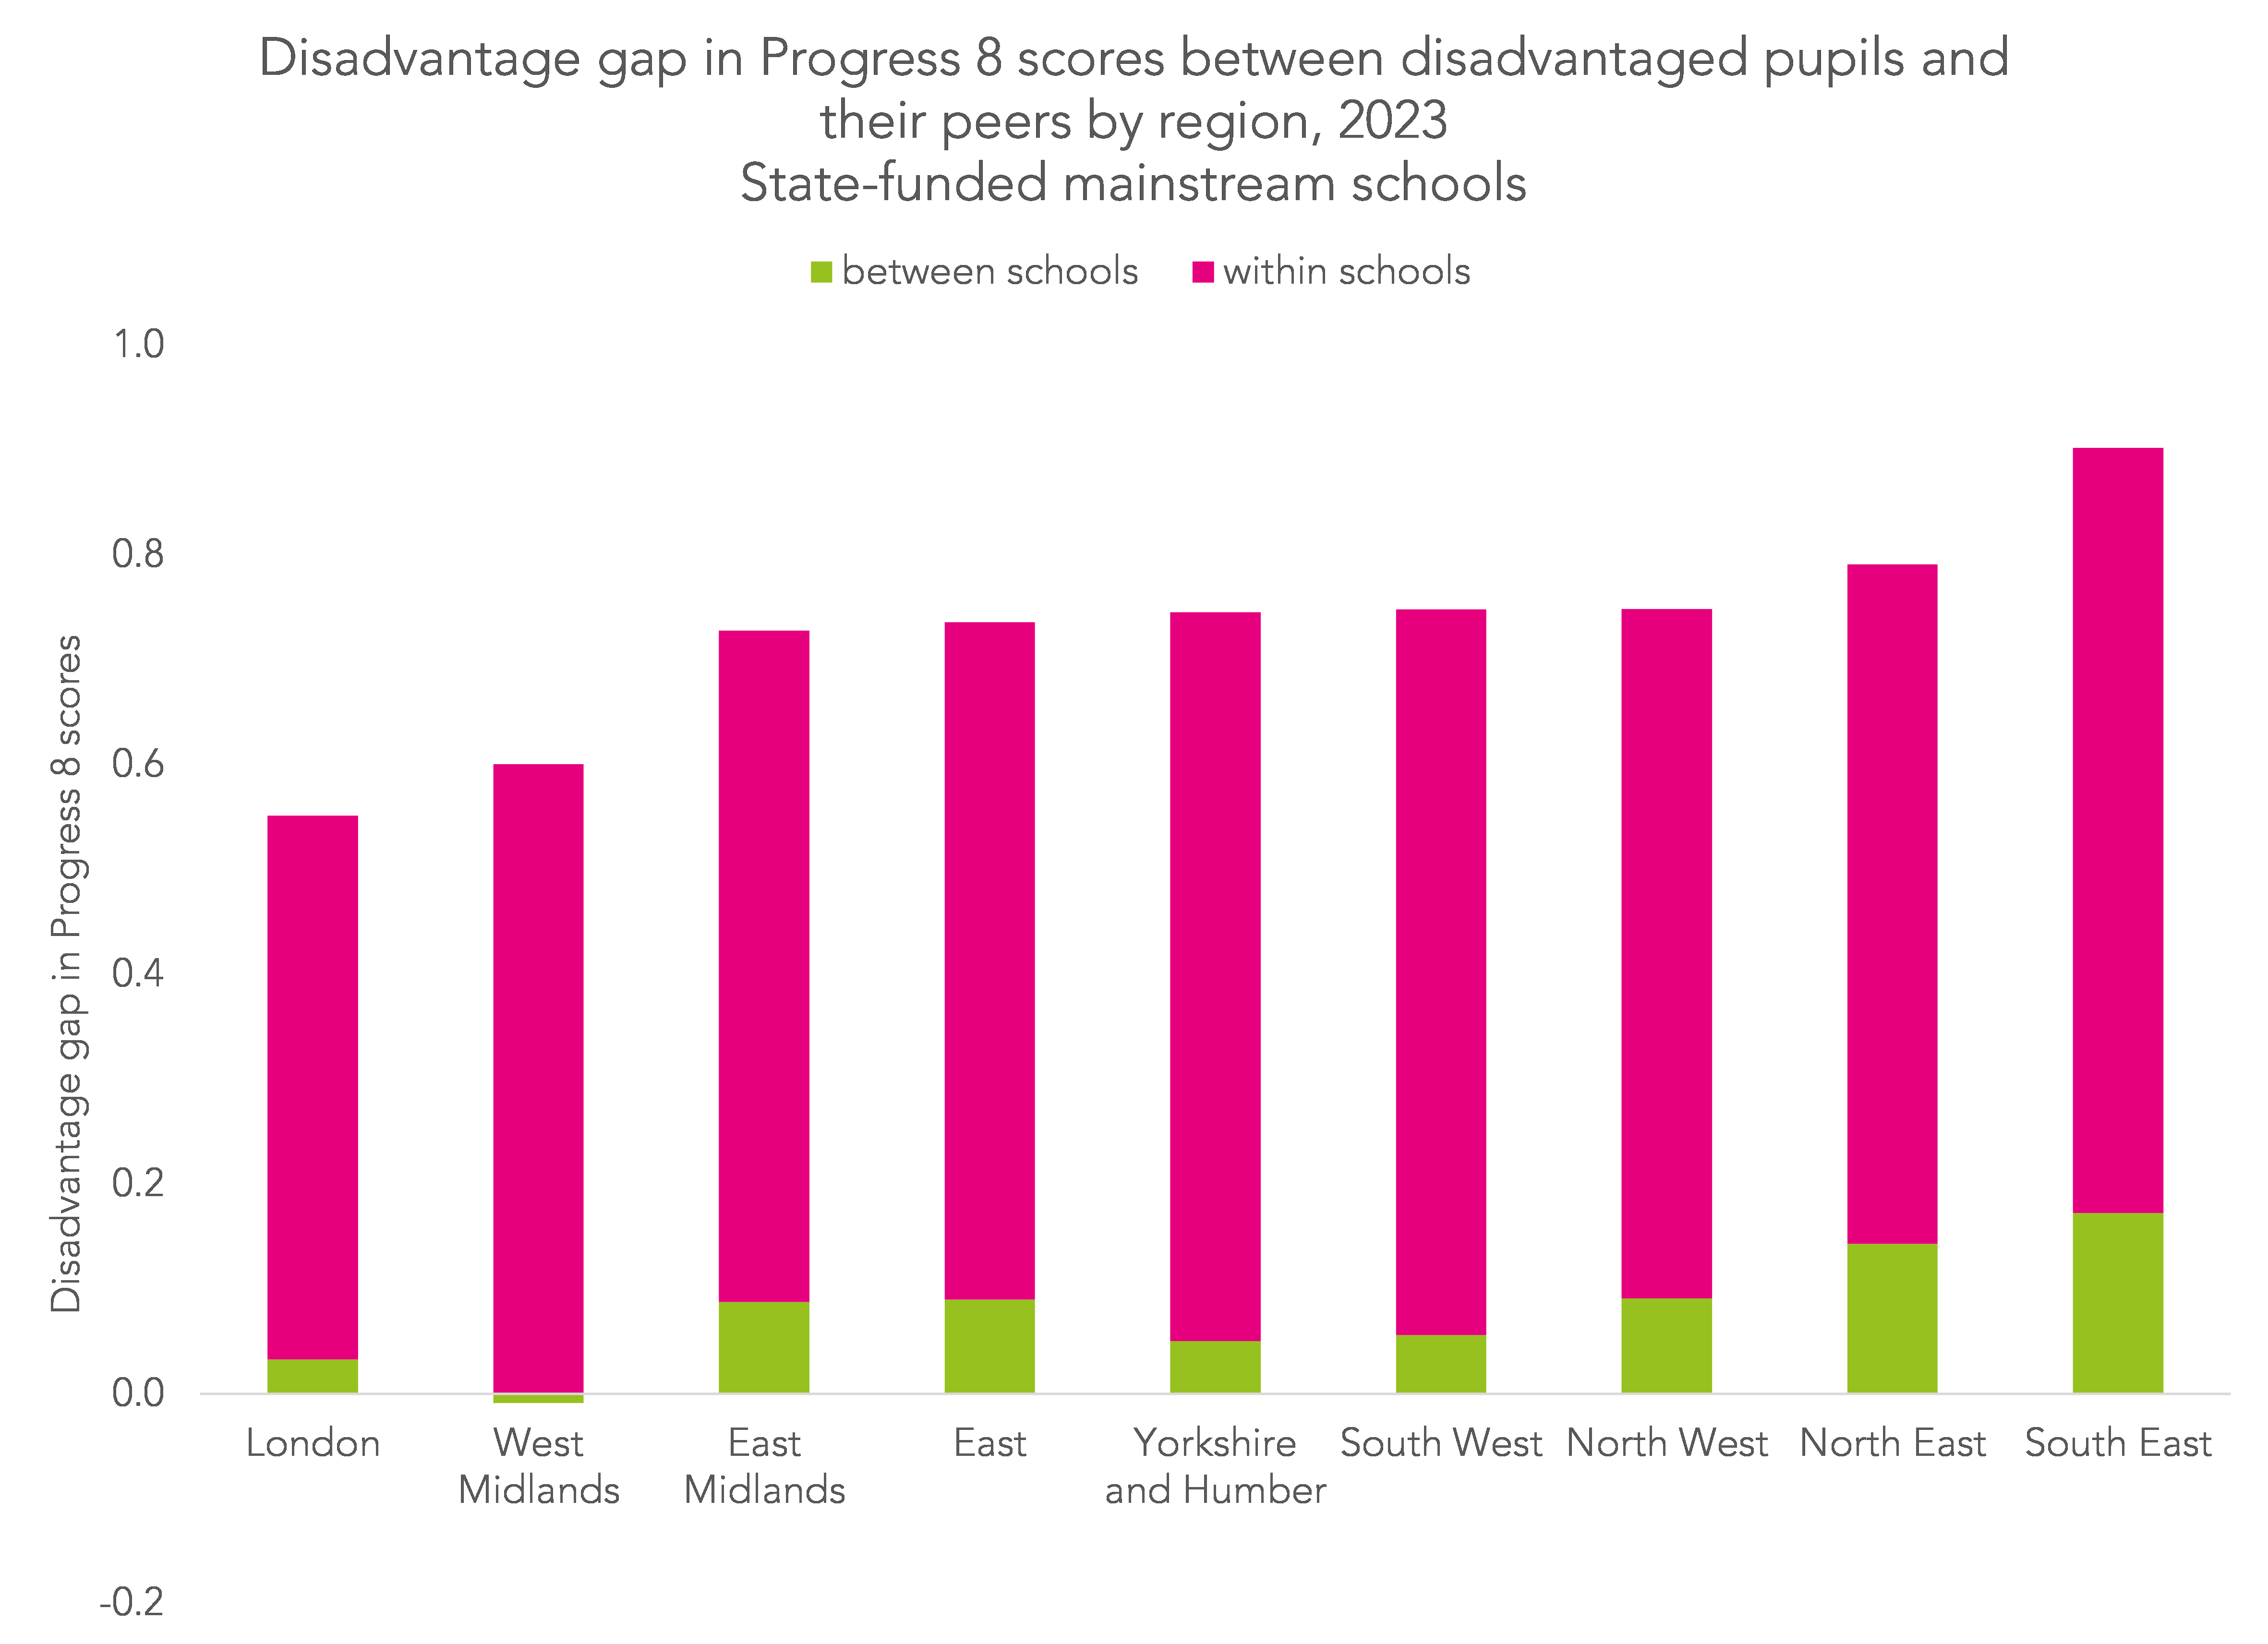
In both years the gap was narrower in London and the West Midlands and wider in the South East.
Gaps in other regions were similar in total. However, between school gaps were smaller in the South West and Yorkshire and Humber.
Comparing the West Midlands and South East
Let’s have a look at why we have such differences between West Midlands and the South East.
First, we plot the Progress 8 scores of disadvantaged pupils at each school in the West Midlands by the percentage of disadvantaged pupils.
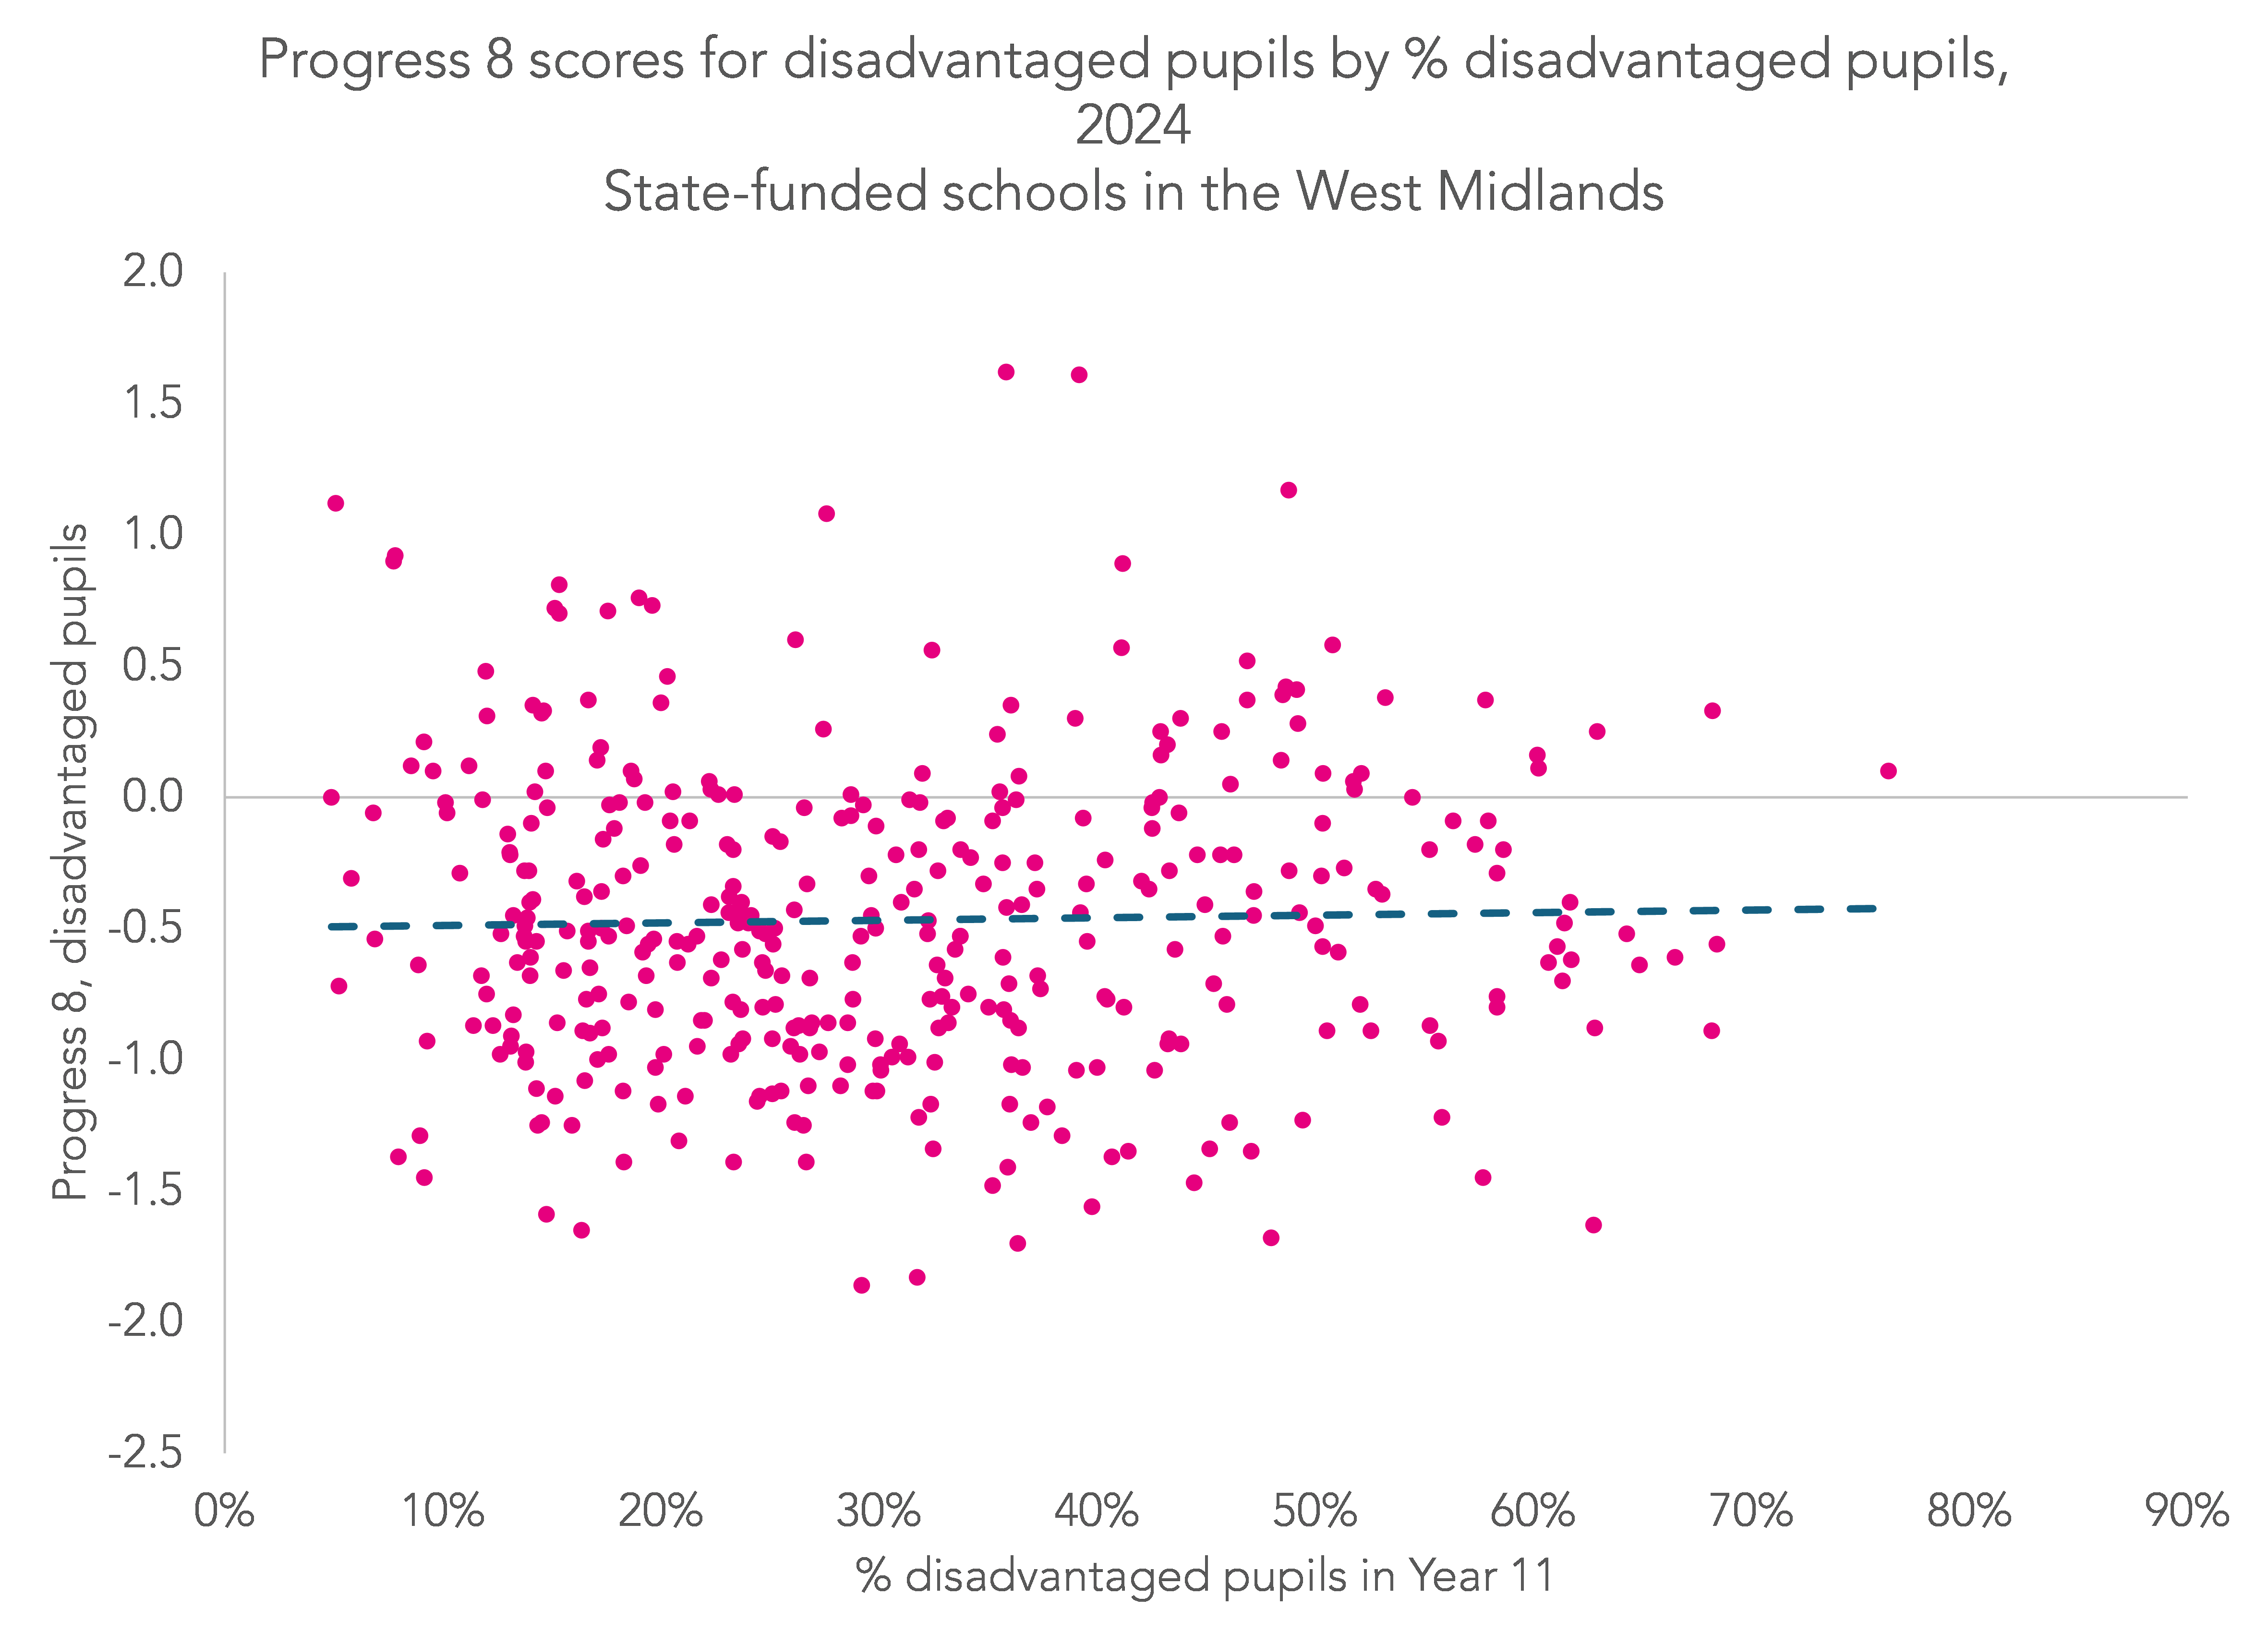
Although there is substantial variation, the general trend is that Progress 8 scores for disadvantaged pupils do not change much as the percentage of disadvantaged pupils increases. In other words, disadvantaged pupils did not disproportionately end up in schools with low attainment and so there is little to no between-school variation.
In fact, the plotted trendline (the dashed line) has a very slightly positive gradient, indicating that P8 scores for disadvantaged pupils are slightly higher in schools with large proportions of disadvantaged pupils.
By contrast, the pattern in the South East is perhaps more what we would expect.
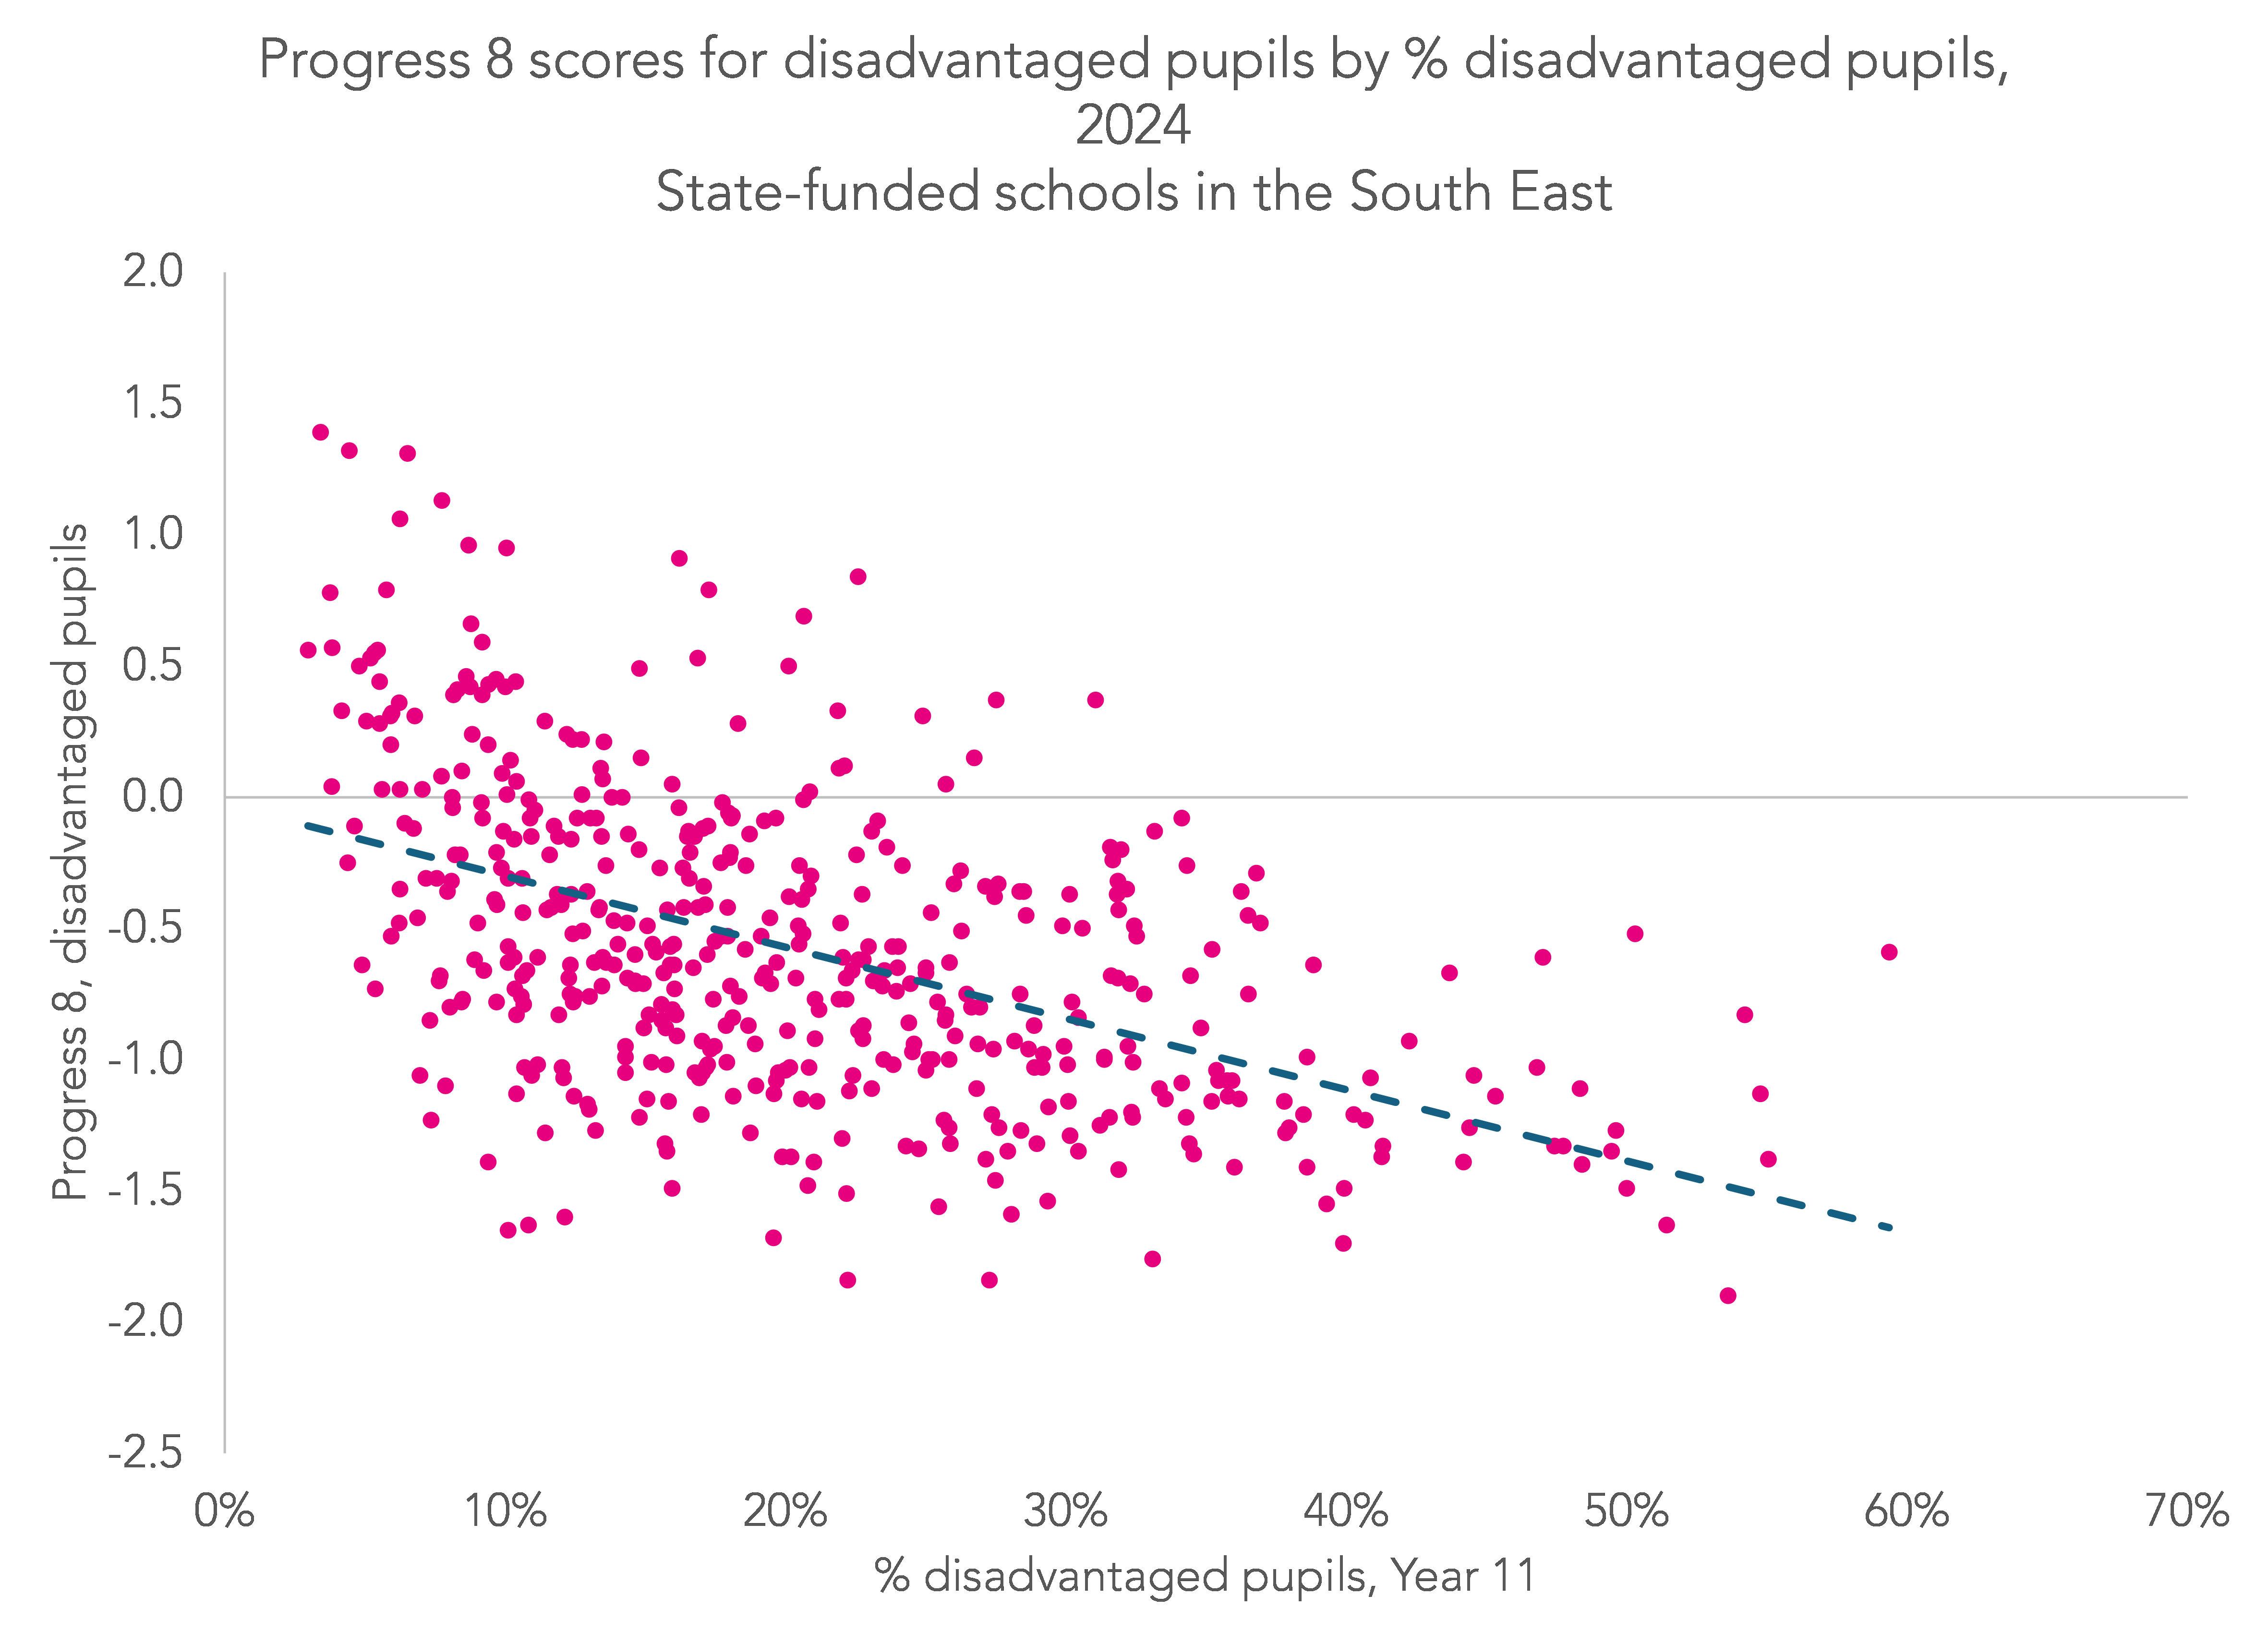
Progress 8 scores for disadvantaged pupils tend to decline as the percentage of disadvantaged pupils in the cohort increases. In other words, there is a fair amount of between-school variation.
The largest local authority in the South East is in Kent, where around 30% of pupils attend selective schools. We show just schools in Kent below.
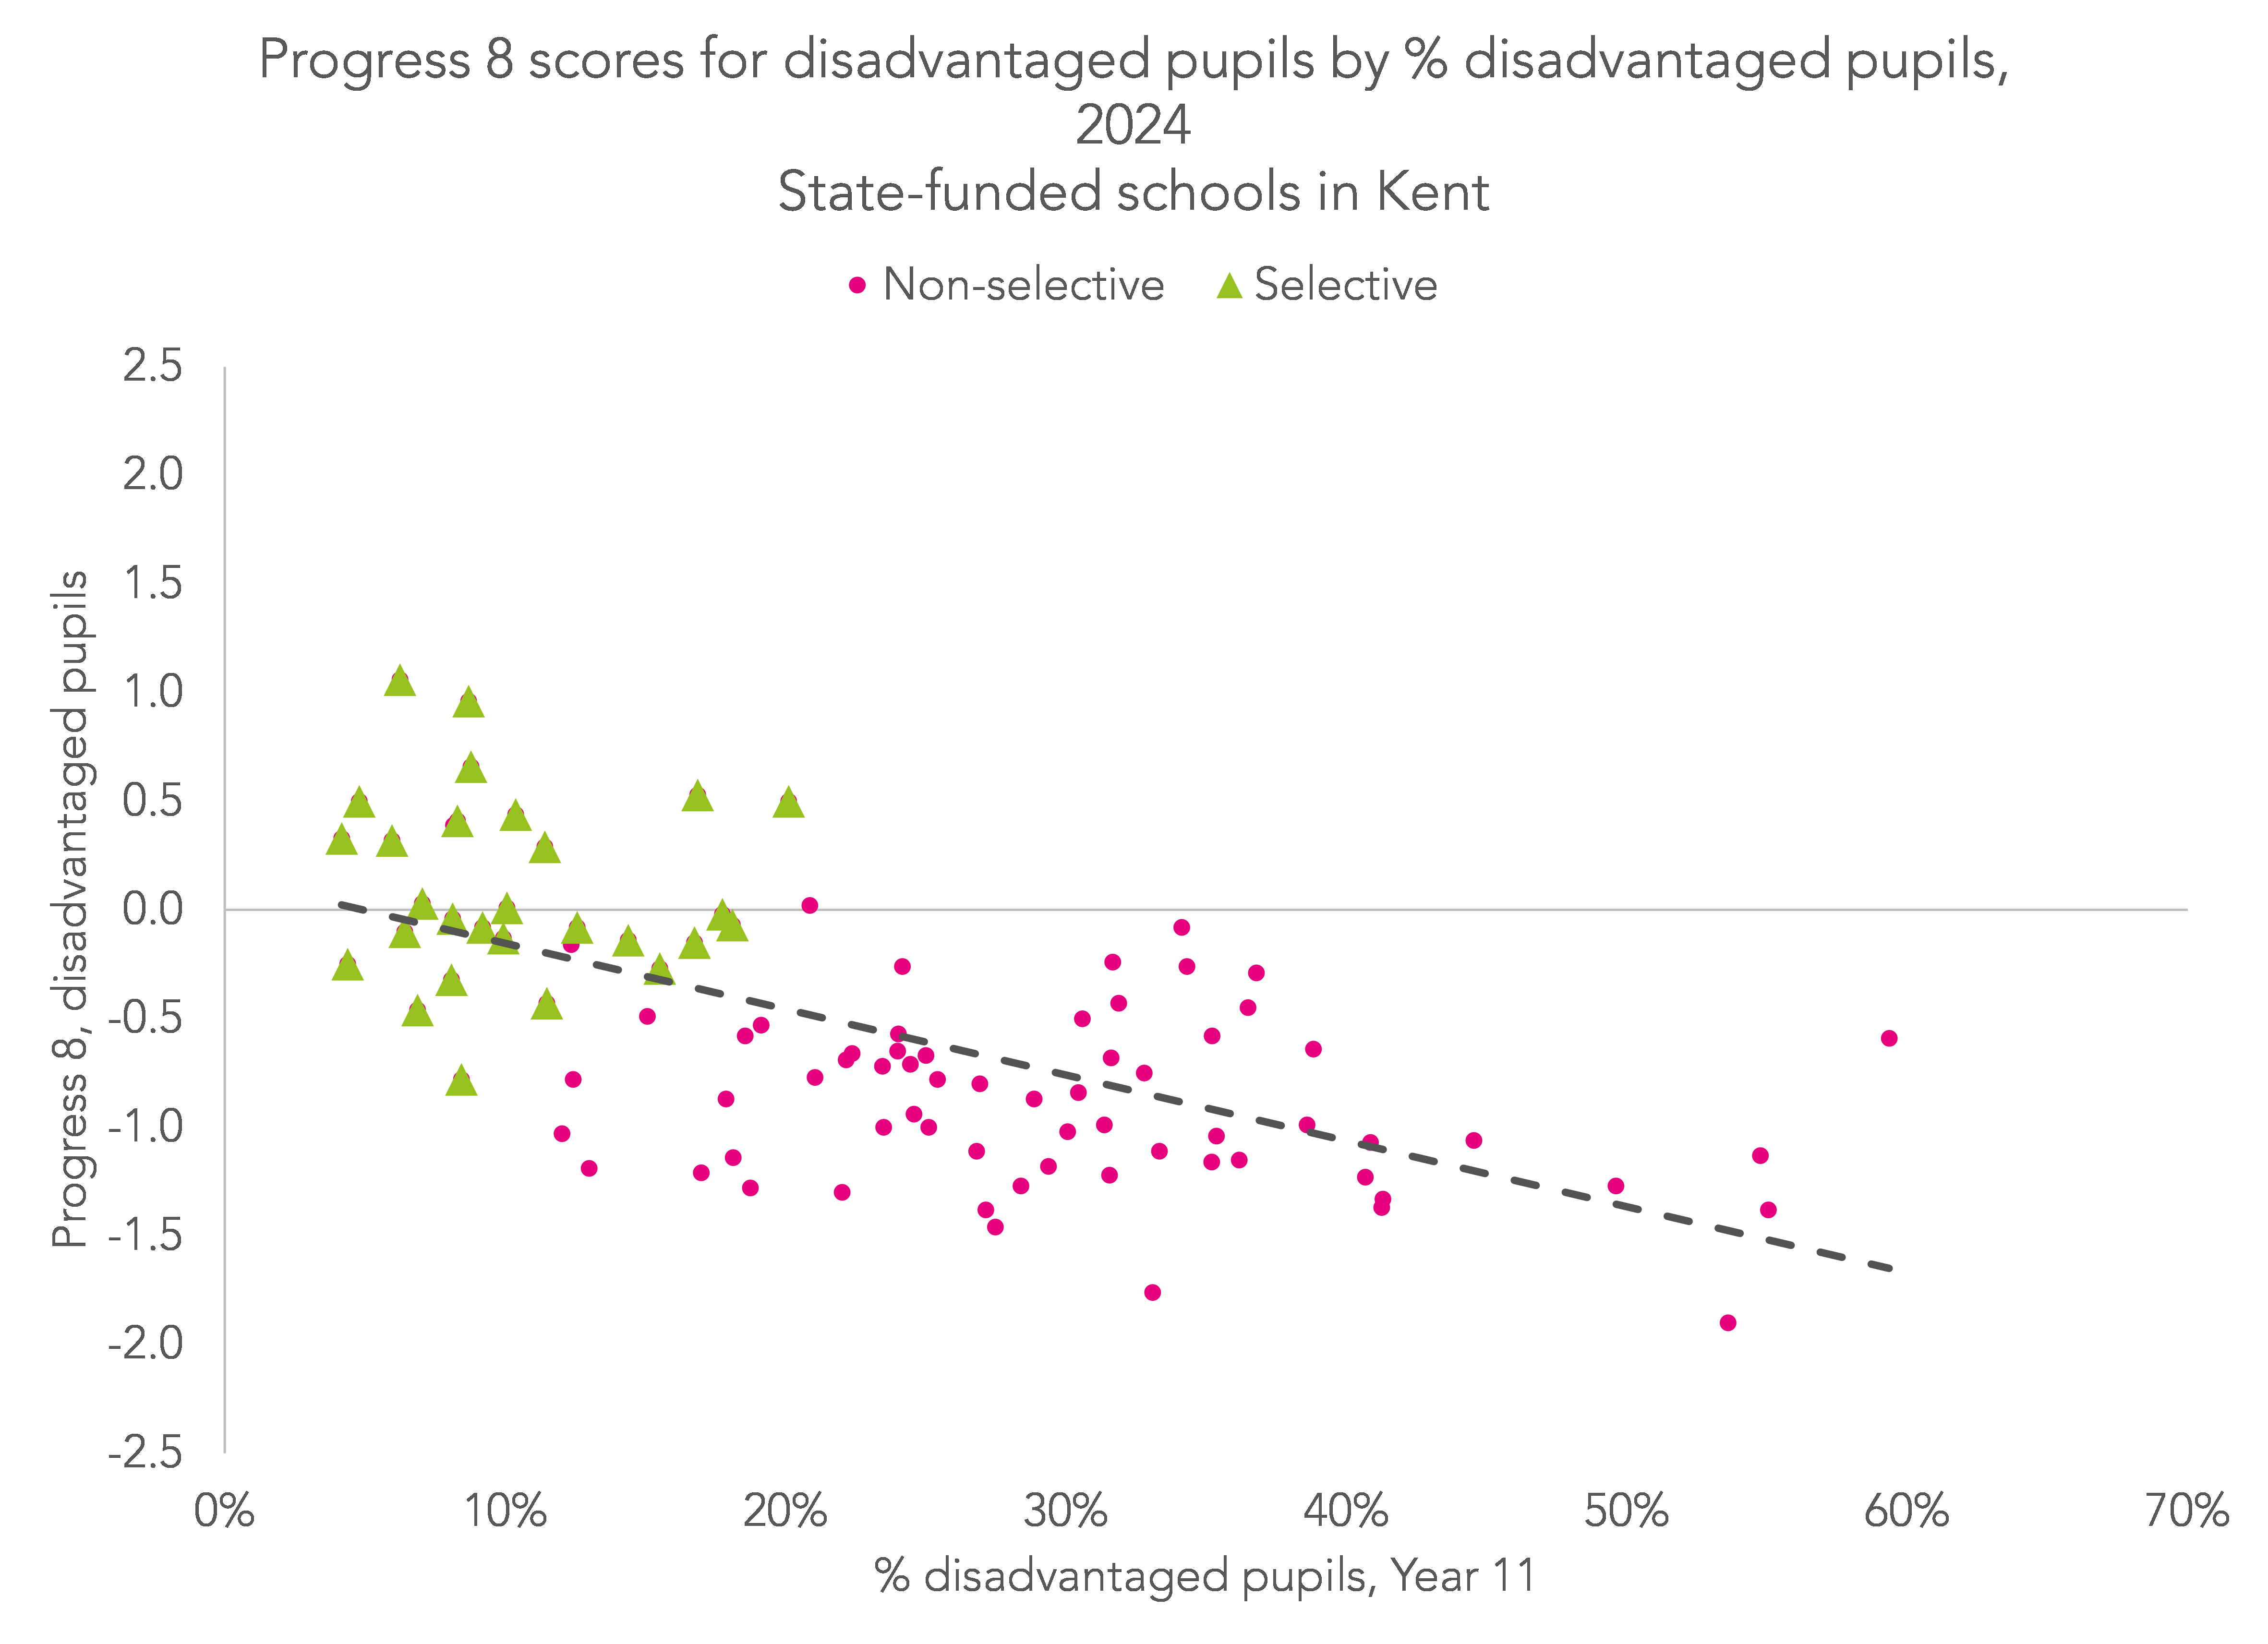
The selective schools tend to have much lower proportions of disadvantaged pupils but higher Progress 8 scores for those pupils.
This has an effect on the Progress 8 gap in Kent.
We can compare this with the national chart from part one.
In Kent, the within-school gap for 2024 was slightly smaller (0.59) than the national within-school gap (0.64) but the between-school gap was much wider (0.28) than the national between-school gap (0.06), resulting in a larger overall gap in Kent (0.87 compared to 0.7 nationally).
Summing up
The size of the Progress 8 gap between disadvantaged pupils and their peers varies between regions. Over the last three years, it has been smallest in London and the West Midlands and largest in the South East, with gaps in other regions being very similar.
The proportion of the gap that can be attributed to differences between schools also varies by region, tending to be lowest in the West Midlands and highest in the South East.
The differences between regions suggest that efforts to change the sorting of disadvantaged pupils into schools (e.g. by favouring disadvantaged pupils in admissions criteria) would have more impact in some regions than others.
What we haven’t done here is control for other factors known to be associated with attainment, e.g. ethnic background. It would be worthwhile seeing whether these broad factors still hold when using contextualised Progress 8 measures.
[mailing list prompt]

Thank you. Dave. I do think ethnicity analyis would be interesting, particularly if you look at subgoups like white British FSM eligible.
An interesting piece of analysis, thank you.
I wonder – have you analysed whether the proportion of disadvantaged students at a school affects Attainment 8 or Progress 8 for non-disadvantaged students? Also whether the gap is correlated with the proportion of disadvantaged students?