In this article, we look at the relationship between rates of absence and distance from home to school.
This is the first time we’ve looked at this relationship. Intuition would suggest that those who live further away are absent more often. But very often intuition can be wrong.
On this occasion, however, it probably isn’t.
Data
As with all our analysis of absence data, we use data for the whole 2022/23 academic year from schools that subscribe to FFT Attendance Tracker.
Around 2,700 secondary schools and 7,200 primary schools make use of this service. However, for this analysis we first limit the sample to schools where we have data on pupils’ home postcodes for at least 90% of pupils.
We measure the straight-line (as-the-crow-flies) distance between pupil postcode and the location of the school they attend. Then, for each year group at each school, we work out the 20% of pupils who live the furthest away and the 20% of pupils who live nearest to the school. We do this separately for disadvantaged pupils (those eligible for free school meals in the last 6 years) and non-disadvantaged pupils. Because of this, we also limit the sample to schools with at least 5 disadvantaged pupils and at least 5 non-disadvantaged pupils in a year group.
In total, we work with data from 4,600 primary schools and 1,900 secondary schools.
Secondary schools
First of all, we show absence rates for non-disadvantaged pupils.
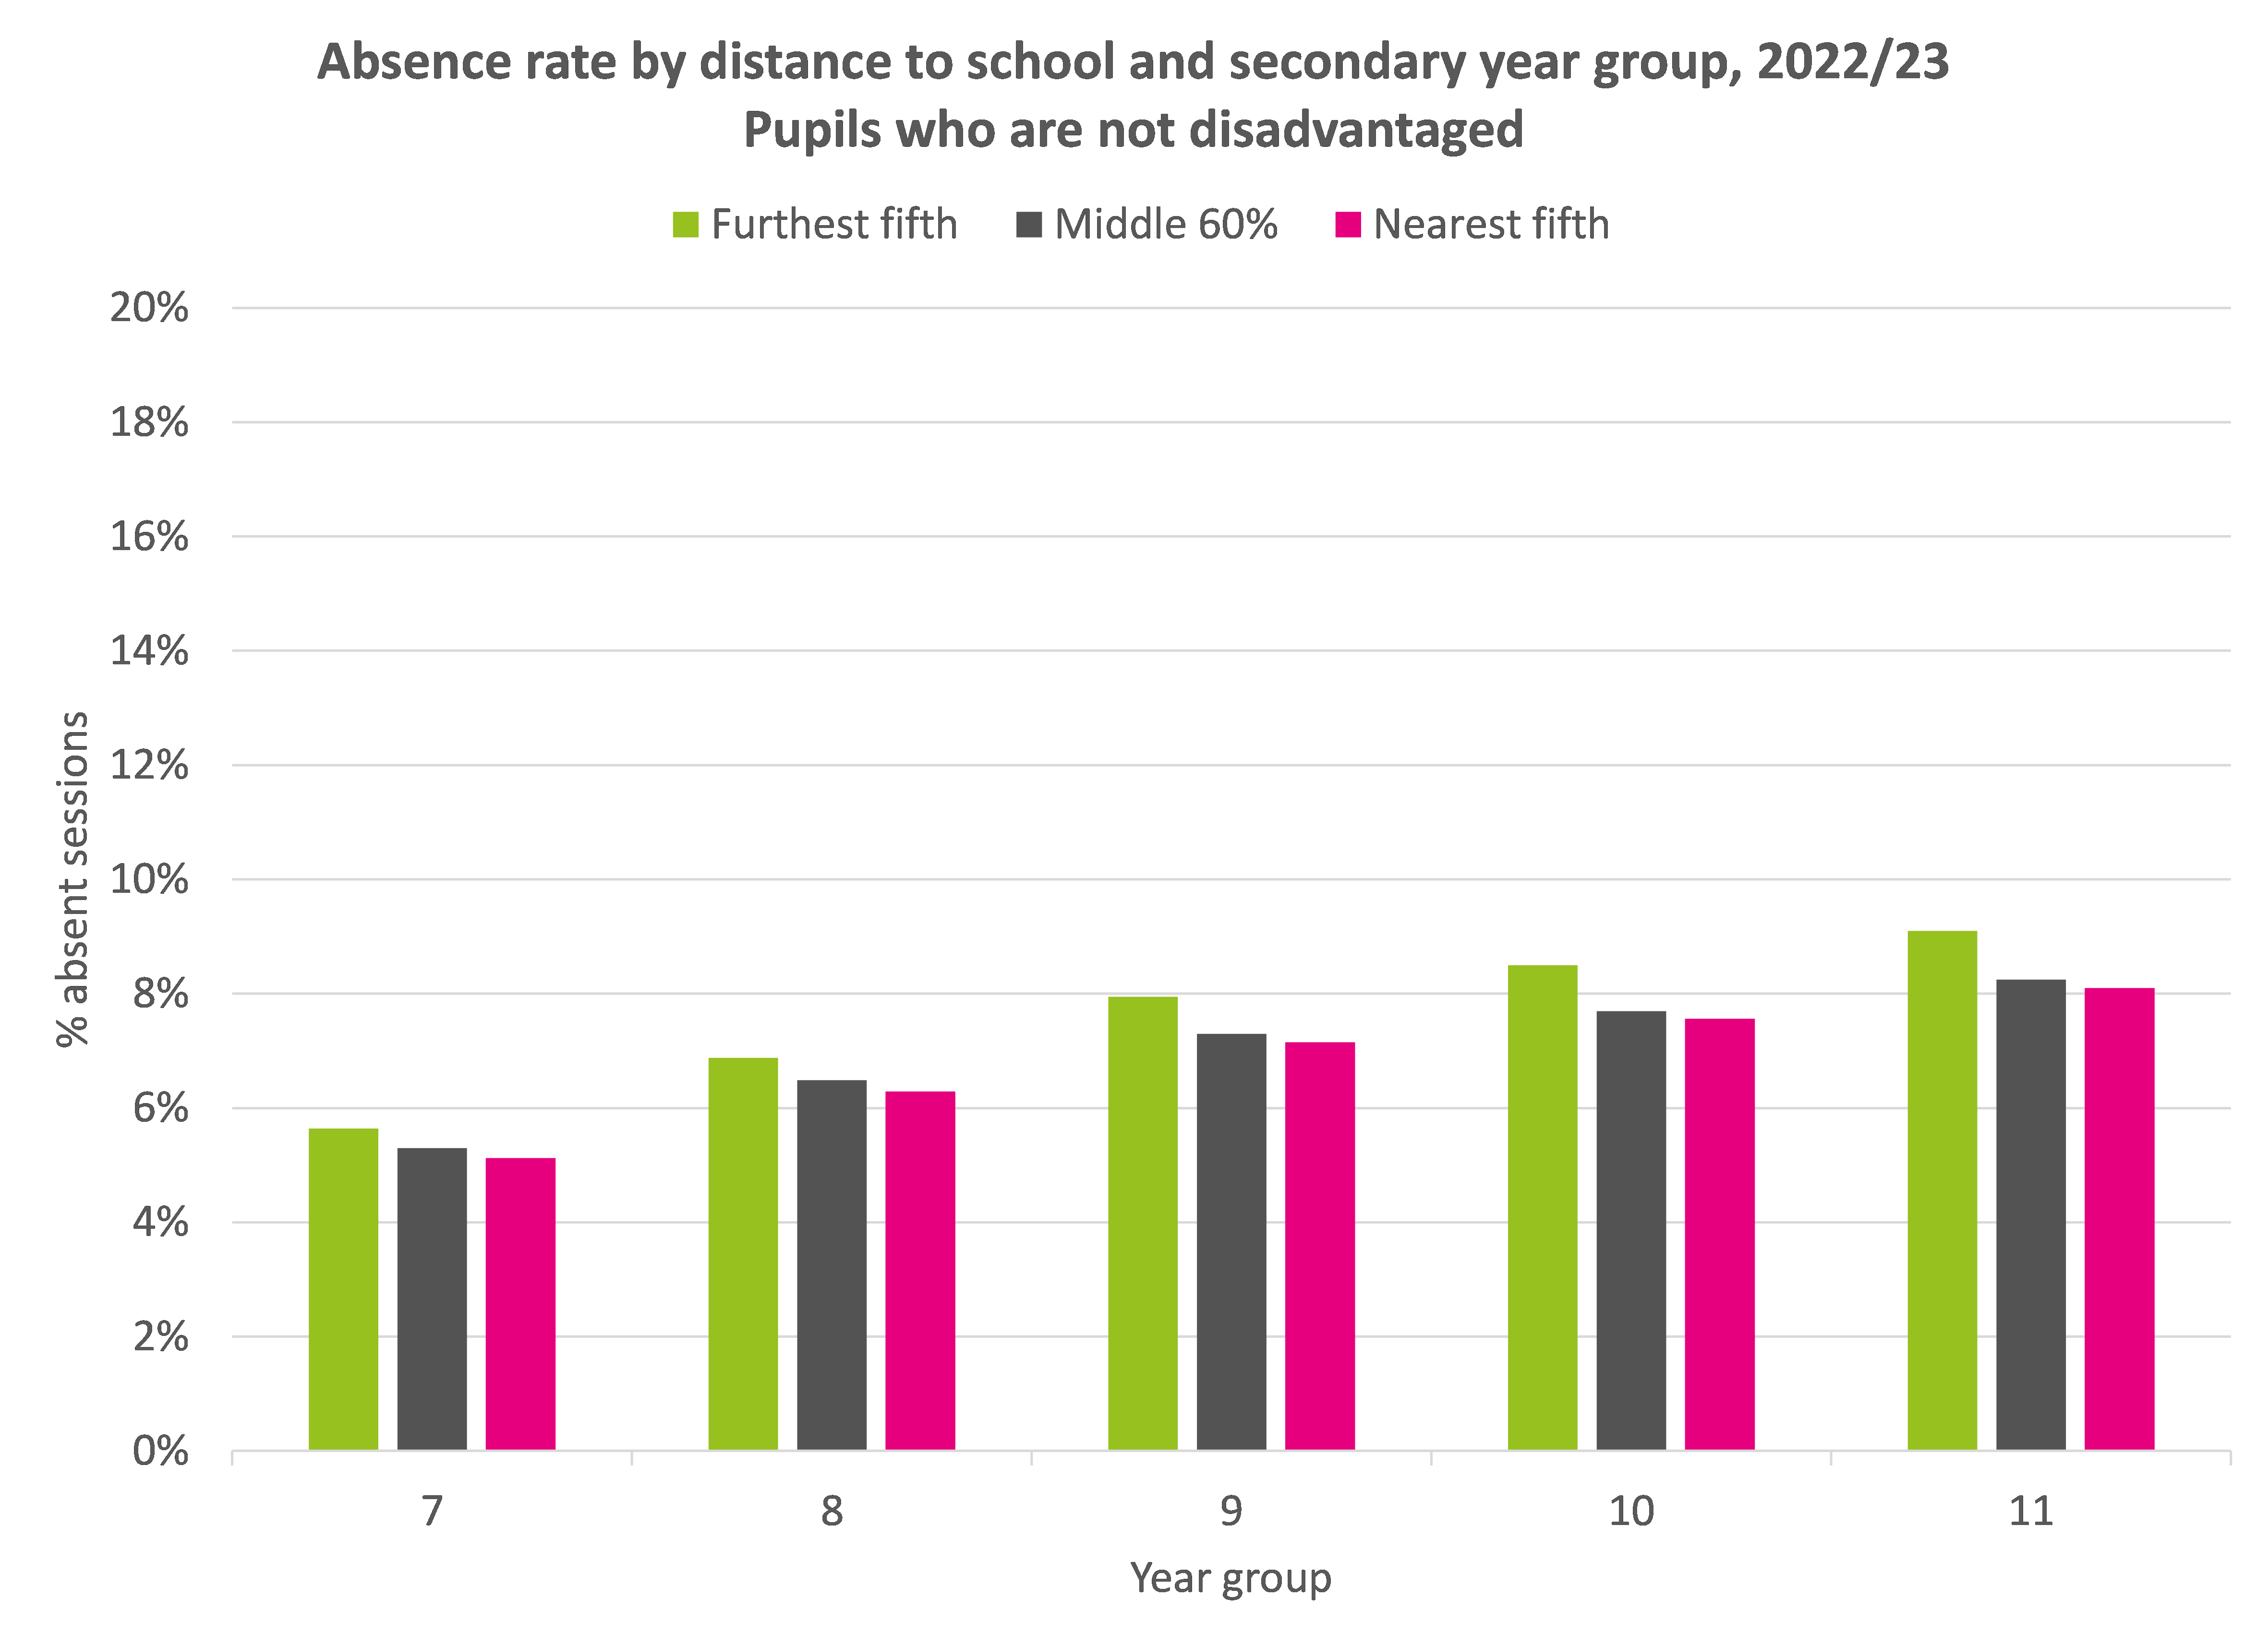
This shows that the group of pupils who live furthest away from their school are absent slightly more often and those who live nearest are absent slightly less often than all other pupils at their schools.
Next, we show a similar chart for disadvantaged pupils.

In general, absence rates for disadvantaged pupils are twice the rates of non-disadvantaged pupils. On top of that, differences in absence are even more pronounced between those who live furthest away and those who live nearest. This was particularly the case for pupils in Years 10 and 11.
Primary schools
The pattern for primary schools is similar to that of secondary schools albeit that rates of absence are lower.
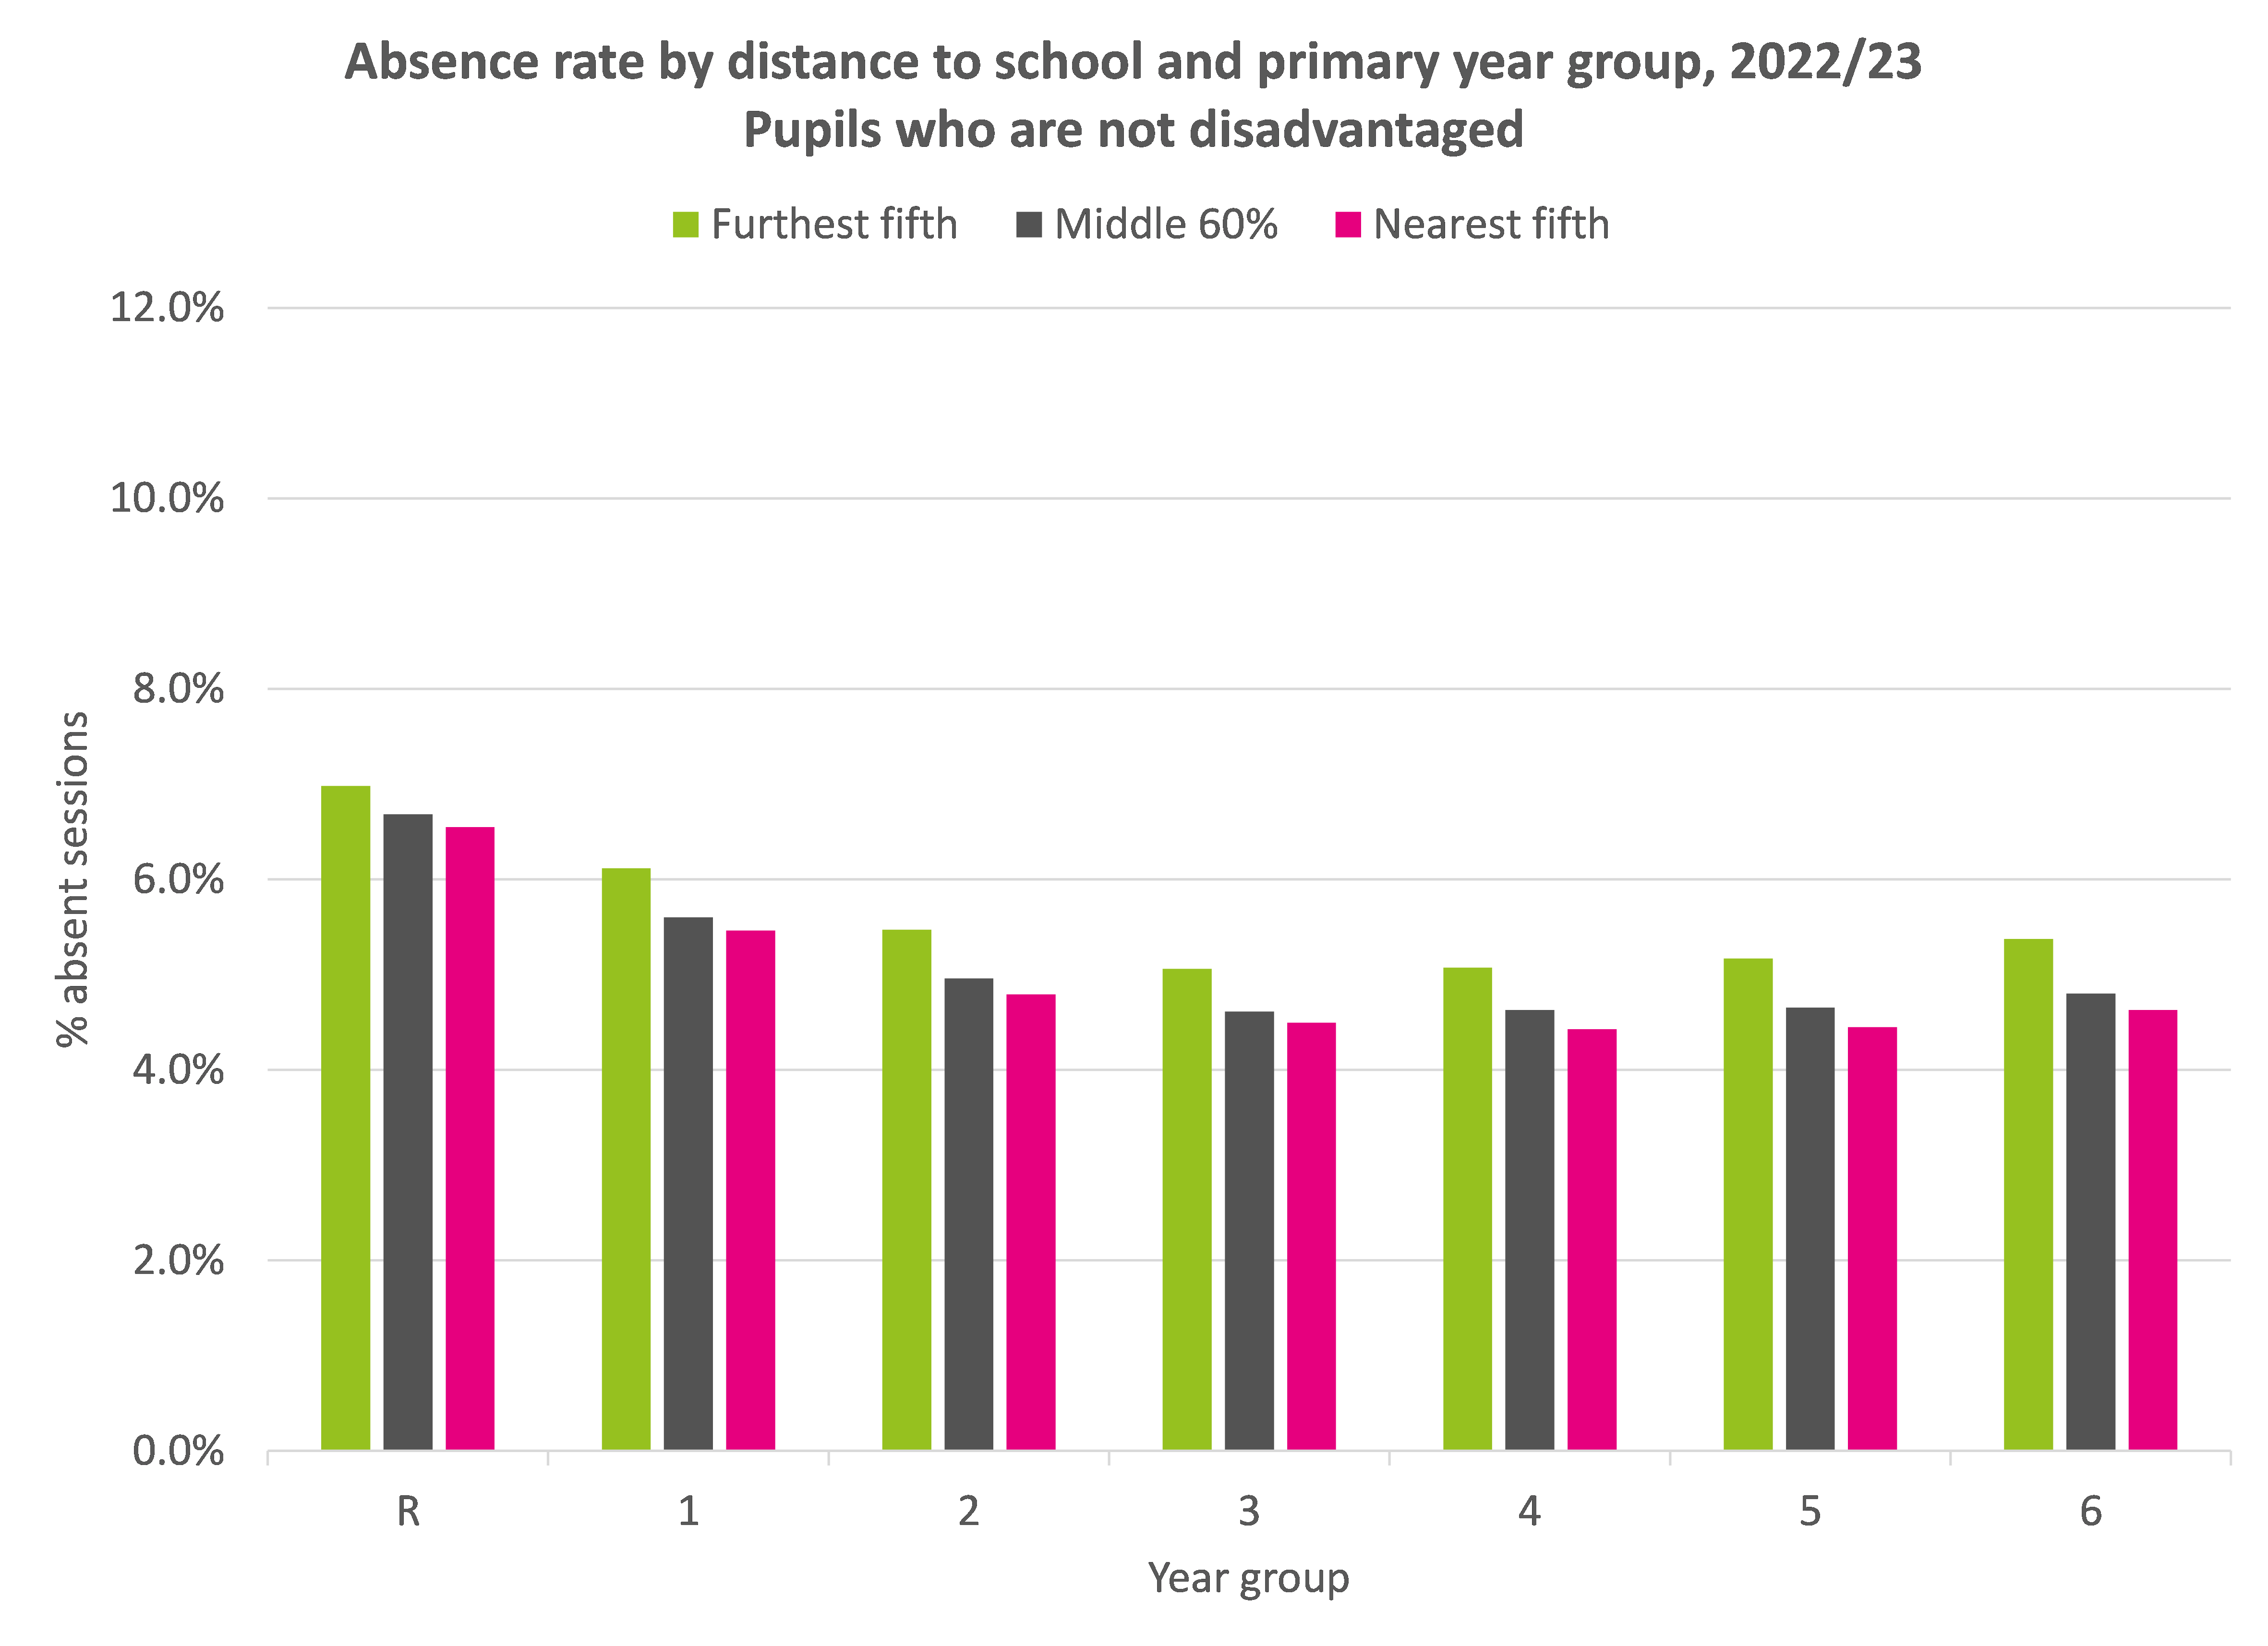
Among non-disadvantaged pupils, absence rates for pupils who live the furthest away from their school are around 0.5 to 0.8 percentage points higher than their schoolmates who live nearest to the school.
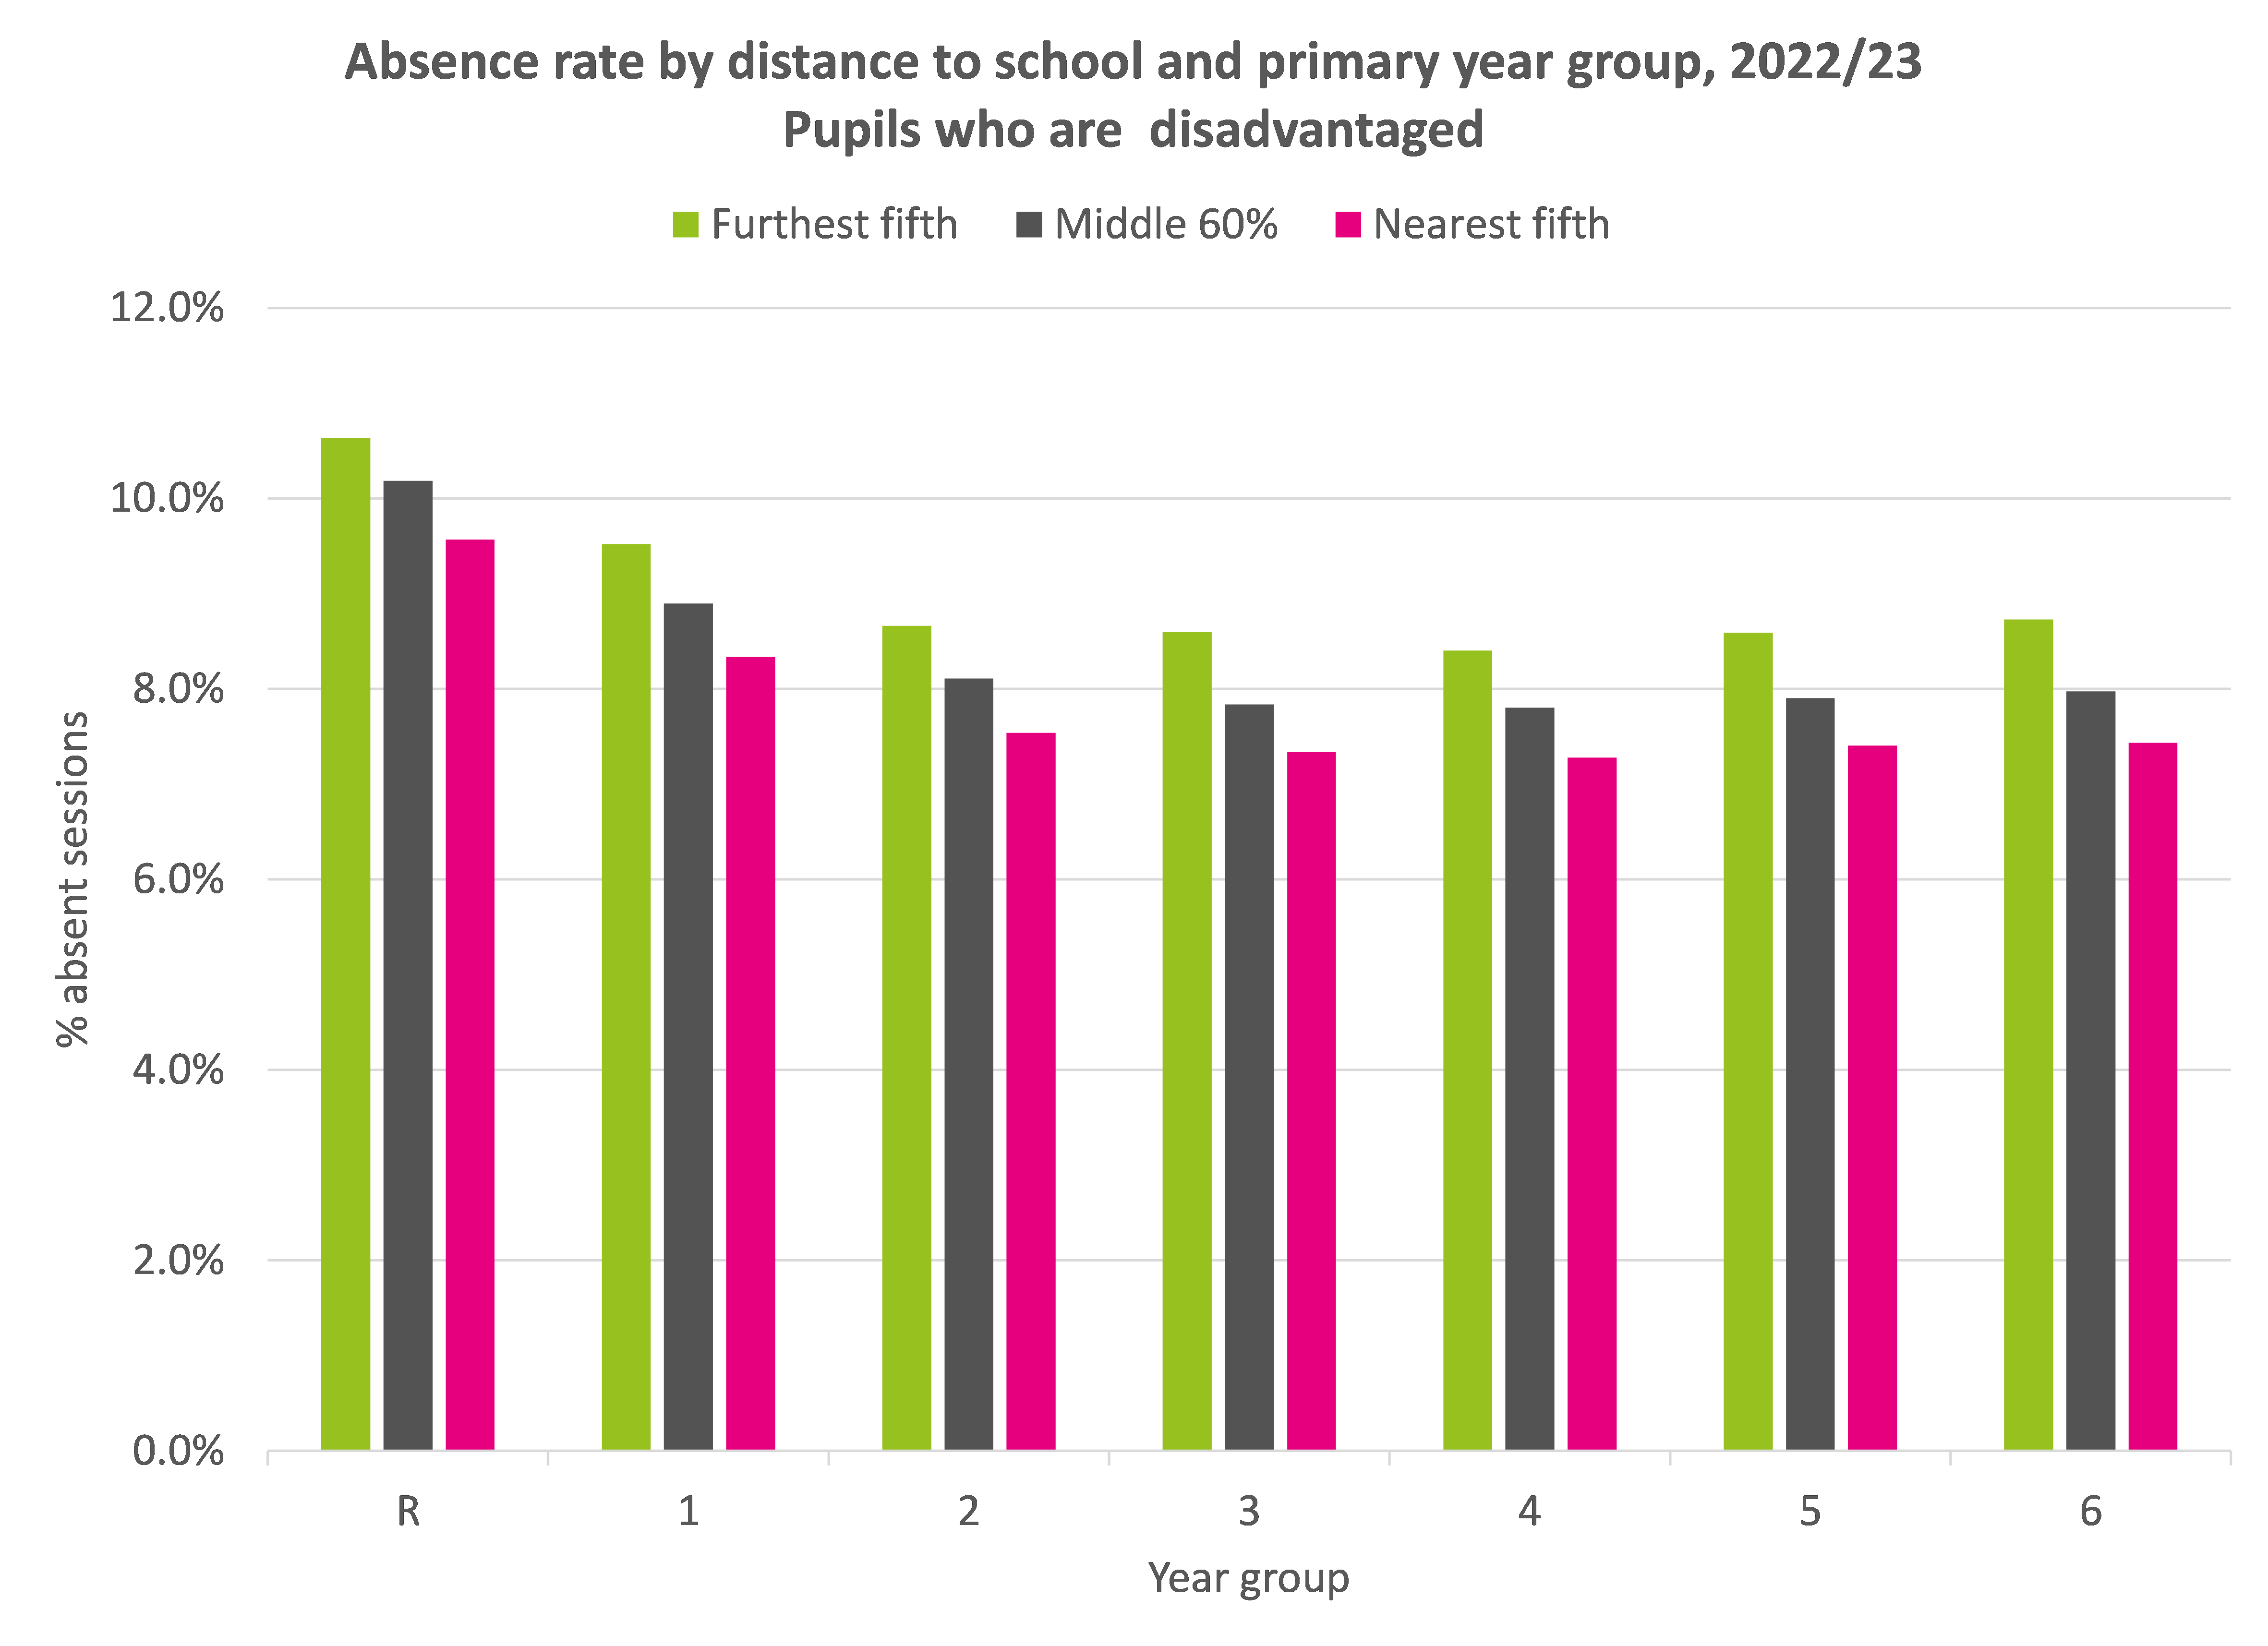
These differences are wider, around 1.0 to 1.3 percentage points, among disadvantaged pupils.
Summing up
This simple analysis we’ve presented here suggests that there is a relationship between absence and distance from school.
In the context of the current level of absence in schools, it can only be considered a relatively minor factor.
But pupils who live nearest to school tend to attend school slightly more often.
This could be due to families not being able to afford transport costs and/ or a lack of available transport options, particularly during bus/train strikes.
Further analysis based on pupils’ travel times to school (rather than straight line distance) may be instructive.
Want to stay up-to-date with the latest research from FFT Education Datalab? Sign up to Datalab’s mailing list to get notifications about new blogposts, or to receive the team’s half-termly newsletter.


Thank you for sharing these analyses. Could you perhaps tell me something about the definition used for ‘disadvantaged pupils’? With thanks.
Thanks David. It’s pupils eligible for free school meals in the last 6 years. I’ve updated the text to include this.
I would suggest there is a strong correlation with cost and quality of public transport. Outside of London and bigger cities it is pretty awful and expensive !
Food for thought there thank you. As well as the travel costs and logistical difficulties you mention I suspect factors like: rurality and “pupils changing schools for reasons other than a change of address” play a part. We know the latter group are more likely to face educational challenges.
I can imagine this data split by ward providing ammunition for transport devolution deals 🙂
Very interesting article. Students living in a rural area who travel to school by school bus tend to be absent more as they simply cannot get to school if they are late and miss the bus.
5 minutes late getting up for a city student can mean 5 minutes late arriving at school. For some rural students, that same 5 minutes costs the whole day
great article – I’ve been doing some research on homelessness and I would guess those living in cities and further away from school (especially primary school) have an increased chance of living in temporary accommodation (or living with family). This has a range of other challenges that are likely contributing to the higher absence
Hi Dave, this is super useful. I have seen data like this showing that distance and absence are linked. And I have seen data showing a link between absence and achievement. But are you aware of anything in the UK directly linking distance with achievement?
Thanks Mark- have been meaning to look into this but not quite got round to it yet