The Department for Education (DfE) have finally published their long-awaited Key Stage 4 statistical first release (SFR) today.
This includes provisional Progress 8 (P8) data for all state-funded schools for what could be the last time. It certainly won’t be published next year or the year after due to the cancellation of Key Stage 2 tests (the baseline measure for P8) during the pandemic in 2020 and 2021.
Much attention will no doubt be paid to the schools at the top of P8 rankings. However, these are exceptional cases and, for most schools, Progress 8 scores aren’t that different.
As well as P8, the SFR also provides data on other headline indicators and a range of breakdowns by different pupil characteristics that are not available when results are published on results day in the summer.
We have a dig around the (many) tables published by DfE to pick out a few interesting features that might otherwise get missed.
Attainment 8 scores have fallen
In our results day round-up of GCSE results we noted that there was little change in this year’s GCSE results but there was a decline in results in Level 1/ Level 2 awards in vocational and technical subjects.
This has led to a reduction of 0.4 points in Attainment 8 scores overall.
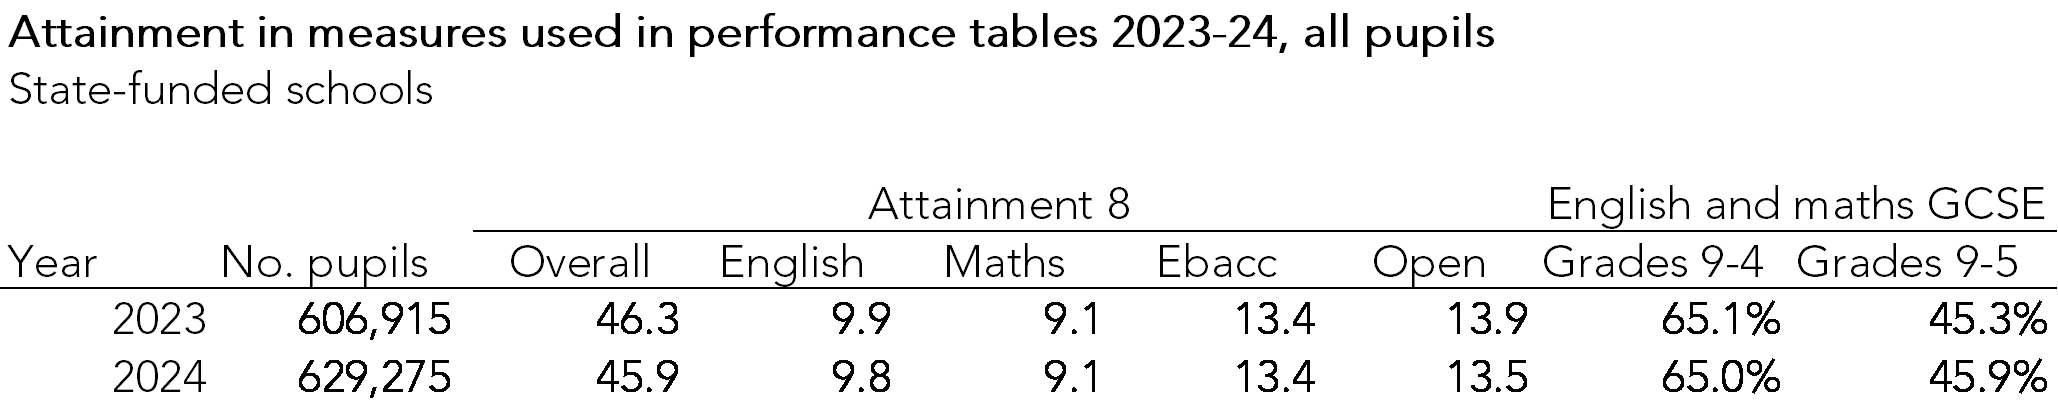
However, it can be seen that there has been no change in the maths and EBacc slots and a marginal drop in English scores. Most of the change in overall A8 is due to a fall in the score in the open slots, which are the only slots in which non-GCSE qualifications can be counted.
Our calculations suggest a small dip in non-GCSE qualifications entered this year, down from 0.68 GCSE equivalents per pupil in 2023 to 0.61 this year. But that’s a story for another day.
But changes vary across the prior attainment distribution
Although there was an overall fall of 0.4 points in Attainment 8, this varied across the distribution of prior (Key Stage 2) attainment.
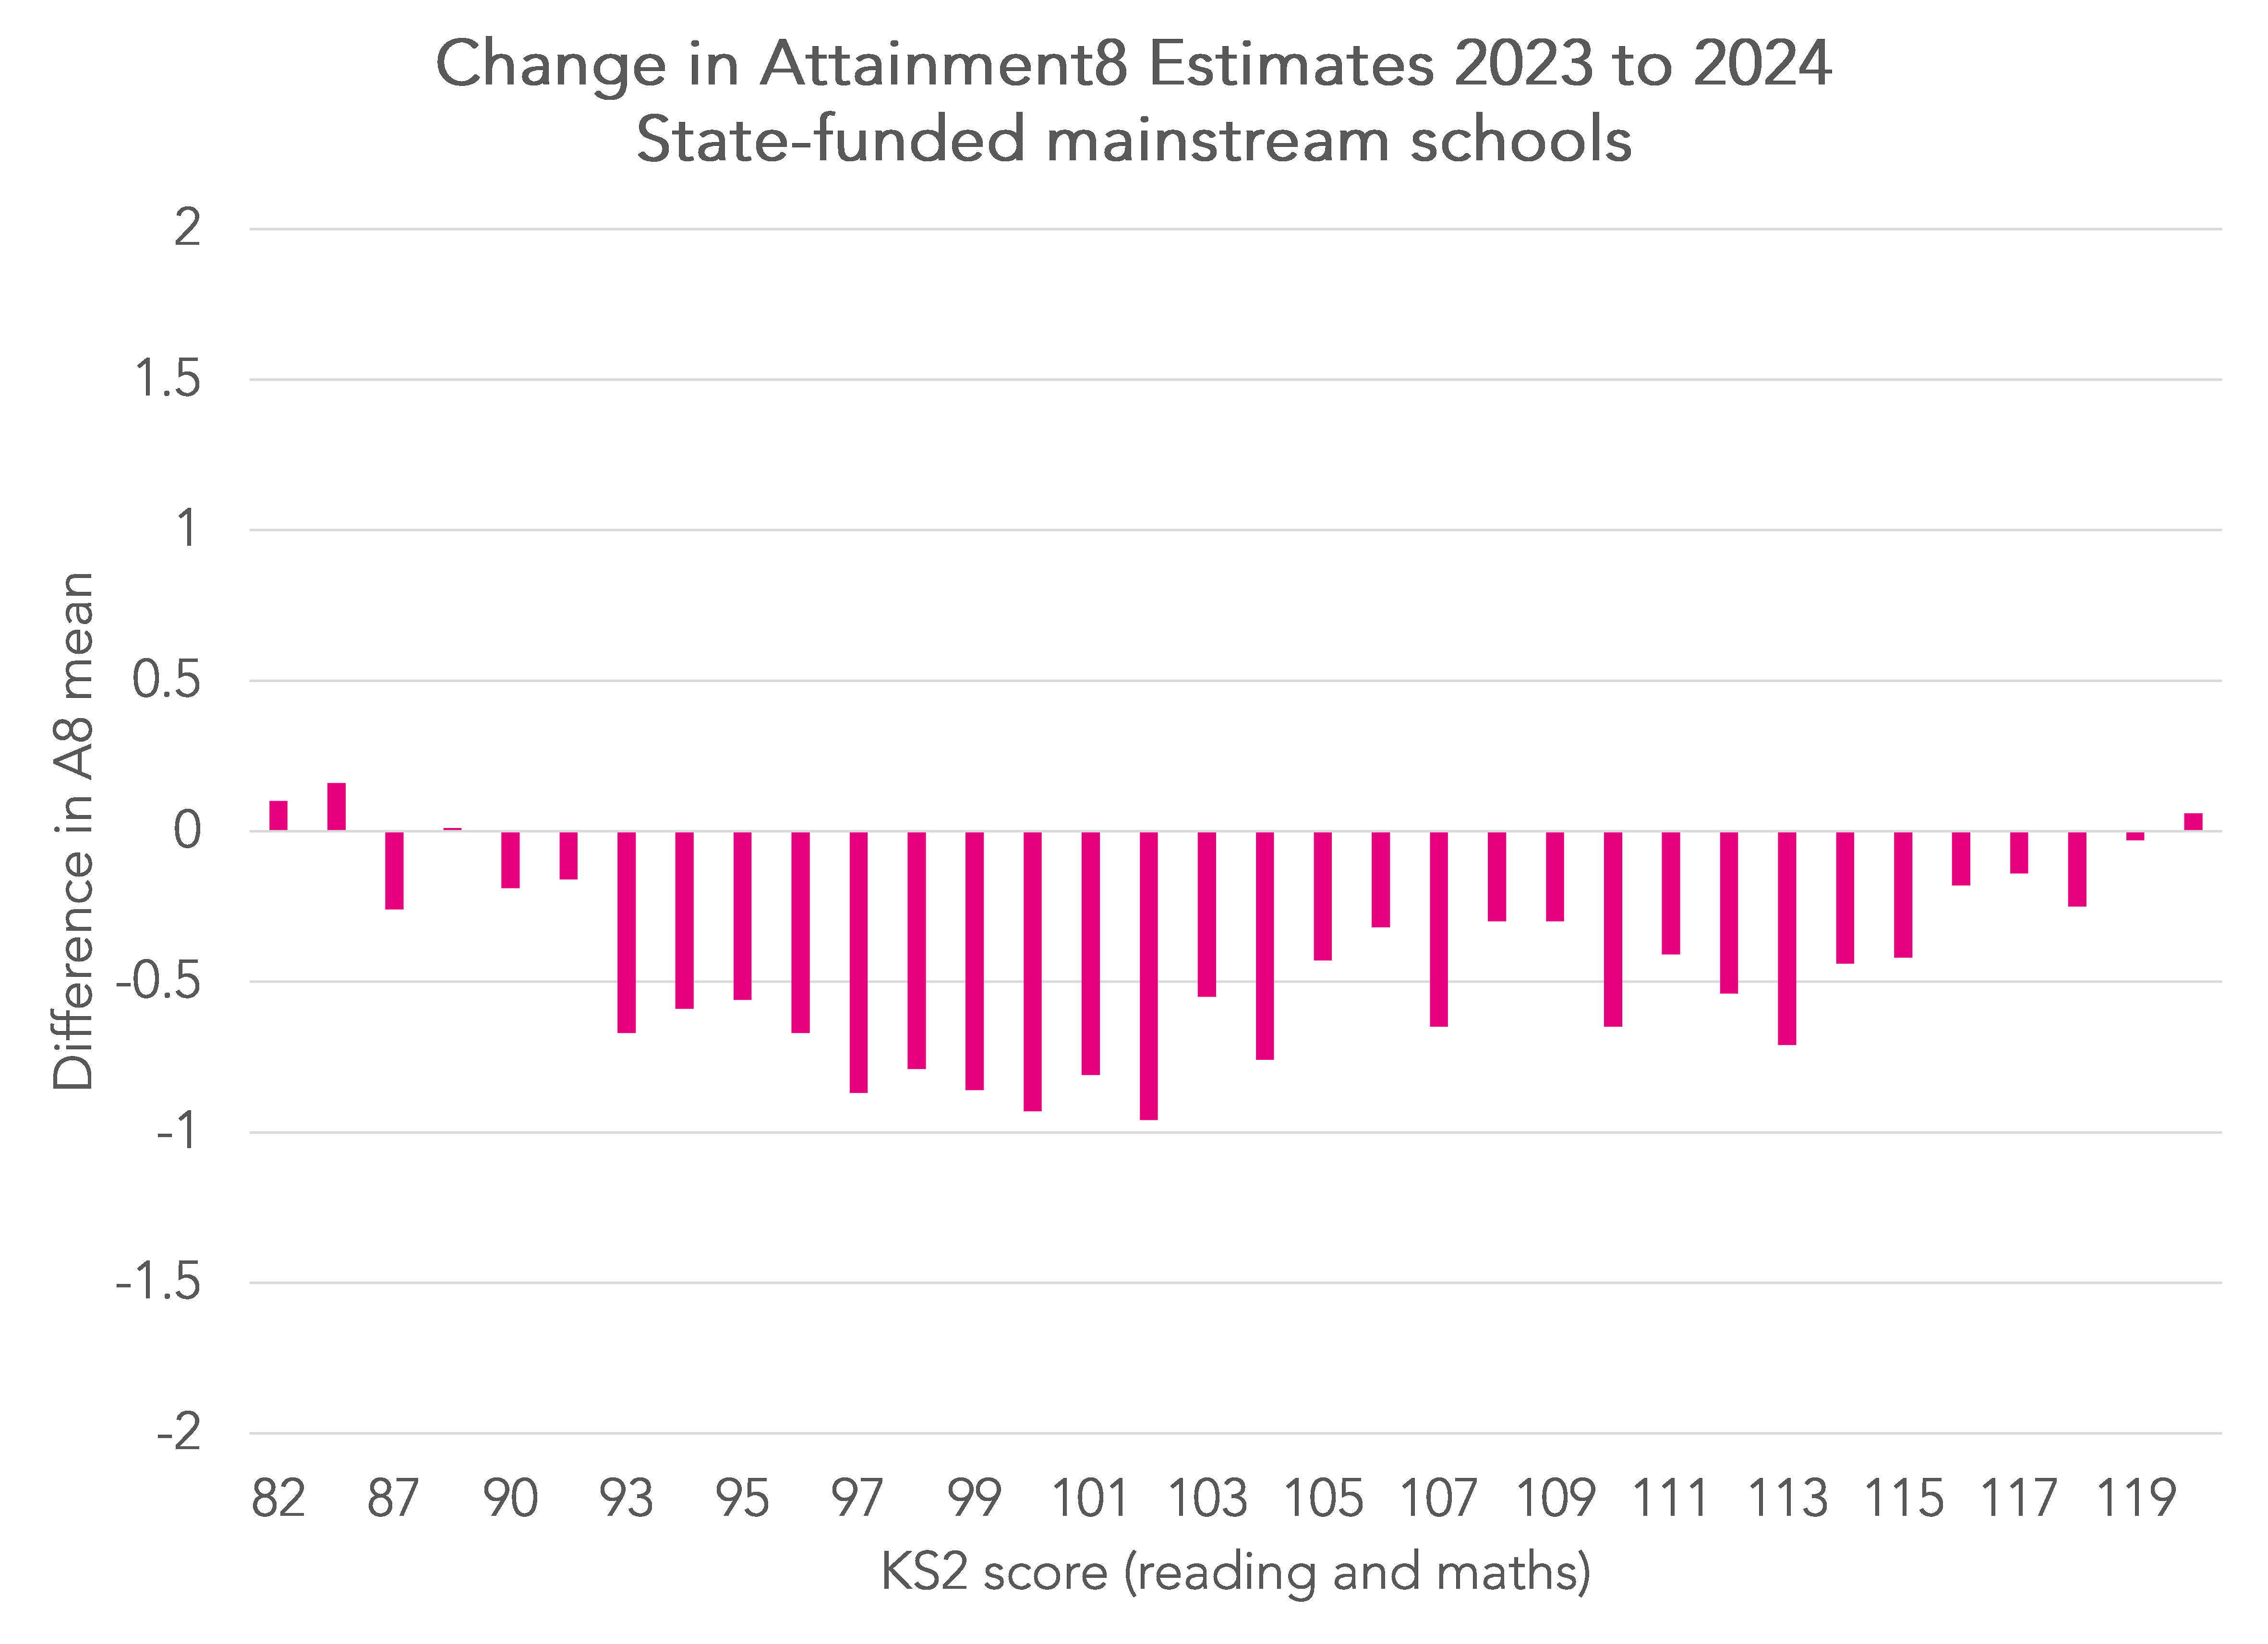
The largest changes were for pupils with a mean Key Stage 2 scaled score between 96.5 and 102, in other words pupils with slightly below average prior attainment.
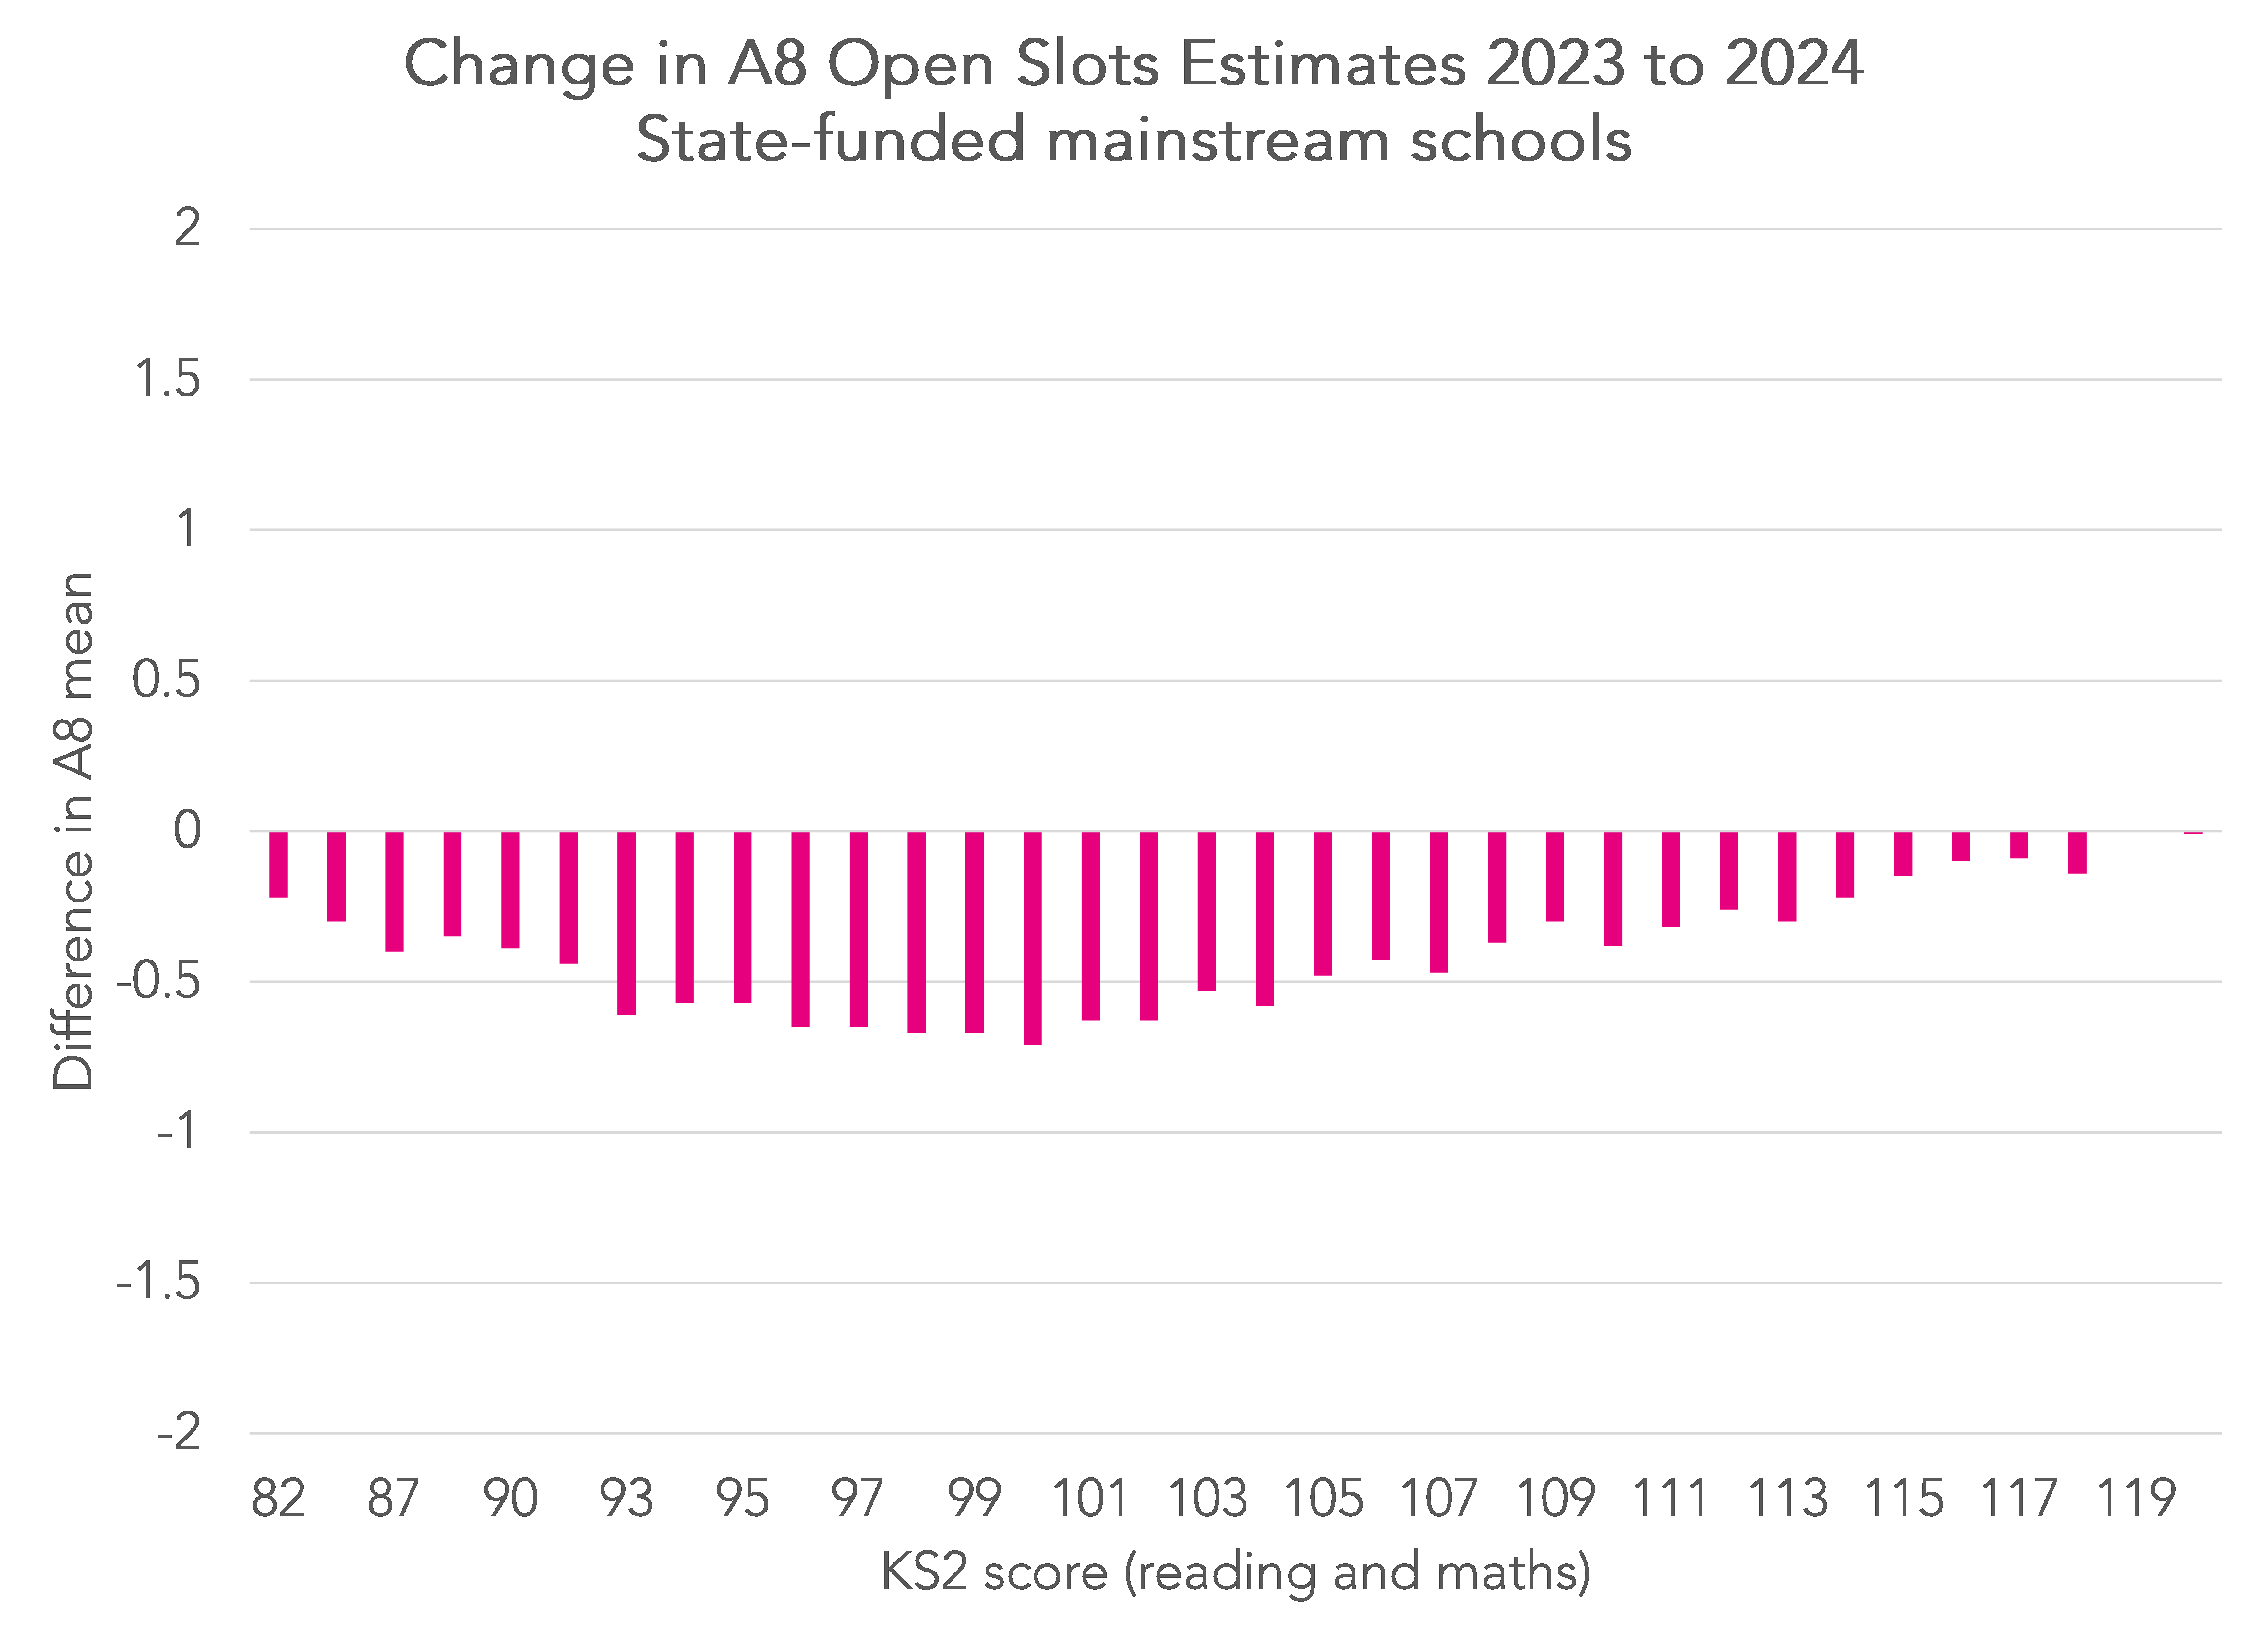
The picture changes only slightly if we plot the change in score for the open slots.
There was little change in Progress 8 for schools affected by RAAC
At the start of the 2023/24 school year, DfE told schools to shut buildings built with aerated concrete. By February, it had identified 234 schools affected by RAAC.
Of the 234, 95 were secondary schools or all-through schools. What were their P8 scores like?
In the chart below, we have plotted the P8 scores of the affected schools for 2023 and 2024. Any school whose score was unchanged would be plotted on the (broken) diagonal line.
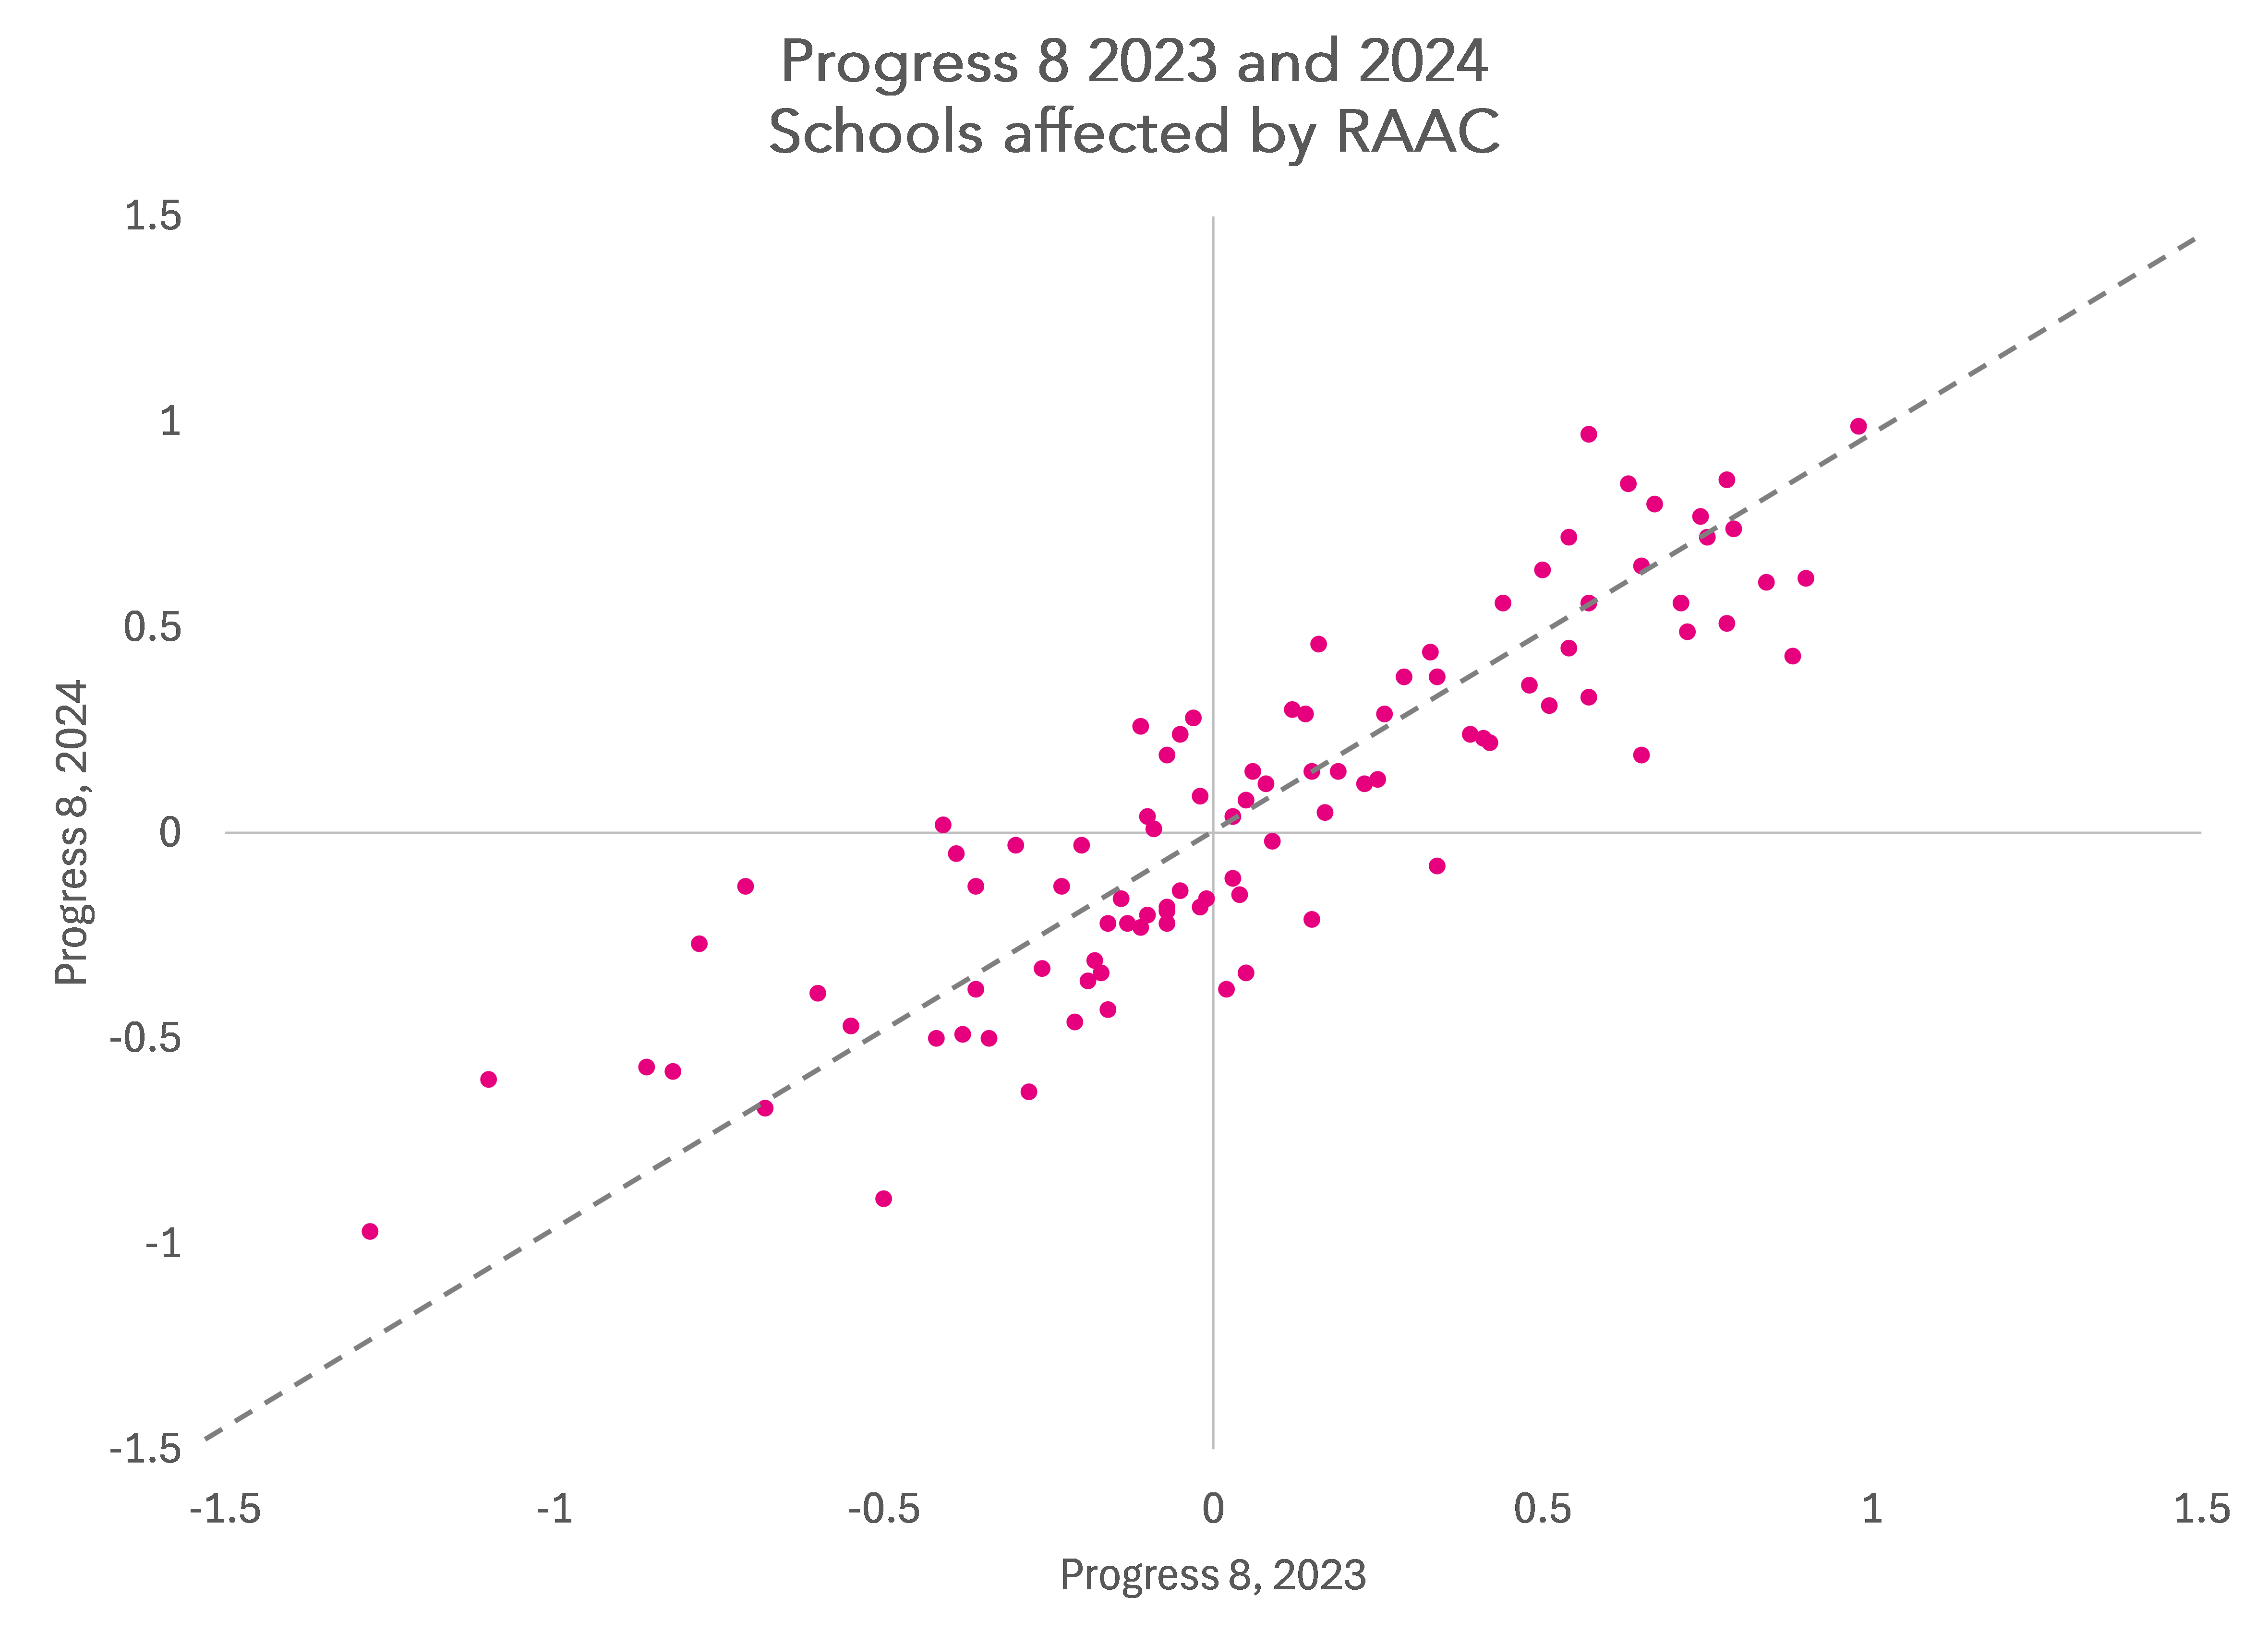
The picture is mixed: some schools achieved higher scores, some achieved lower scores. Typically, you find that schools with a low score one year will tend to improve the following year (and those with a high score will tend to see their score fall the following year).
Across all 95 schools, the average P8 score fell very slightly from 0.08 to 0.06.
Of course, we do not know just from this data how much disruption schools faced or how they responded to it. Perhaps Year 11 tended to be shielded from disruption more than other year groups.
Some schools will miss Progress 8
Much has been written over the years, including by ourselves, about how Progress 8 favours schools serving intakes with particular characteristics (and conversely how it works against others). For this reason we have long advocated for a contextualised Progress 8 measure to be published alongside Progress 8 and Attainment 8.
But it will become apparent next year that Progress 8 is far fairer to schools serving disadvantaged intakes than raw attainment measures that do not take account of prior attainment.
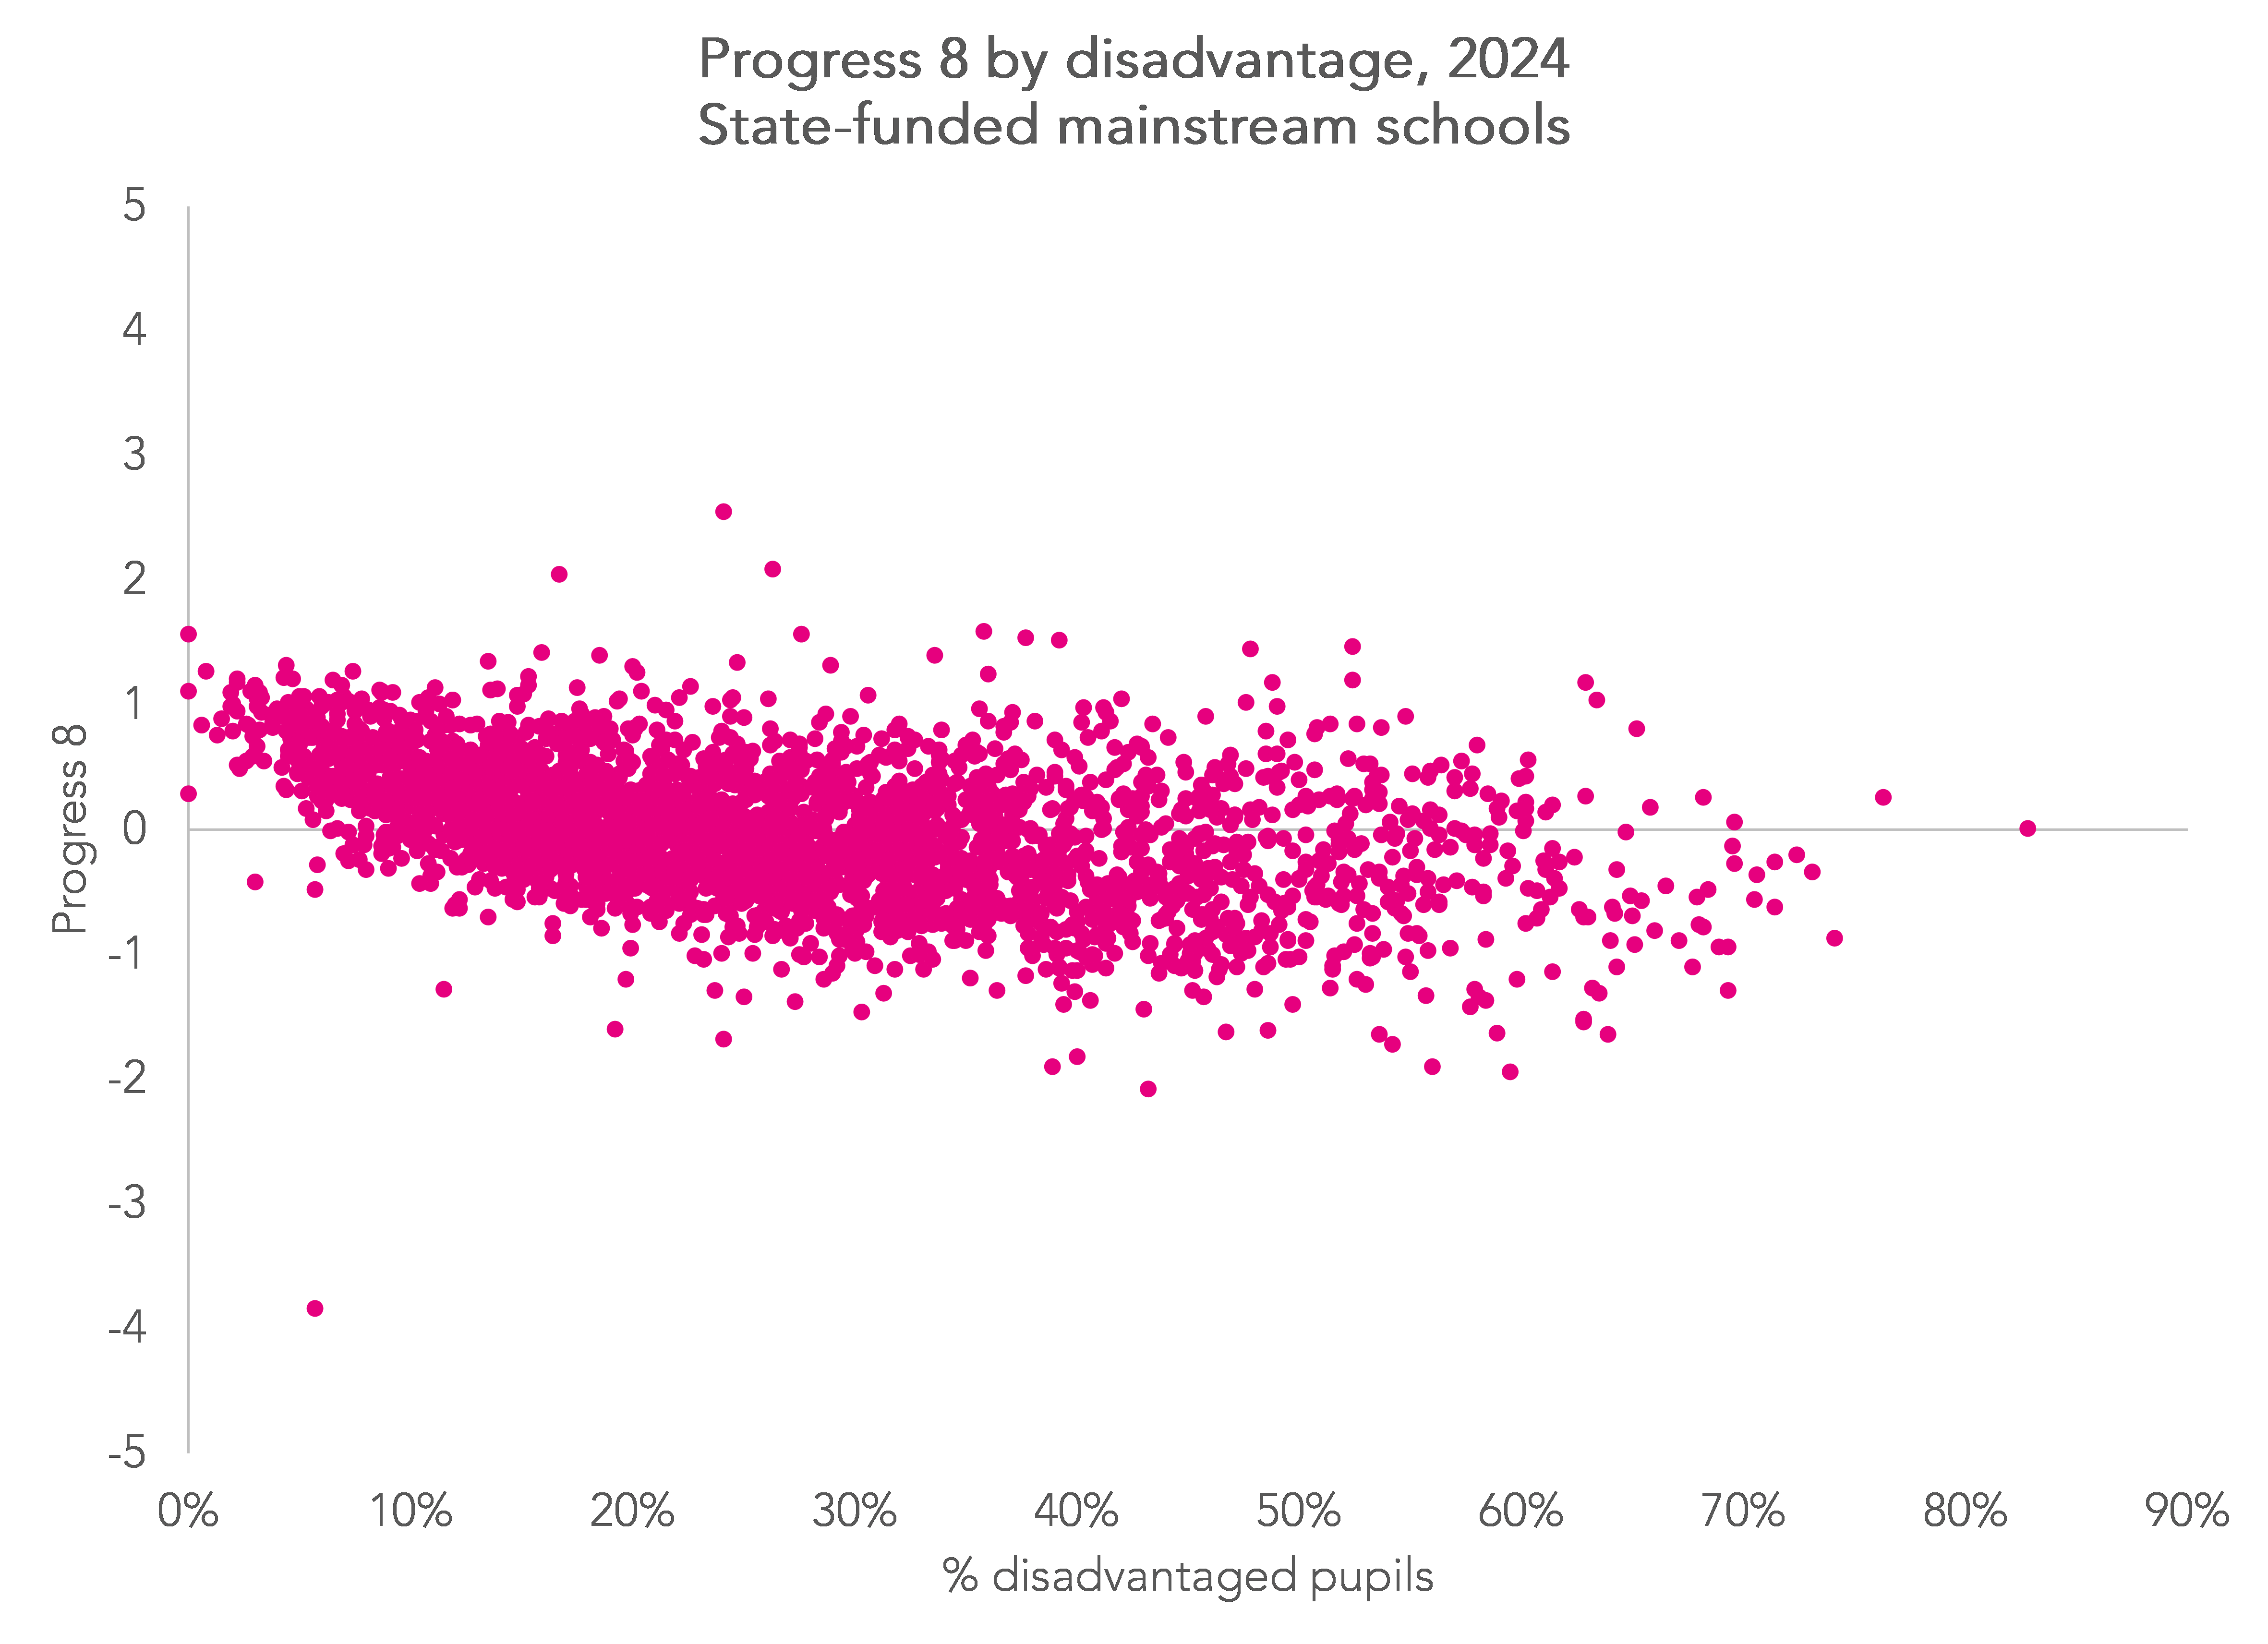
To back up this point, I first plot Progress 8 scores for 2024 by the percentage of disadvantaged Year 11 pupils in each school.
Now let’s look at the same chart for Attainment 8, the headline measure on which Progress 8 is based and which will still be published next year (as far as we know at the moment). To aid comparison with Progress 8 I have put Attainment 8 scores on the same scale as Progress 8 by centring schools’ scores around the national average (47.2) and then dividing by 10[1].
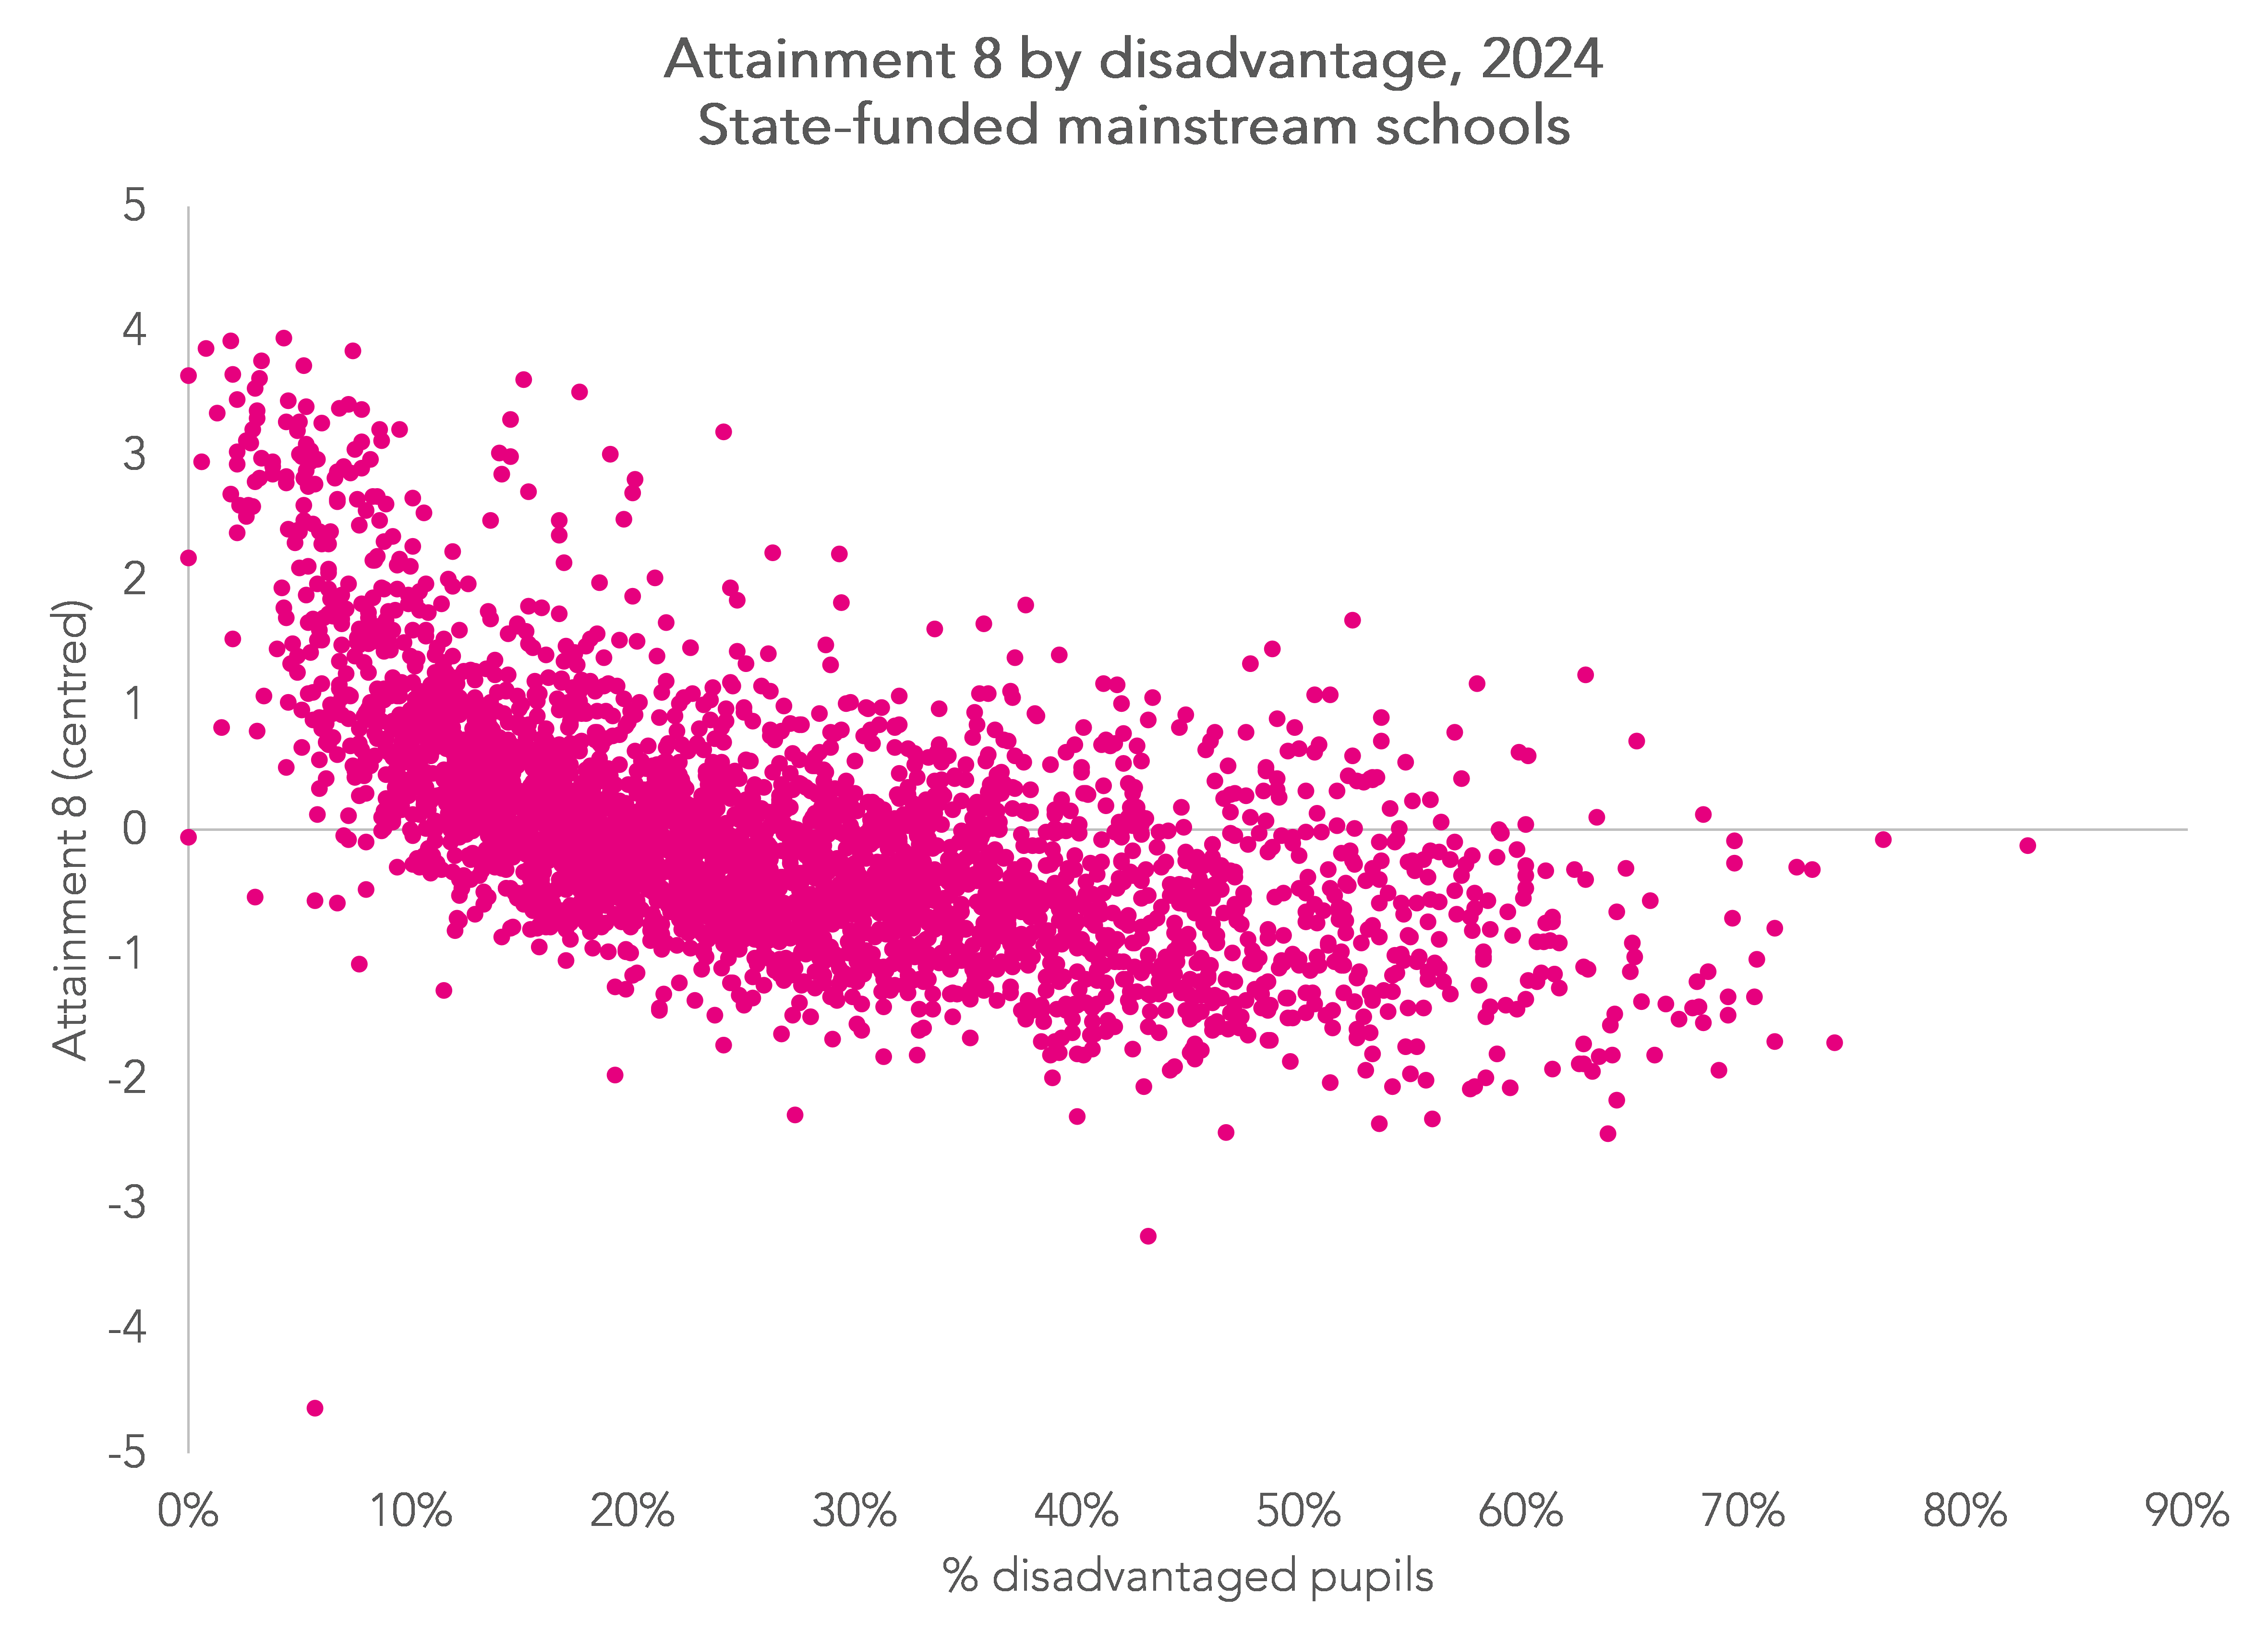
The picture is clear: the relationship between disadvantage and outcomes is far stronger for A8 than for P8. Put another way, the least disadvantaged schools will be even more likely to be ranked highly based on A8 compared to P8.
Far more 16-year-olds achieve the basics now than in the past
In the table at the top of the post we saw that 65% of pupils achieved grades 9-4 in English and maths, commonly shortened to “the basics”.
This means that 35% of pupils did not achieve this threshold and so will have to continue studying post-16 whichever subject(s) they do not have at least grade 4 in. We looked at this group in a bit more detail in an earlier post.
But we should recognise how far we have come. Go back to 1997, for example, and the figures were (more or less) reversed. Only a third of young people achieved A*-C (supposedly equivalent to 9-4) in both English[2] and maths, although we will have to leave to one side the (very interesting) question of whether standards now really are equivalent to standards then.
Over the next few years, the percentage of pupils without 9-4 grades in both English and maths will reduce as a result of resits. For the most recent cohort of 19 year olds (those who turned 19 in 2022/23), just 22% had not achieved 9-4 in both English and maths. However, this was the cohort whose GCSEs were cancelled in 2019/20 and so figures for this year’s Year 11 cohort are likely to be lower by the time they turn 19 in 2026/27.
Either way, the “forgotten third” will be reduced in number by age 19.
Has the disadvantage gap really narrowed?
Today’s SFR contains this chart showing how a small narrowing of the gap in attainment between disadvantaged pupils and their peers.
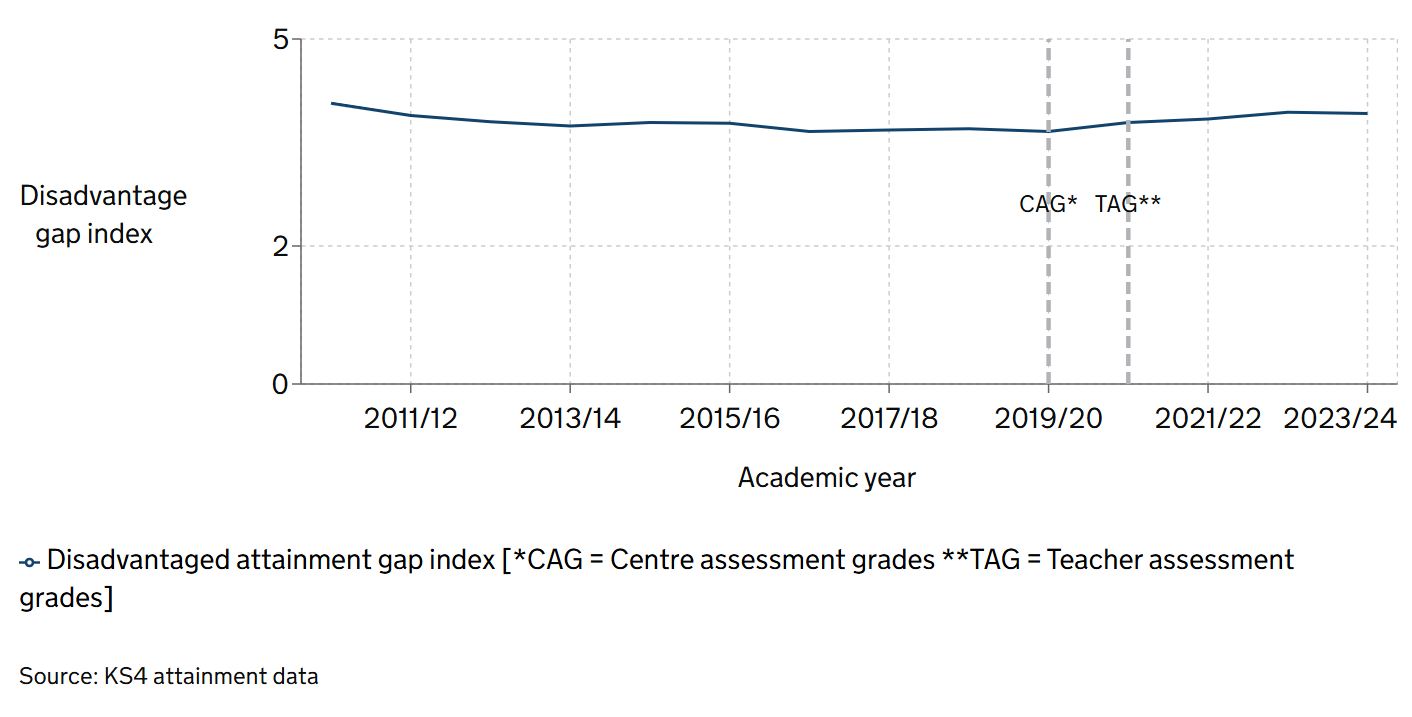
I’m not really sure how much faith we can have in this given changes in the composition of the disadvantaged group. Whereas in the past the disadvantaged group has consisted of pupils eligible for free school meals in the last six years, this years it consists of pupils eligible in the last seven years as a result of transitional protections brought in as a result of the rollout of Universal Credit.
- This is because there are 10 slots in Attainment 8, 2 for English, 2 for maths, 3 for EBacc subjects and 3 for other (open) subjects.
- Although it appears that this was based on English language only, rather than the current convention which is the best grade of language and literature
Want to stay up-to-date with the latest research from FFT Education Datalab? Sign up to Datalab’s mailing list to get notifications about new blogposts, or to receive the team’s half-termly newsletter.


Leave A Comment