Before half-term, the Secretary of State for Education announced an “ambition” for 90% of Year 1 pupils to meet the expected standard.
The Phonics Screening Check
The Phonics Screening Check (PSC) is a statutory assessment taken in Year 1 consisting of 40 words, including pseudo (nonsense) words, that pupils have to read out. Teachers administer the test to each pupil individually and mark them according to whether they decode each work correctly.
Those that answer 32 or more words correctly are said to have achieved the expected standard.
As national data shows , 80% of pupils nationally achieved the standard in 2025. This is slightly below the pre-pandemic standard of 82%. The check was first introduced in 2011/12 and there was rapid growth in the percentage of pupils reaching the expected standard, which had started to flatline prior to the pandemic.
Pupils who do not achieve the expected standard in Year 1 are expected to take the check again in Year 2.
Data
We use national phonics data for 2024 from National Pupil Database (NPD). This is a simple dataset which contains the outcome (achieved/ not achieved) and the number of correct responses (marks) for each pupil.
We supplement this dataset with data from the Spring Census (disadvantage, first language, special educational needs).
Separately, we also use data from our Reading Assessment Programme, which consists of words read aloud by 7,700 pupils in Year 1 in 325 schools in the 2024/25 Spring term.
Characteristics
In the first chart, we show how close different groups of pupils are to the 90% benchmark.
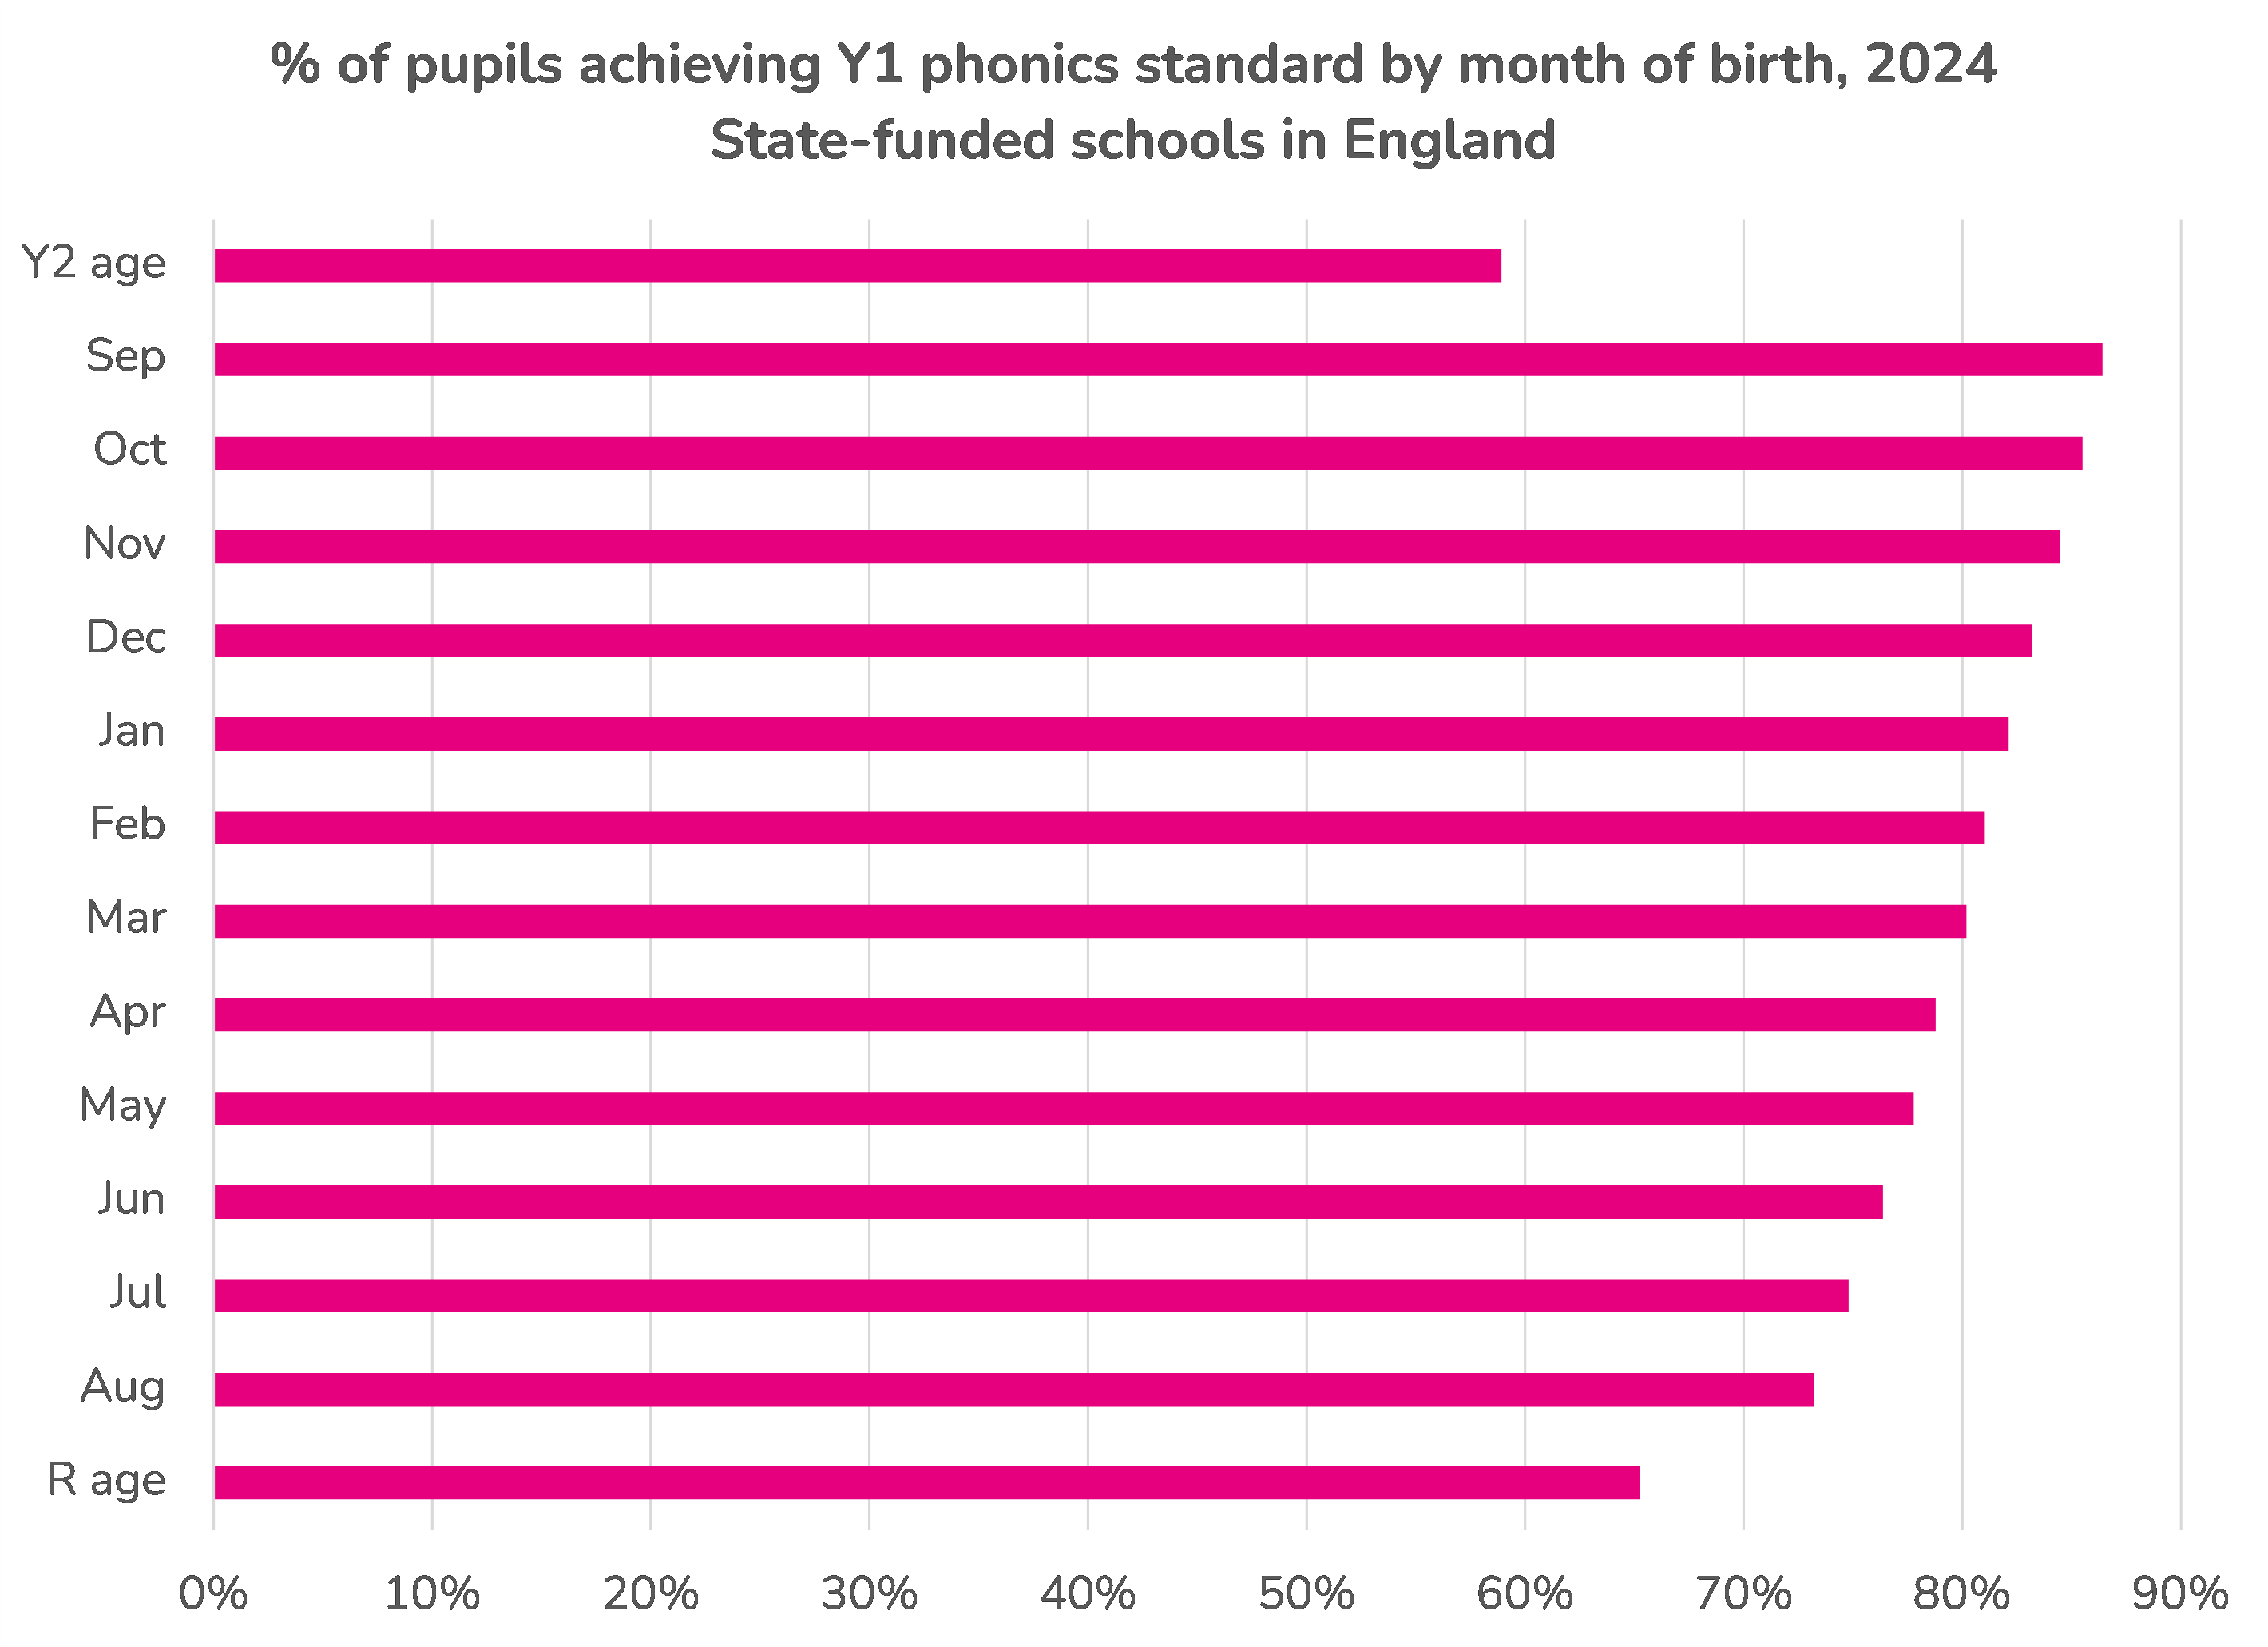
As would be expected at this young age, older pupils are more likely to achieve the standard. 86% of September born pupils of Year 1 age did so, compared to 73% of August born pupils of Year 1 age.
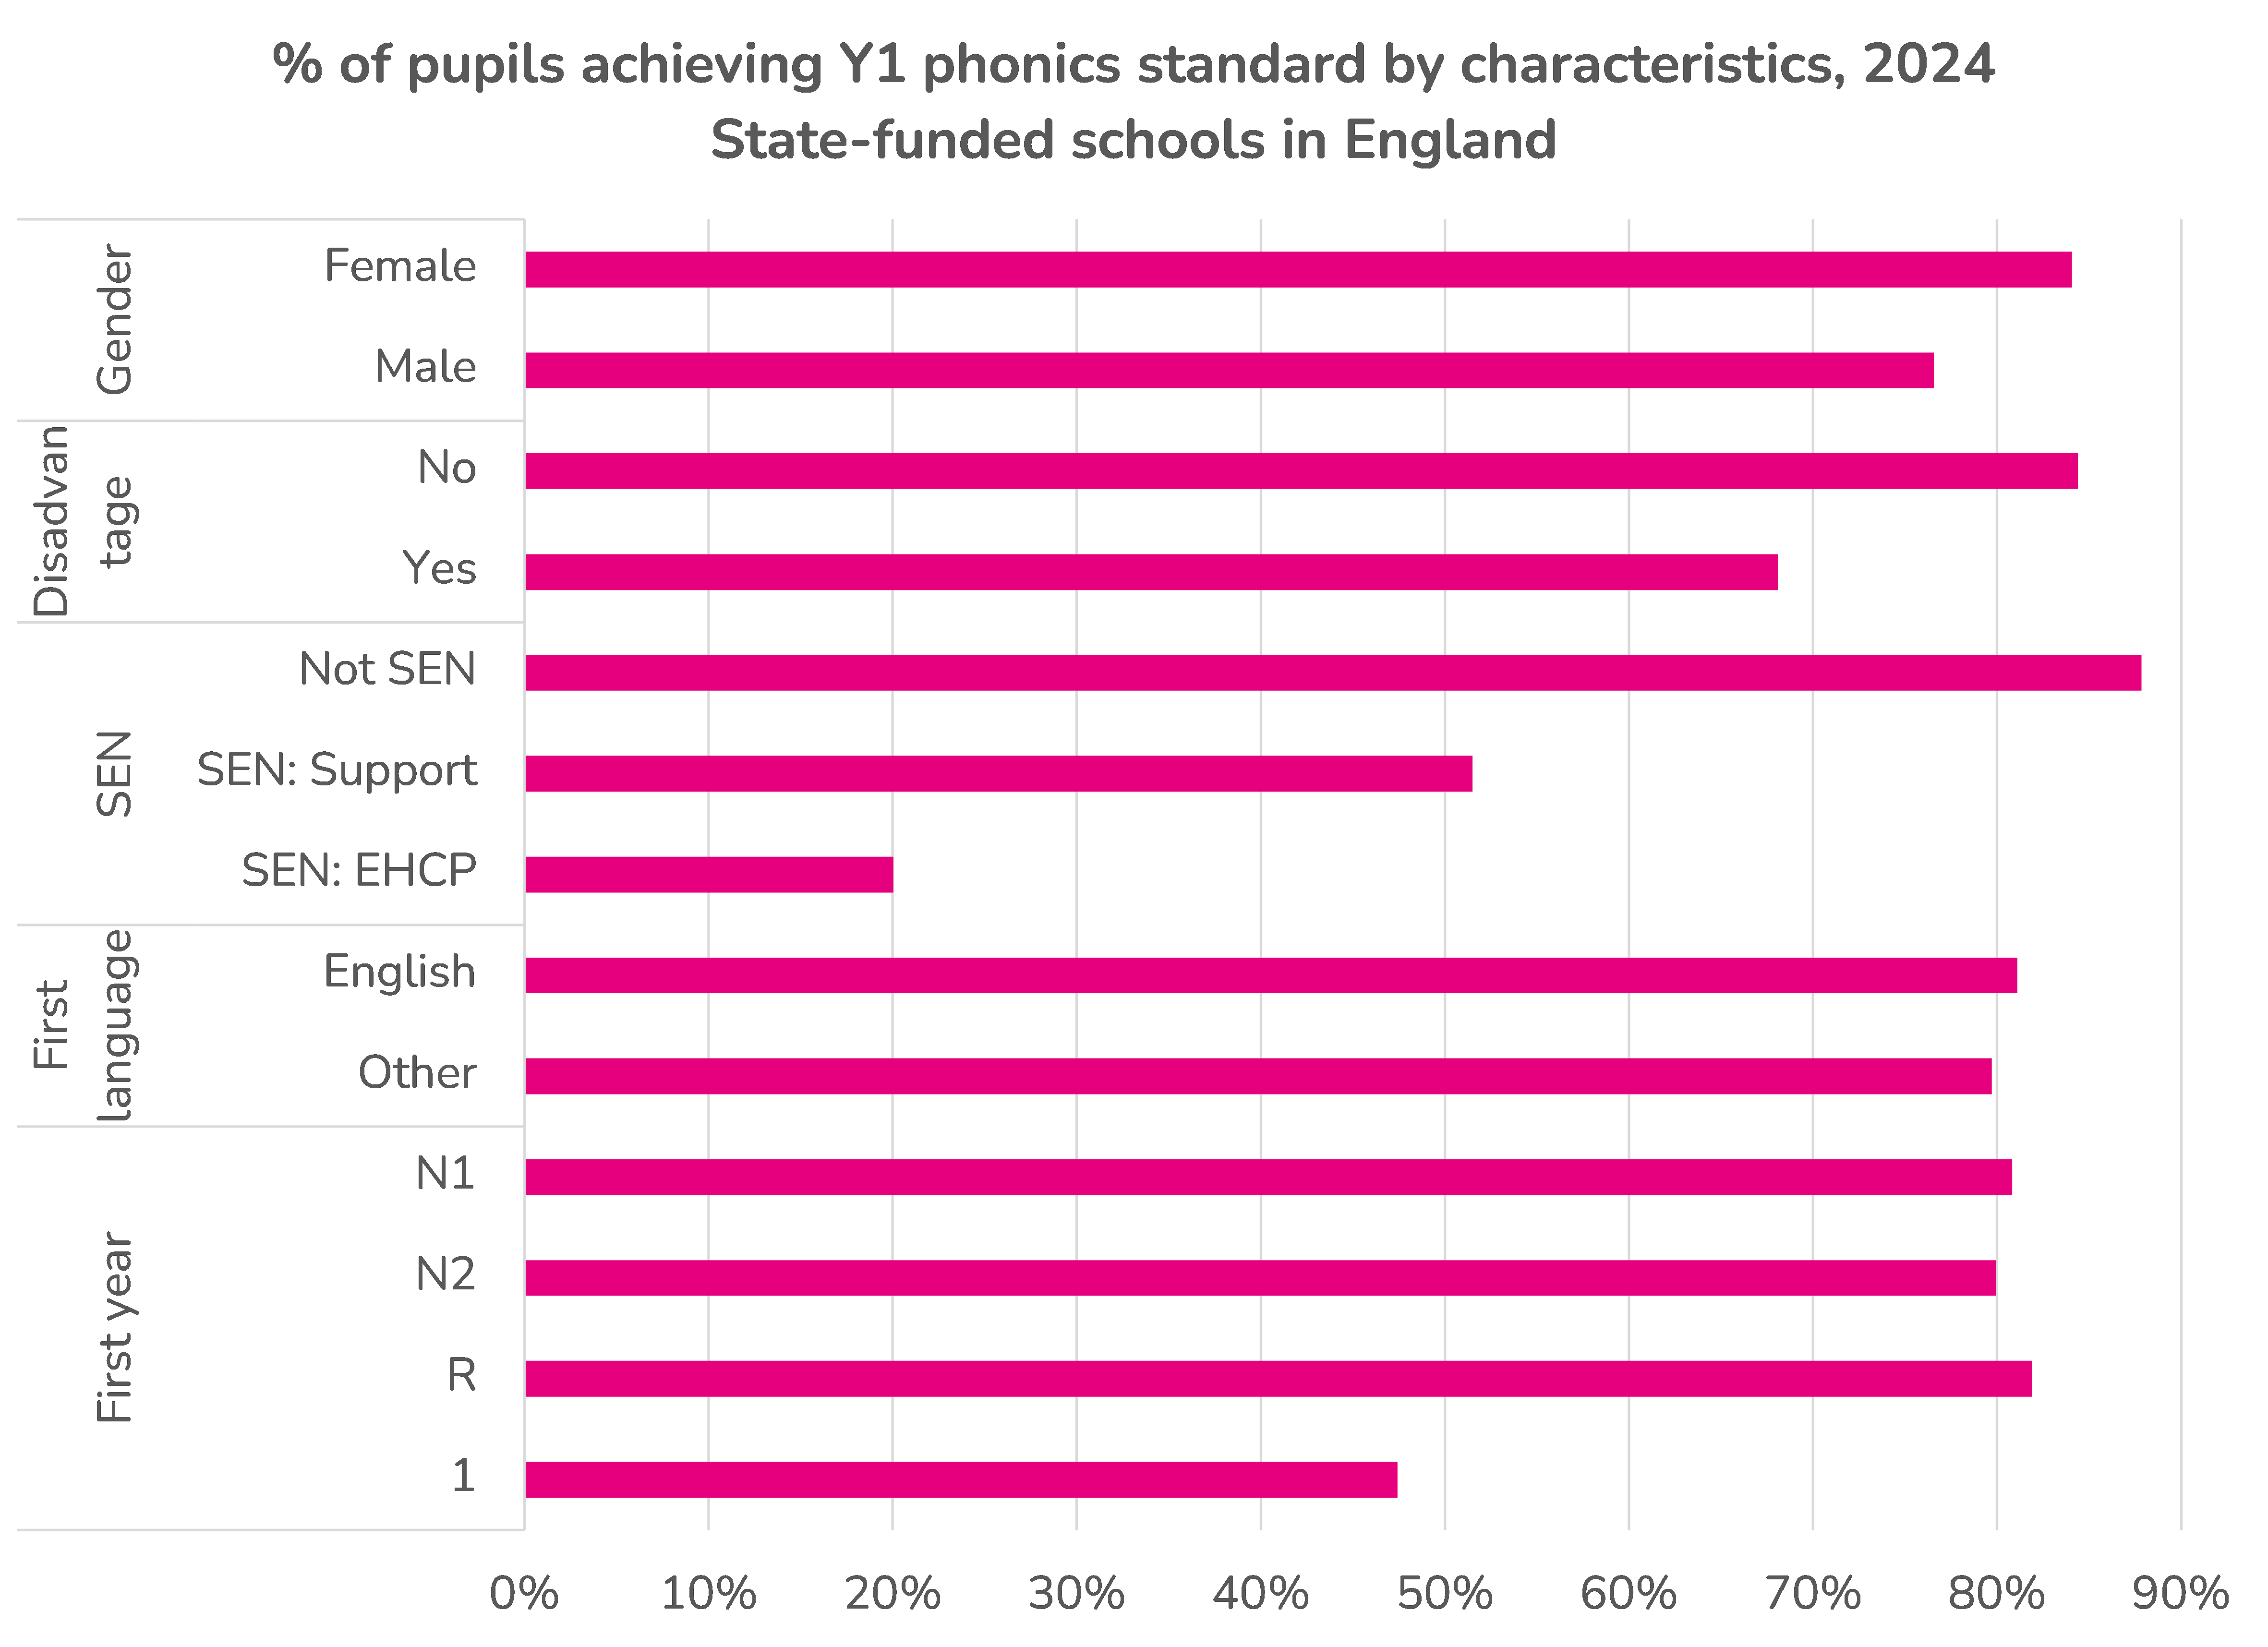
In addition:
- 68% of disadvantaged pupils achieved the standard compared to 84% of other pupils
- 51% of pupils with SEN met by SEN support and 20% of those with an EHCP achieved the standard compared to 88% of pupils without any recorded SEN
We also find that disadvantaged pupils are more likely to achieve the standard the longer they have spent on roll at schools. In the following chart we use find the first year we observe pupils in School Census.
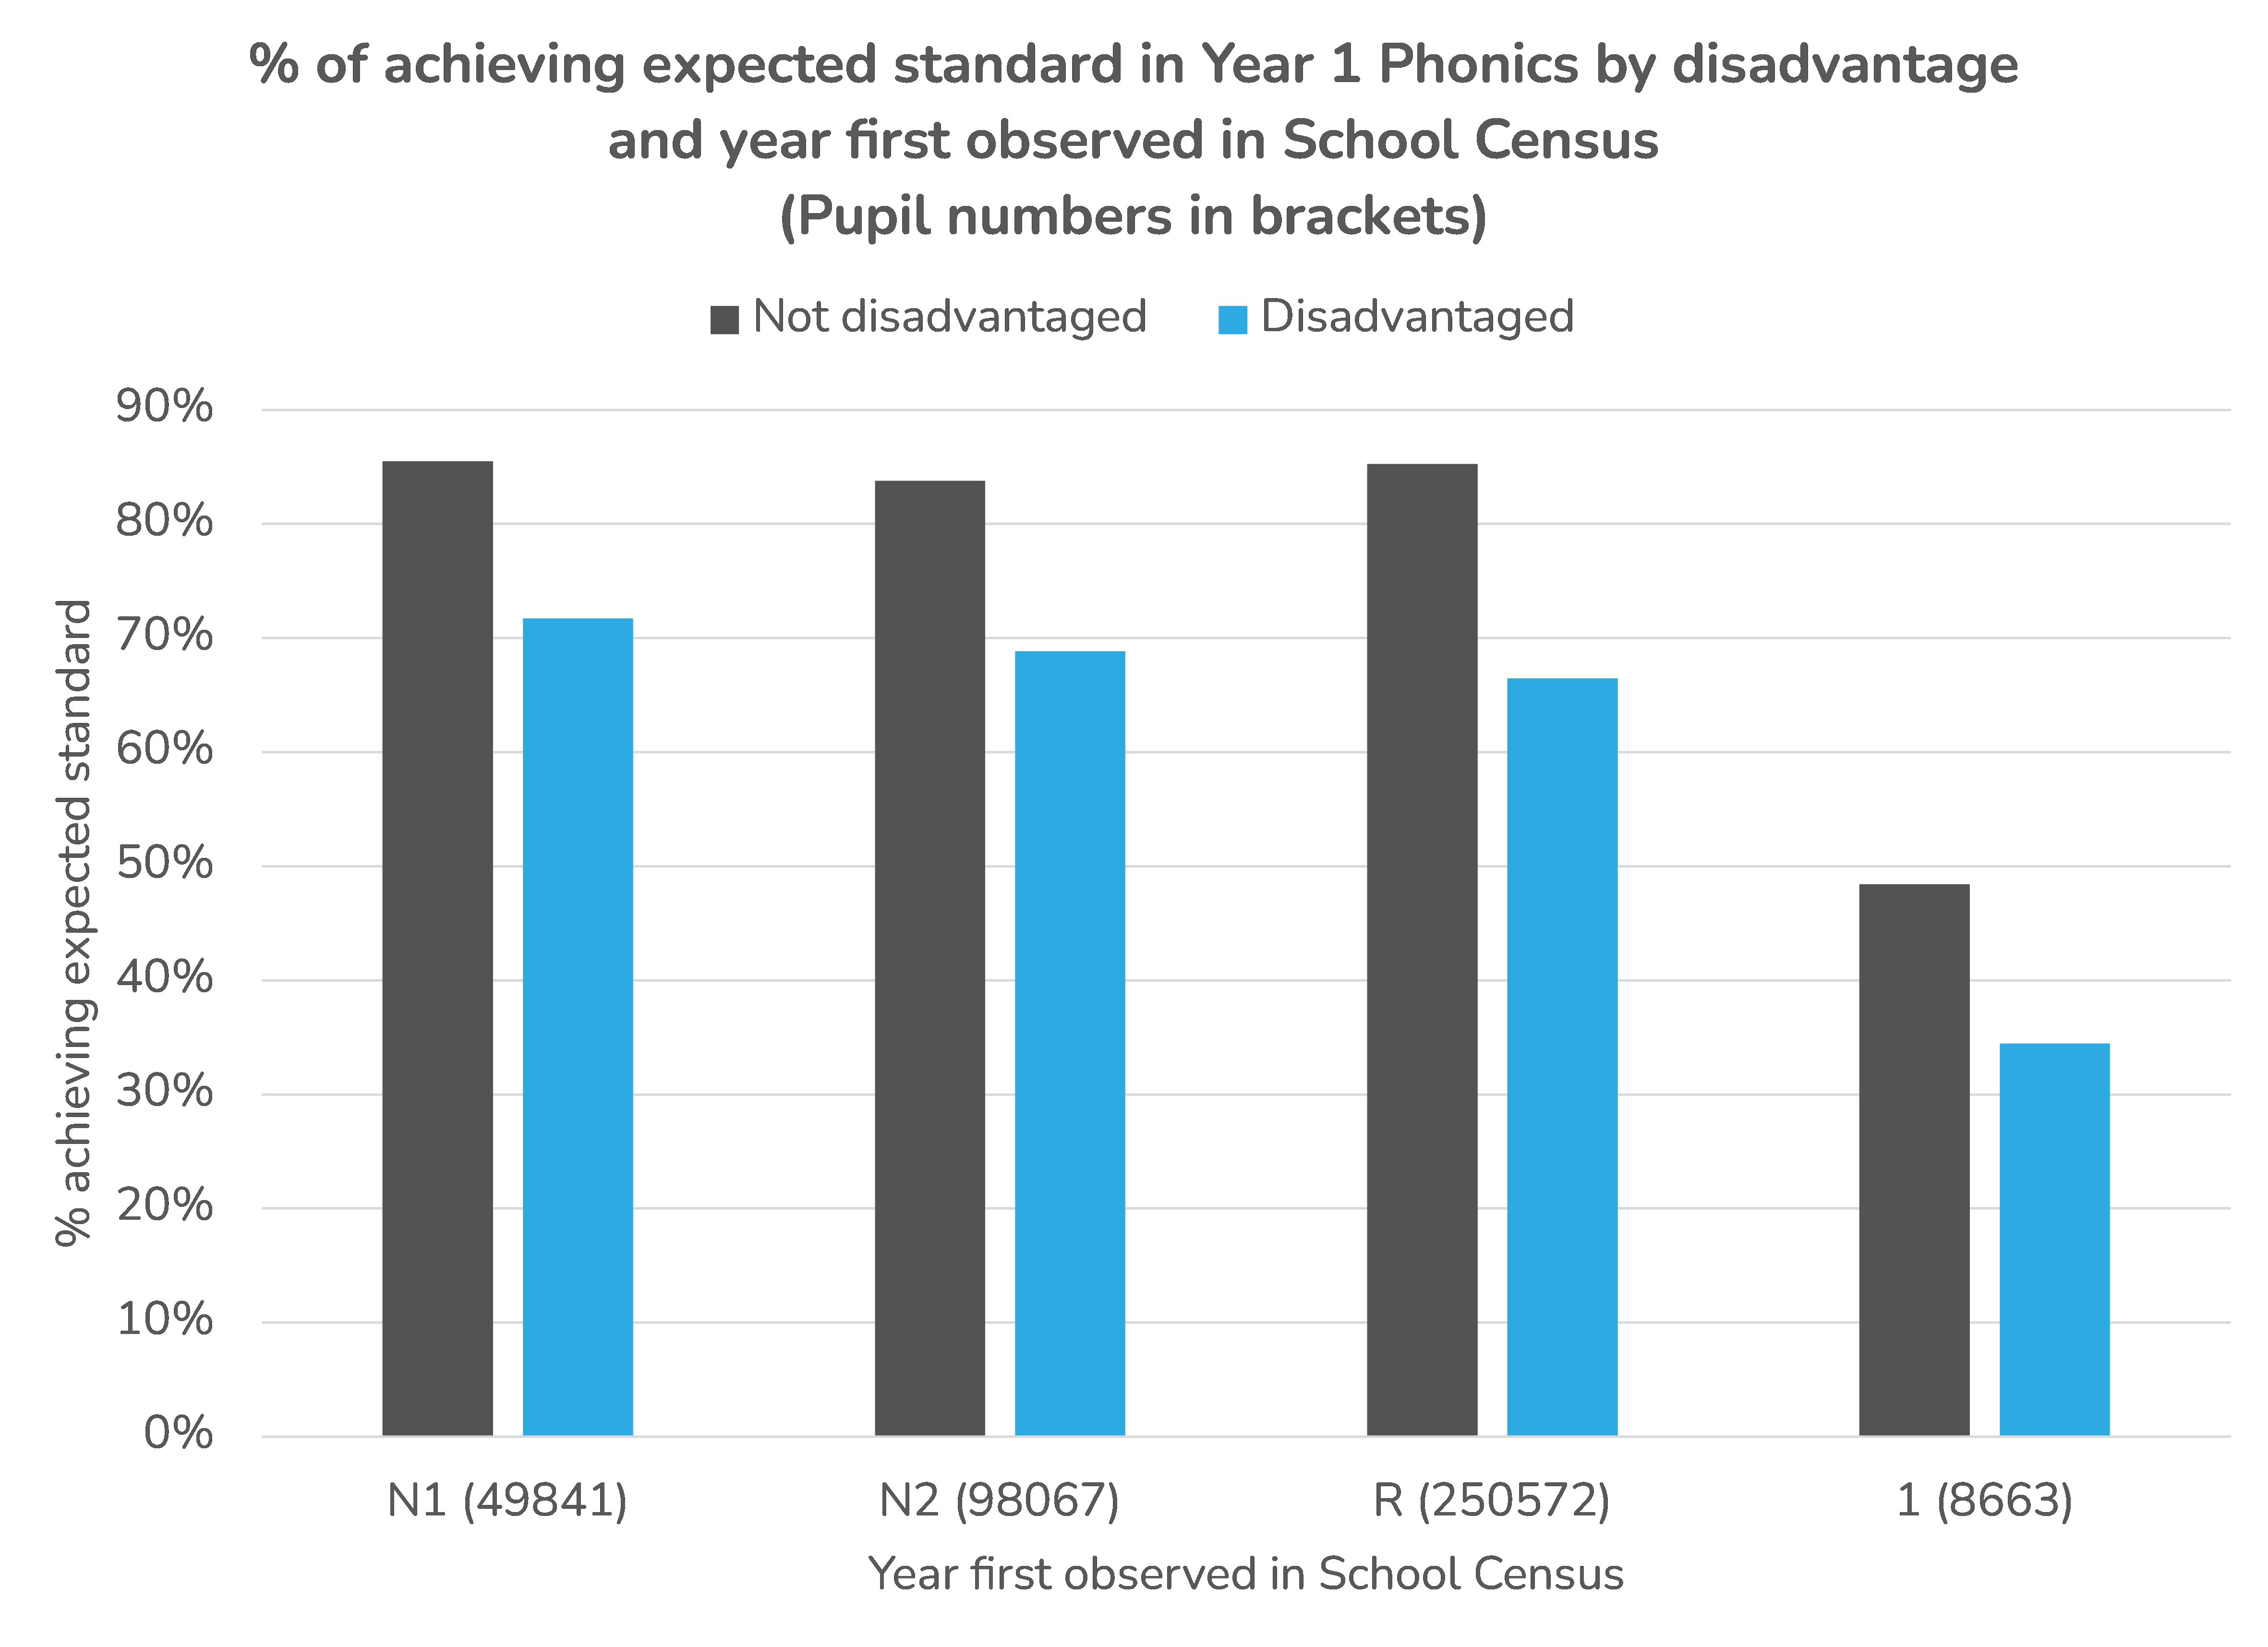
72% of disadvantaged pupils who were on roll in schools in Nursery 1 (N1, usually at age 2) subsequently achieved the expected standard. This compares to 66% of the much larger group of disadvantaged pupils who were first observed on roll at a school in Reception.
The mark distribution
In the following chart we show the percentage of pupils at each mark point in 2024. We also include pupils who were absent (marked by A) and those for whom the check was disapplied (marked by D).
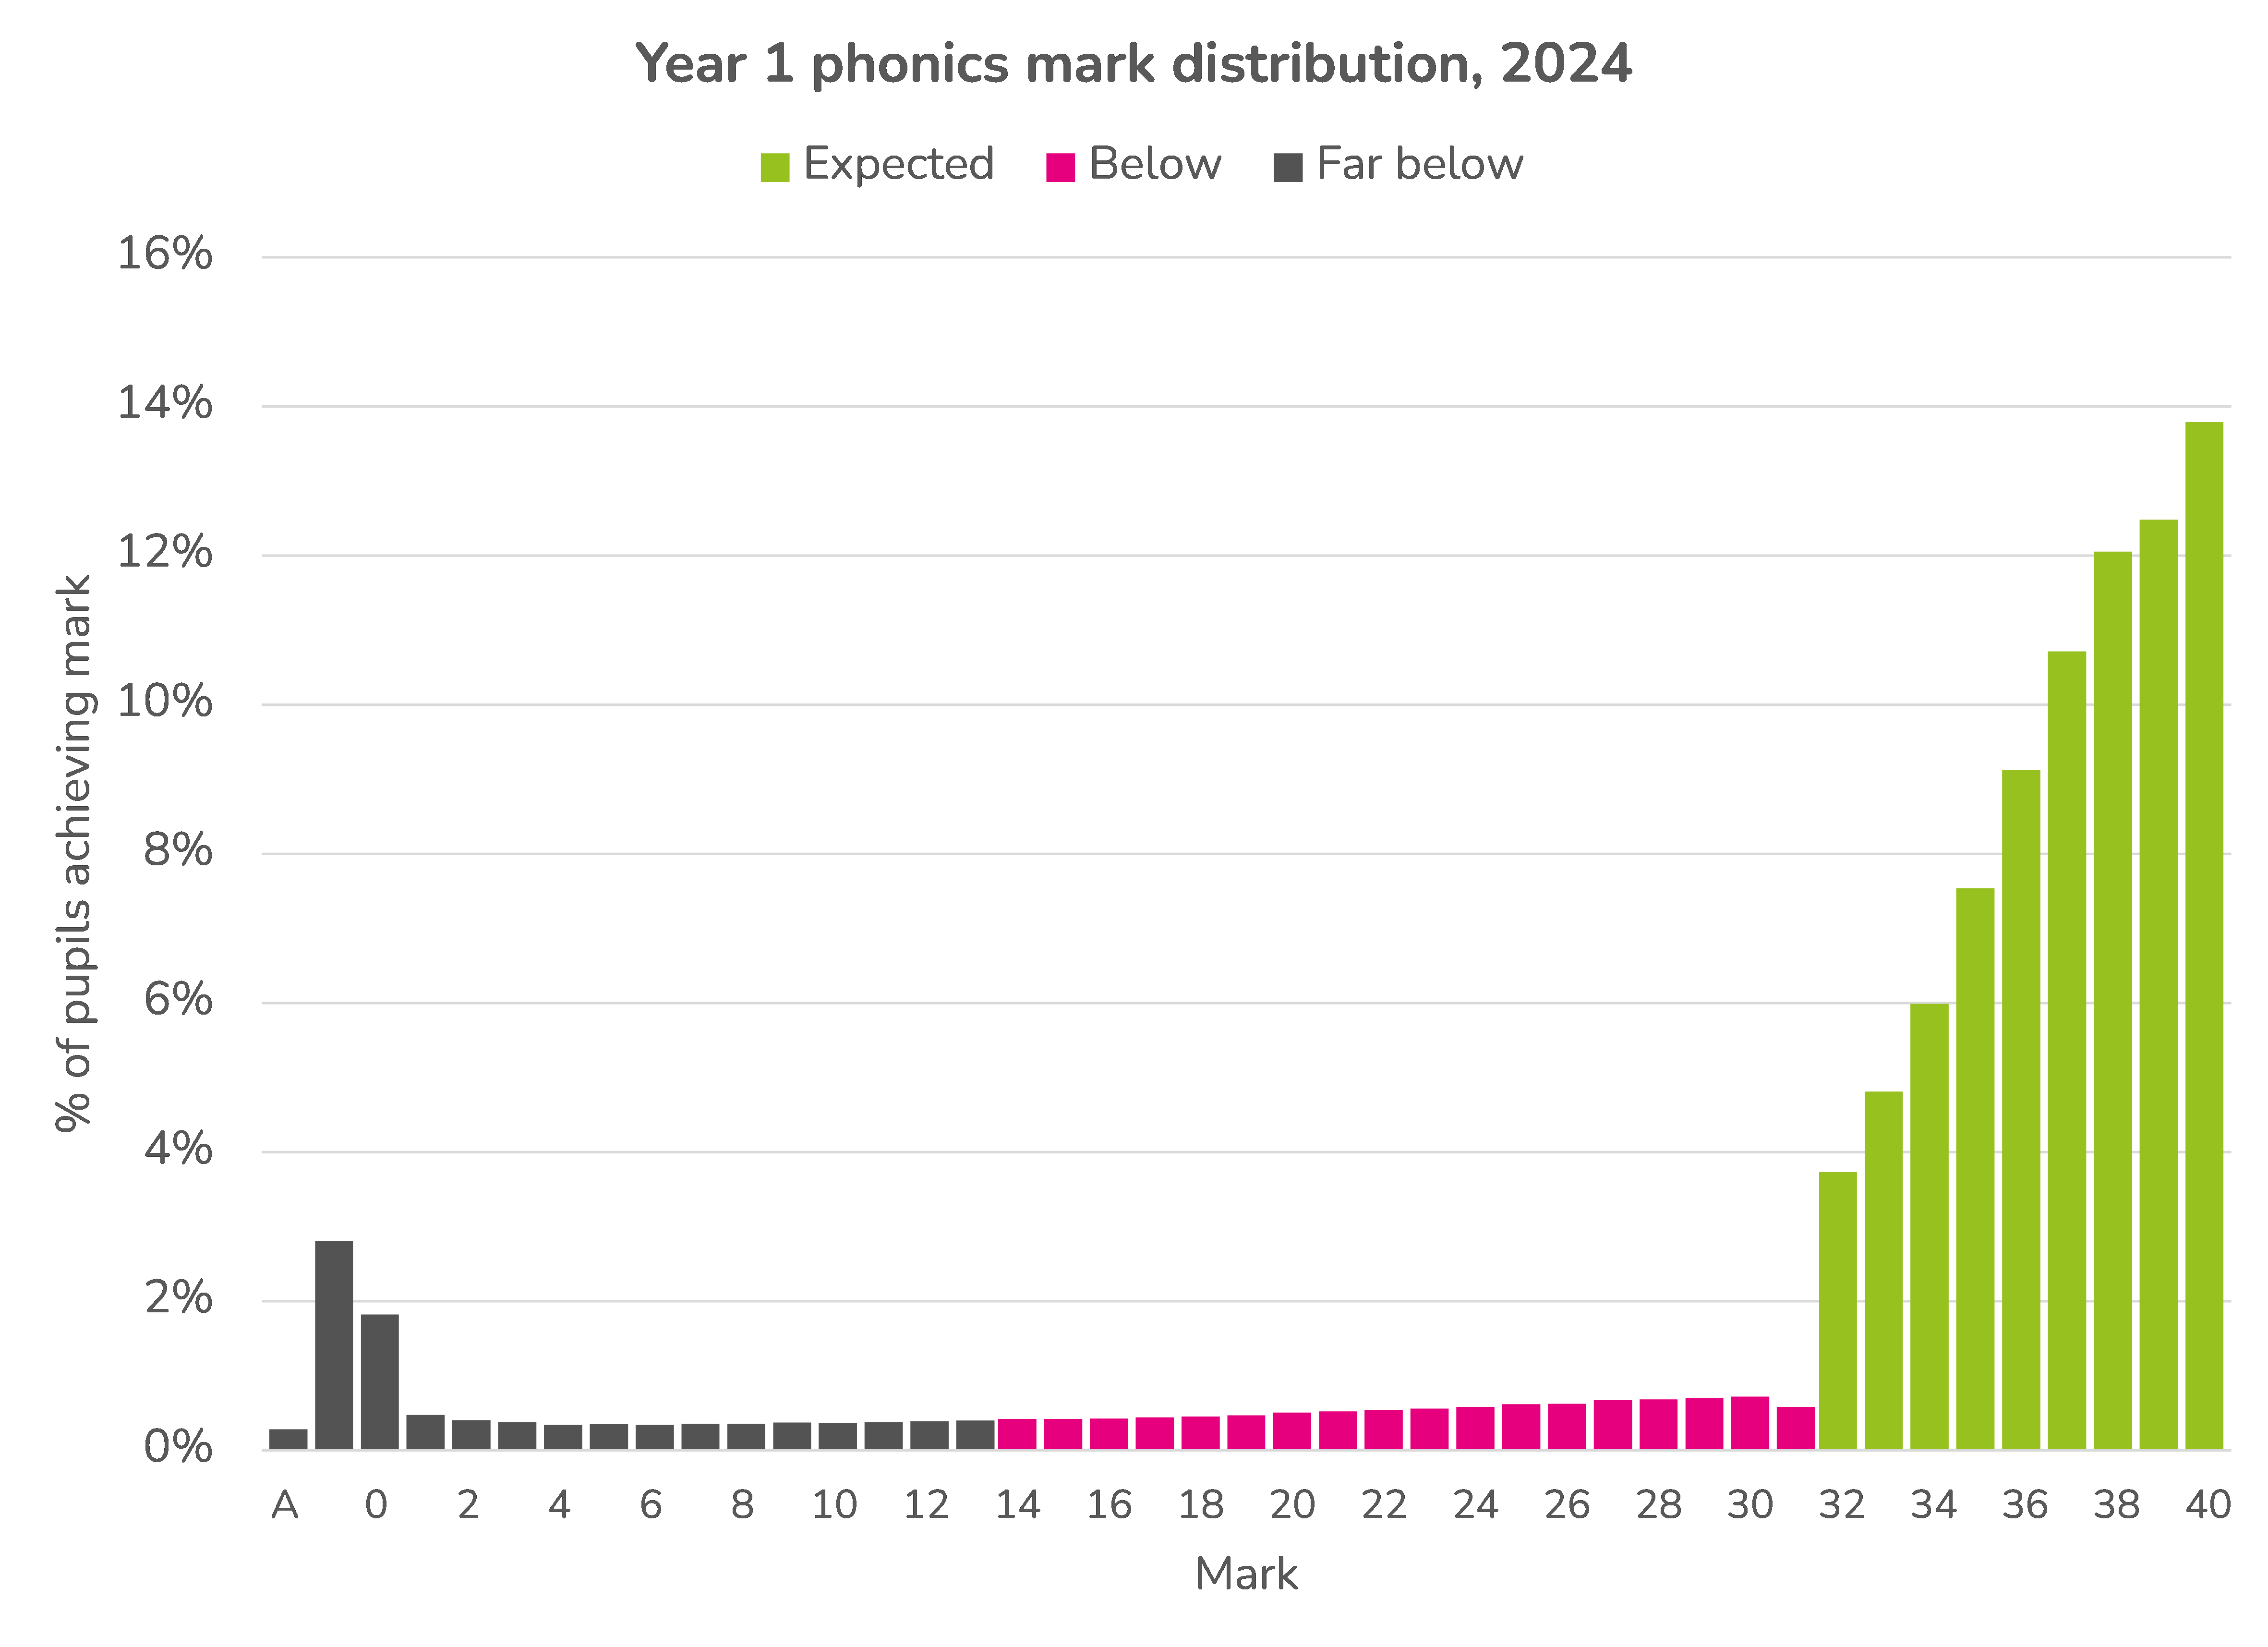
The distribution is left-skewed with the majority of pupils plotted to the right. In fact, the modal mark is 40. Those plotted in green have achieved the expected standard. This covers 80% of the Year 1 population.
The puce bars indicate the next 10% of the distribution. If the 90% ambition were to have been achieved in 2024, this group would have had to have scored 32 or more.
This range is quite wide, consisting of pupils scoring between 14 and 31 points. Meeting the 90% ambition won’t just be a case of moving some borderline pupils above the threshold.
Given this distribution, it might have been better to set a target based on increasing the mean mark (assuming checks from year to year are of the same level of difficulty), in other words, shifting the distribution to the right.
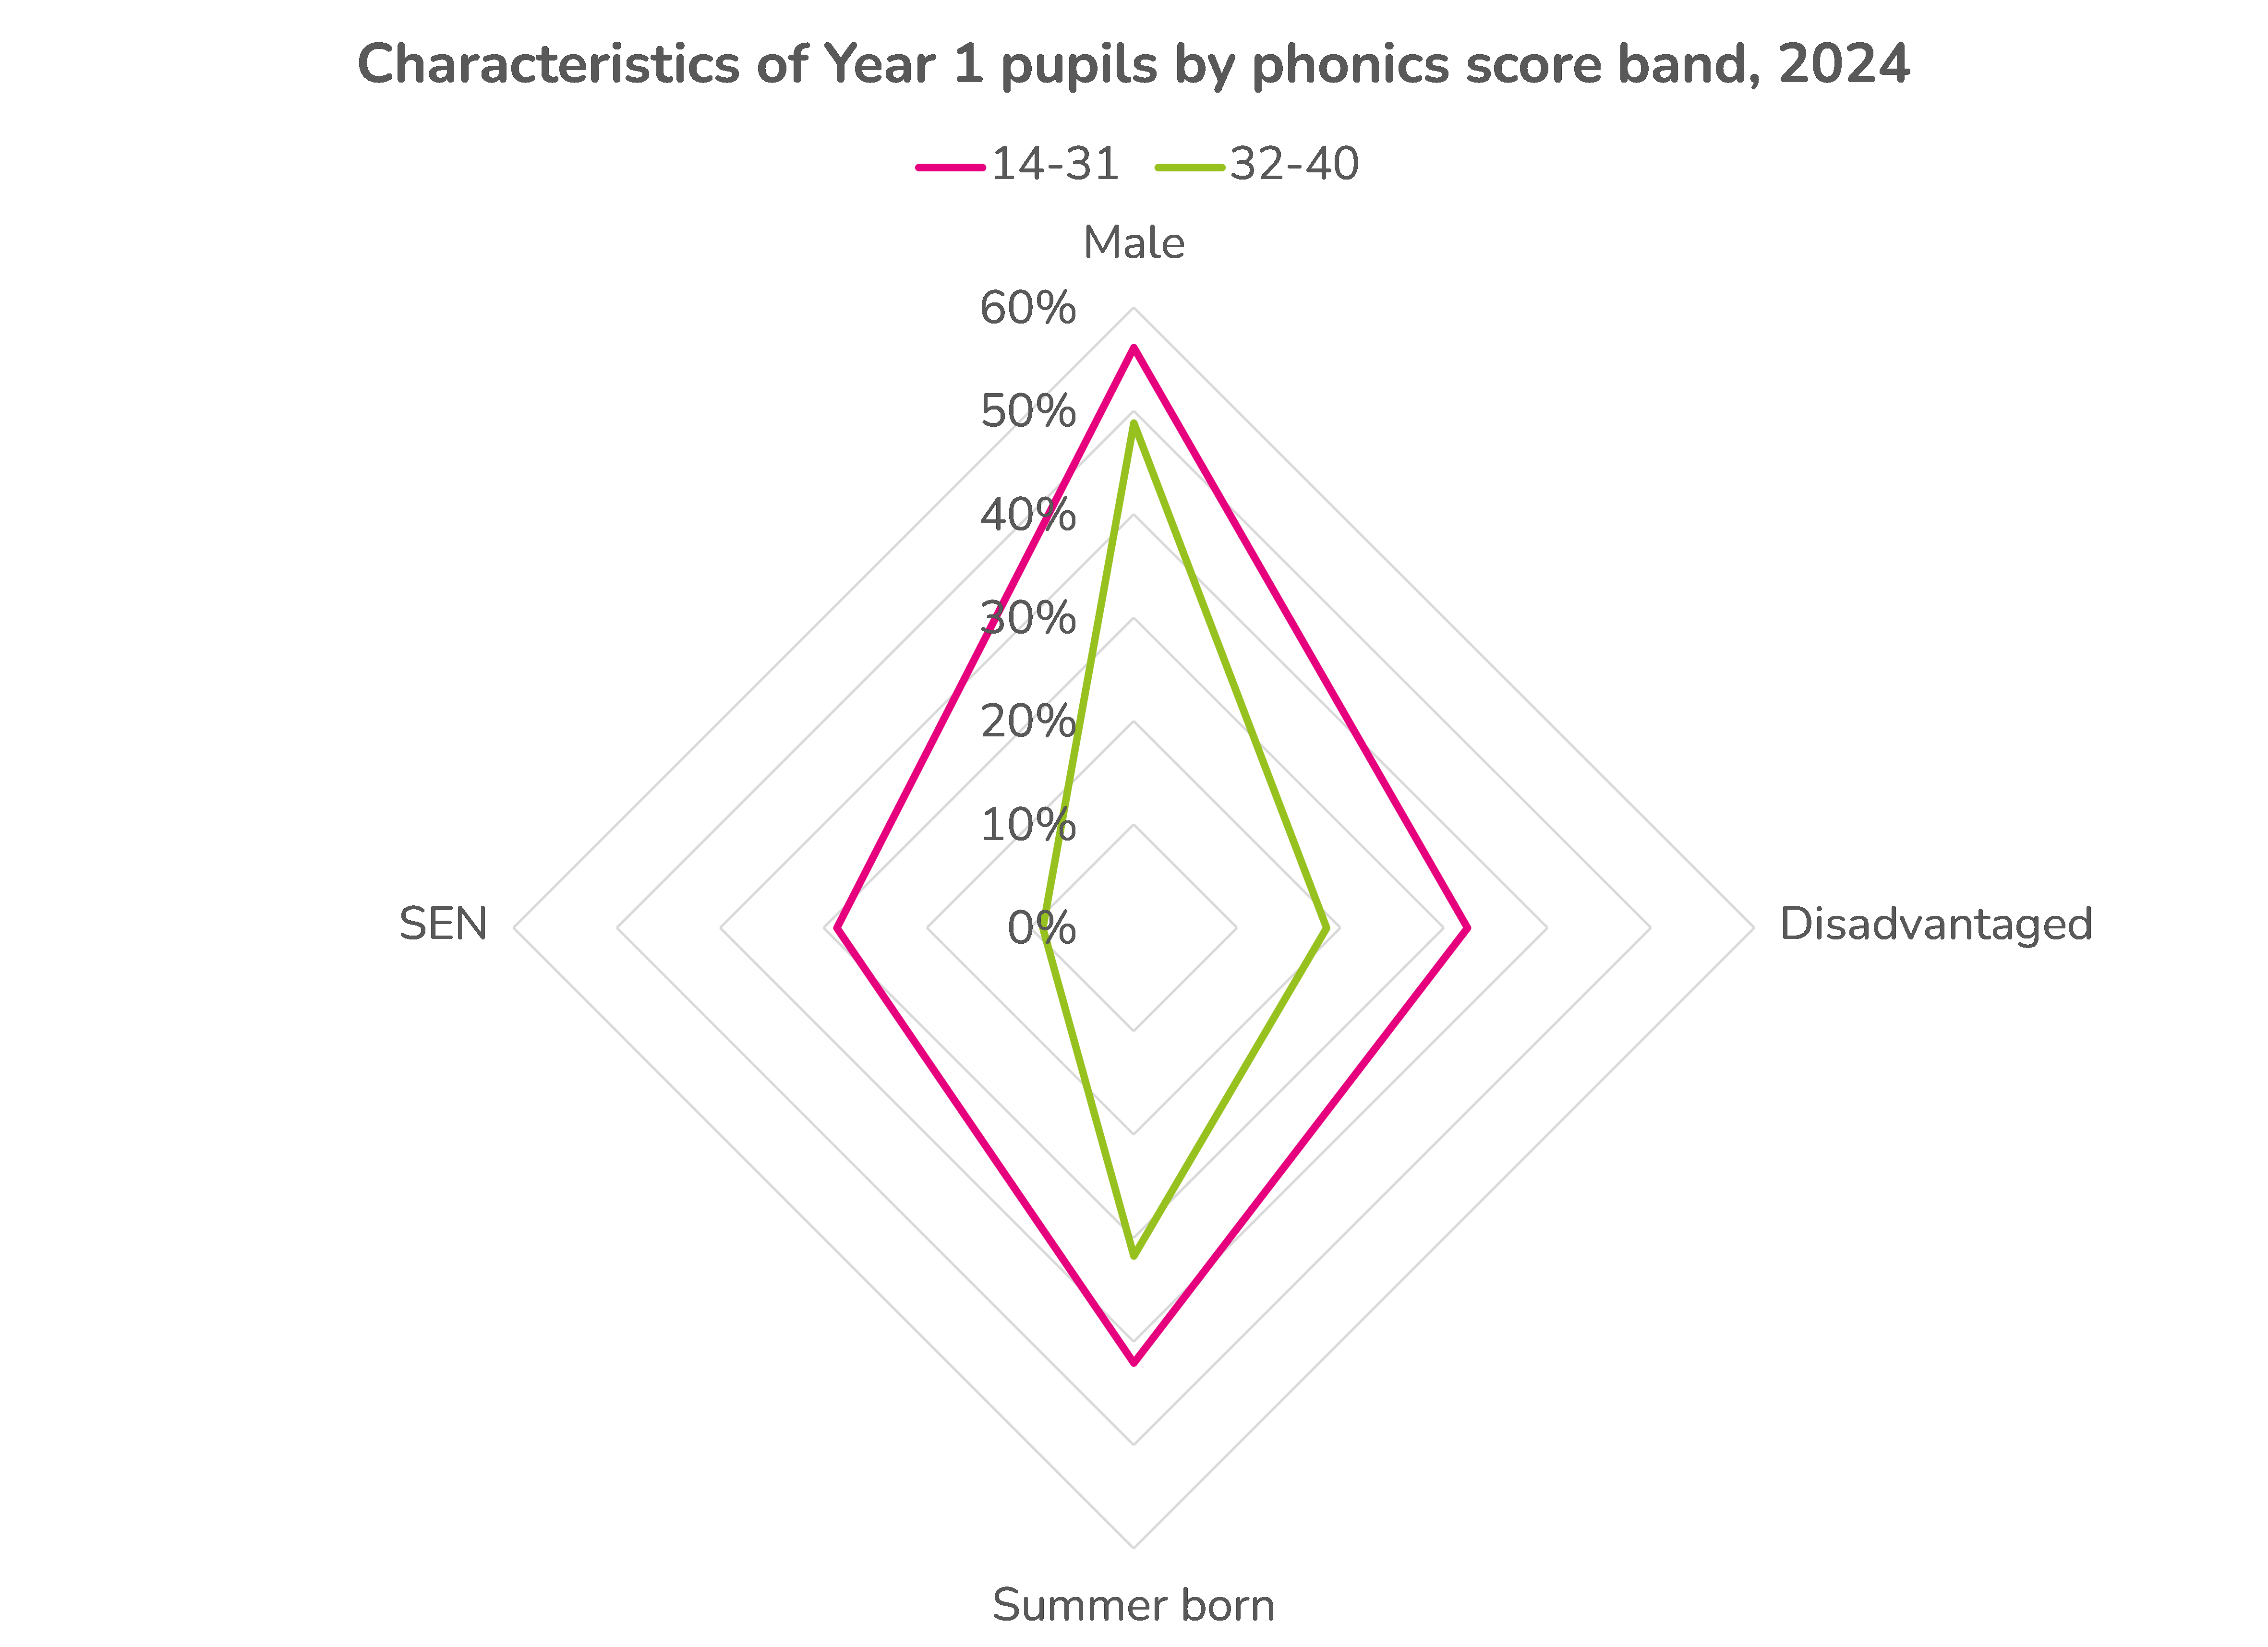
The characteristics of the 10%
In the chart below we compare the characteristics of pupils with a score of 14-31 in 2024 to those who achieved 32-40.
As would be expected from the first chart above, pupils in the 14-31 group are more likely than those in the 32-40 group to be boys, disadvantaged, summer born and identified with SEN.
How many pupils achieve the standard in Year 2?
We can see how many pupils subsequently achieved the expected standard in Year 2 in 2024 having not done so in Year 1 in 2023.
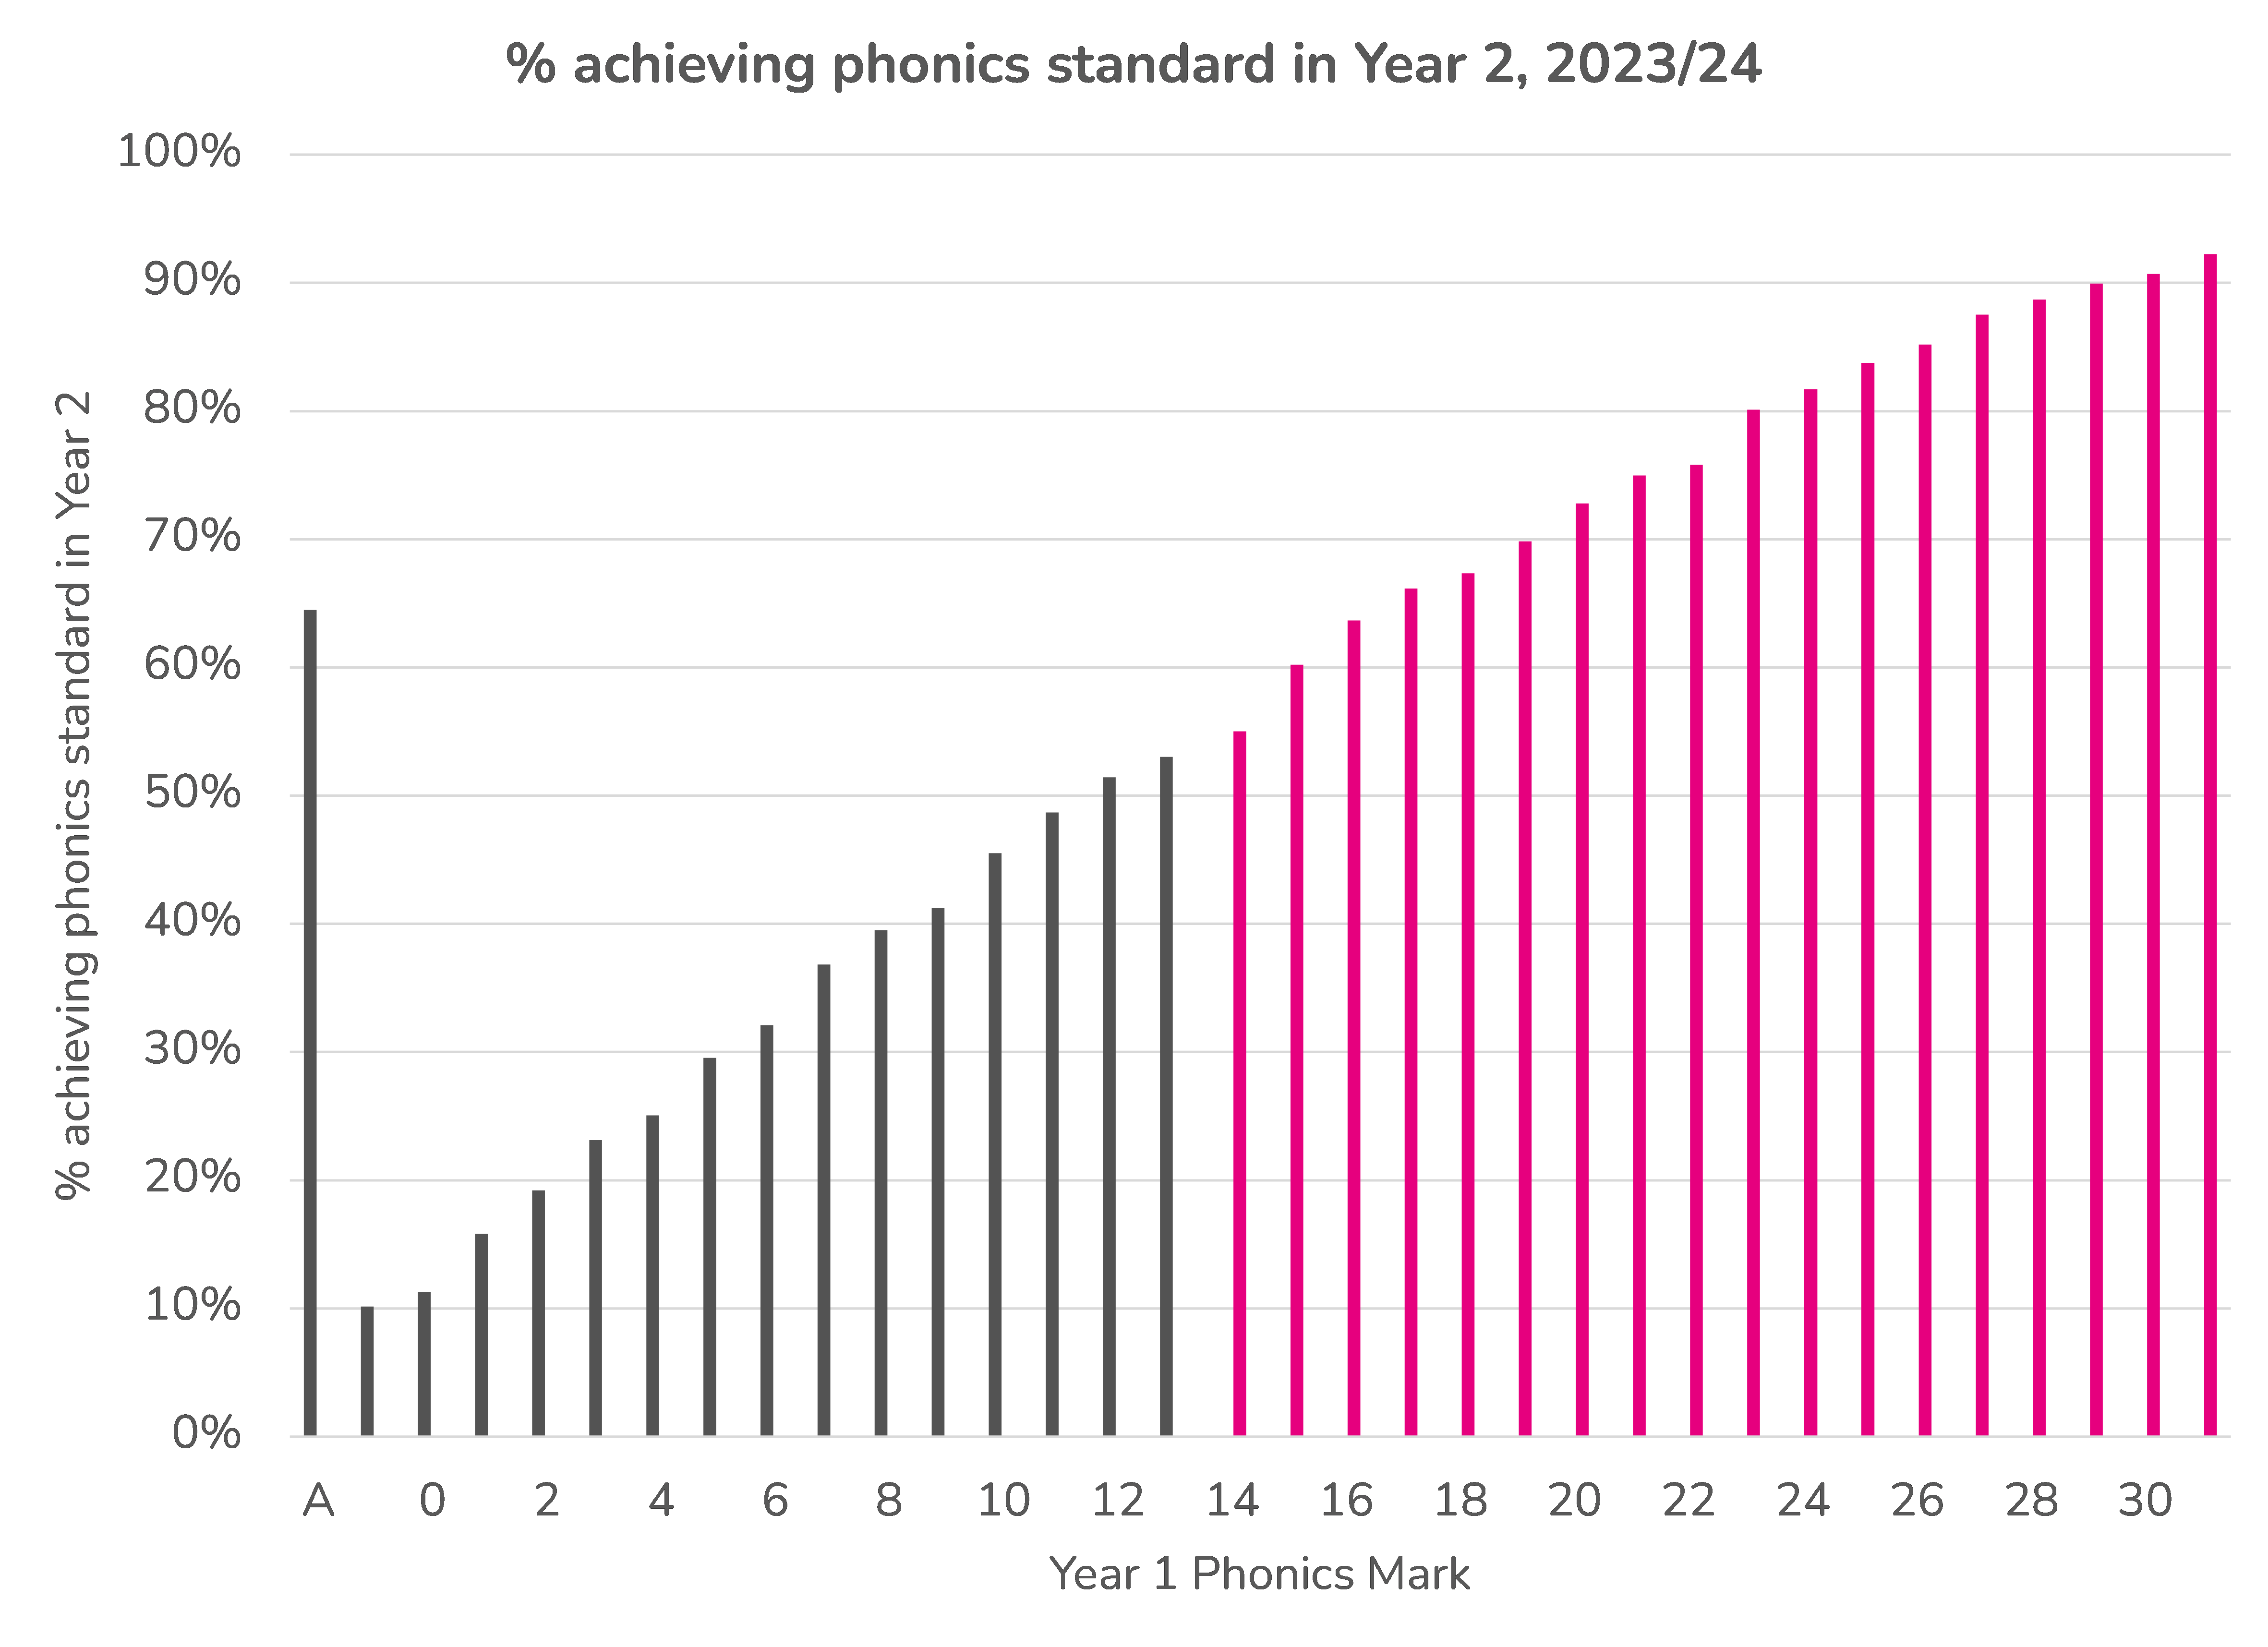
92% of those who achieved a score of 31 in 2023 achieved the expected standard in Year 2. This compares to 55% of those who scored 14.
Overall, 54% of pupils who achieved 31 or lower in 2023 went on to achieve the expected standard in Year 2. This means 89% of the whole Year 1 cohort from 2023 had achieved the expected standard by the end of Year 2.
Achieving the ambition would require all these pupils to achieve the standard by the end of Year 1. This more than anything gives a sense of the scale of the challenge of meeting the 90% ambition.
How many schools achieve the 90% ambition?
School-level data for Year 1 phonics is not published.
We have calculated the percentage of Year 1 pupils who achieved the phonics standard in 2024 for state-funded mainstream schools with at least 10 Year 1 pupils.
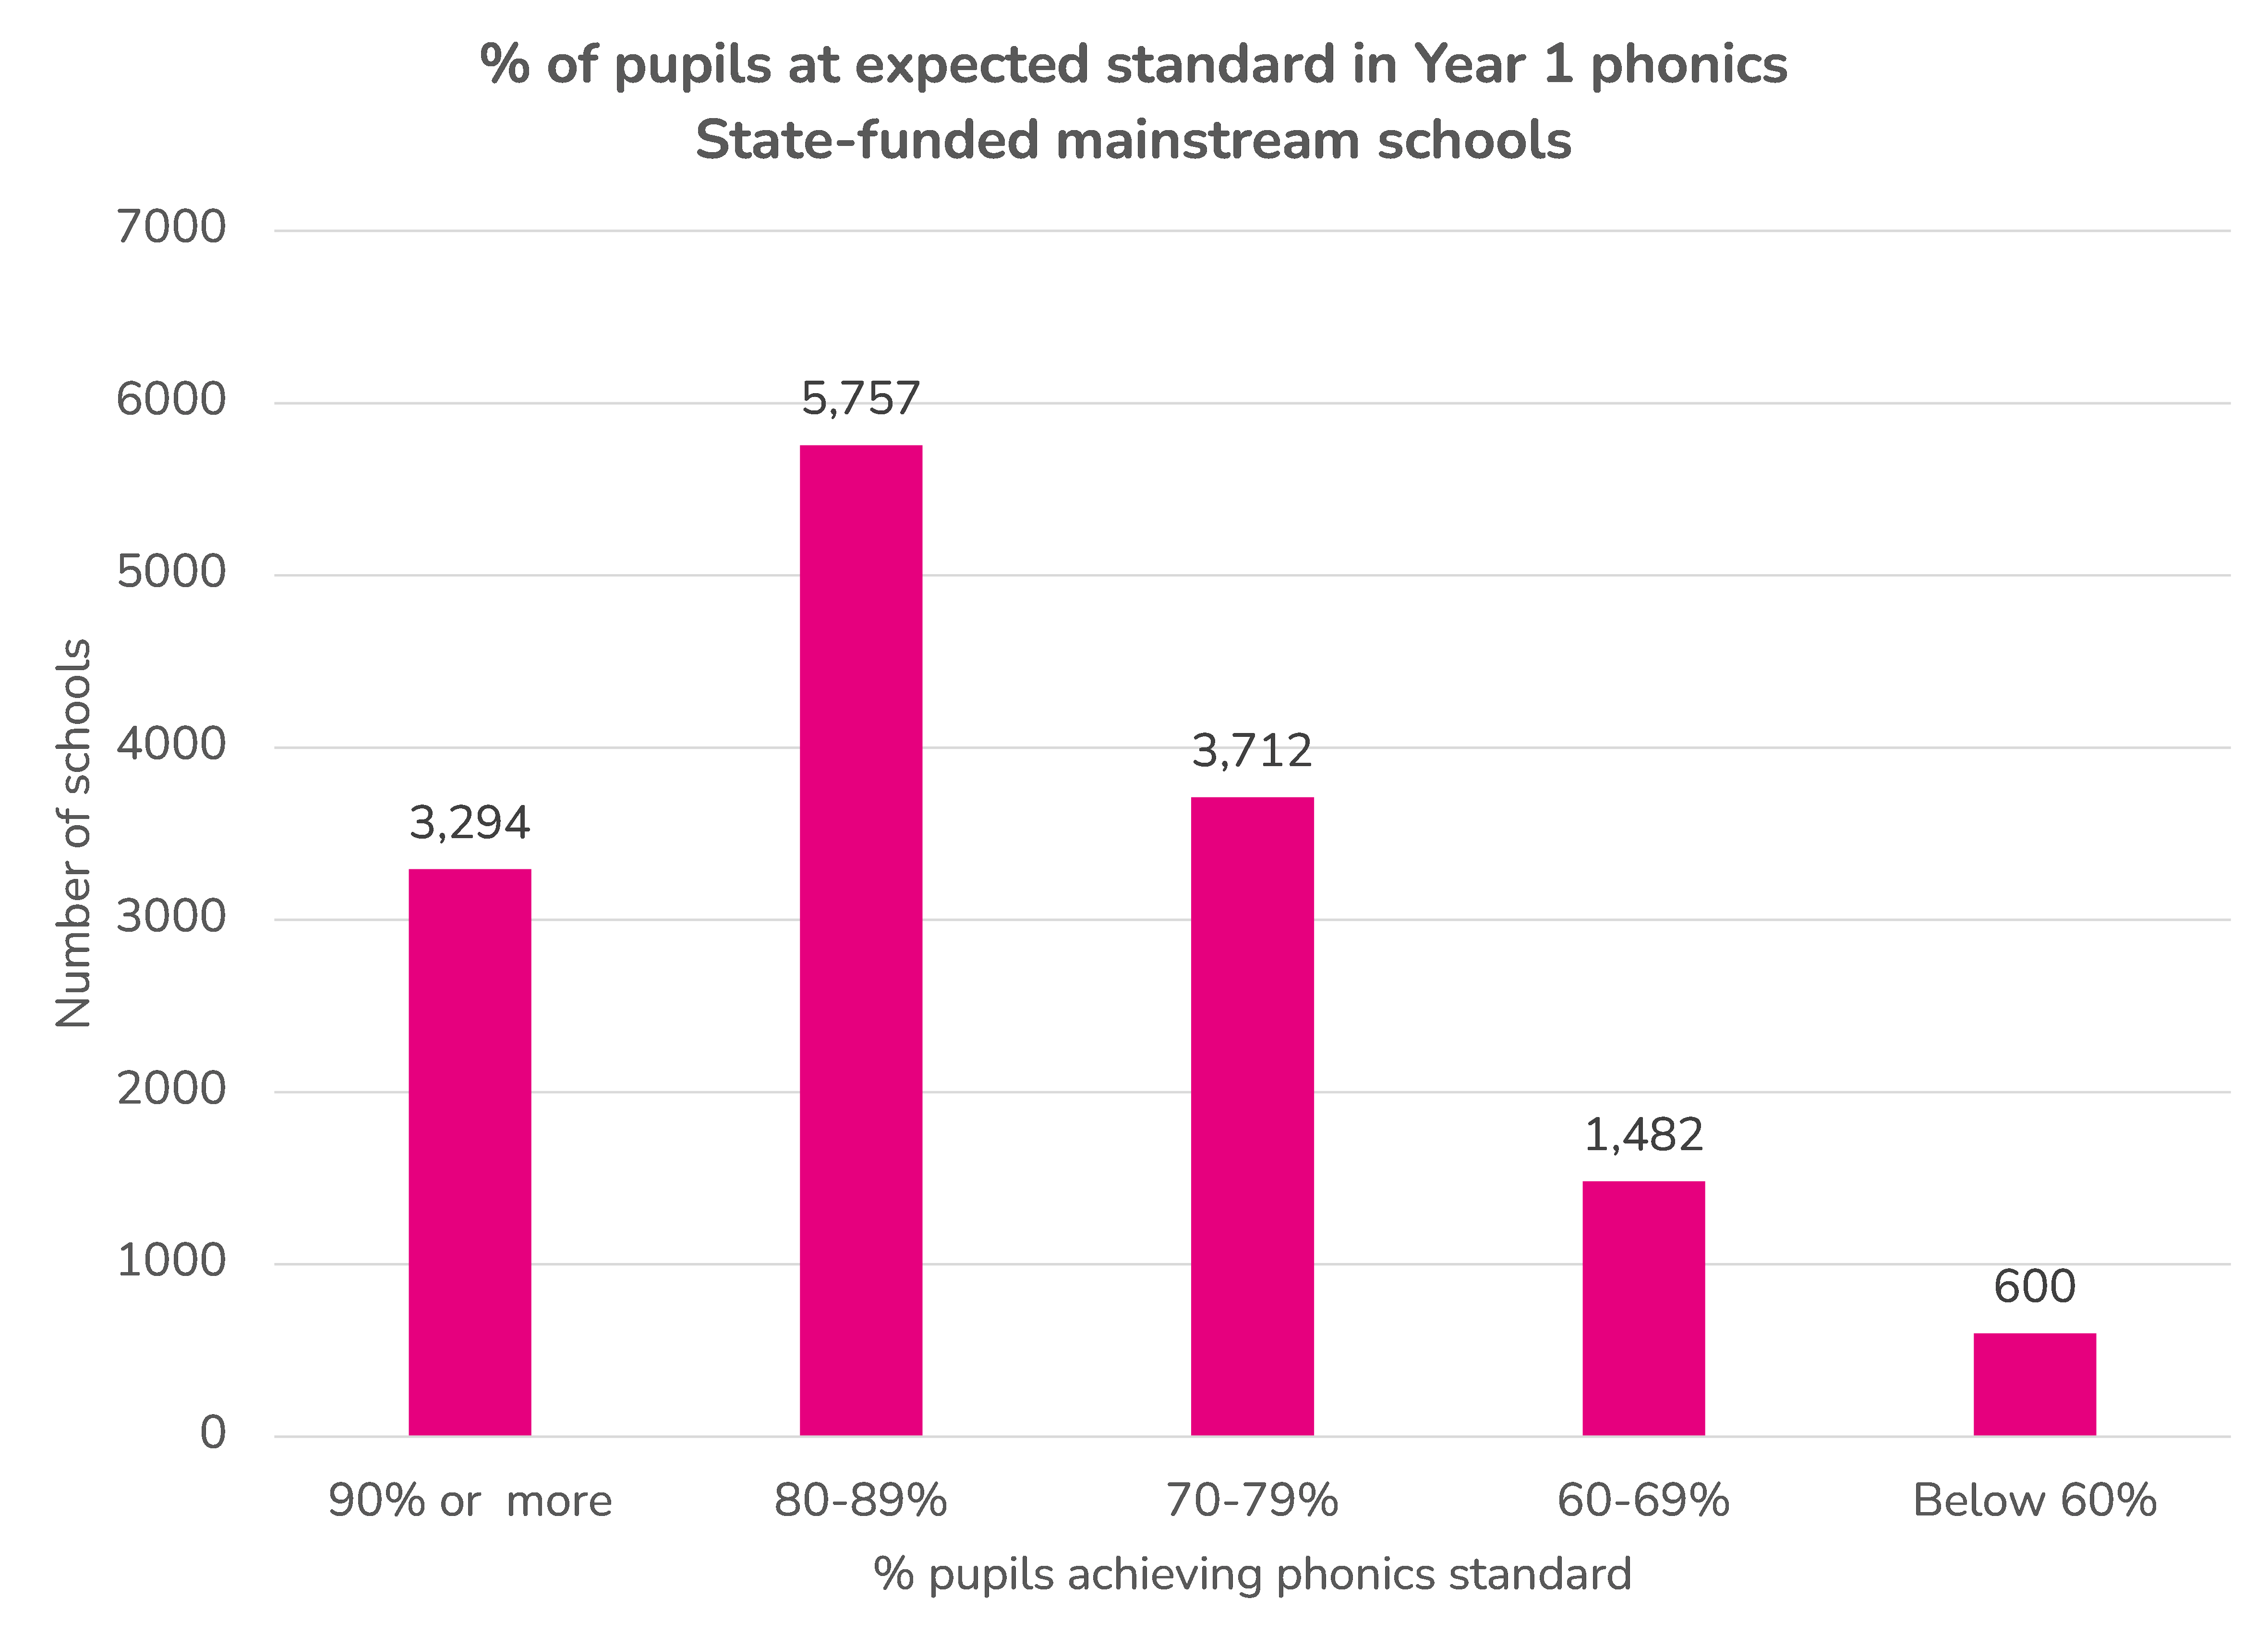
We find that at least 90% of pupils achieved the phonics standard at 3,294 schools out of 14,845 (22%) in 2024.
Another 5,757 (39%) achieved a rate between 80% and 90%.
We should make it clear that the 90% ambition does not apply to individual schools. We merely include this breakdown for informational purposes.
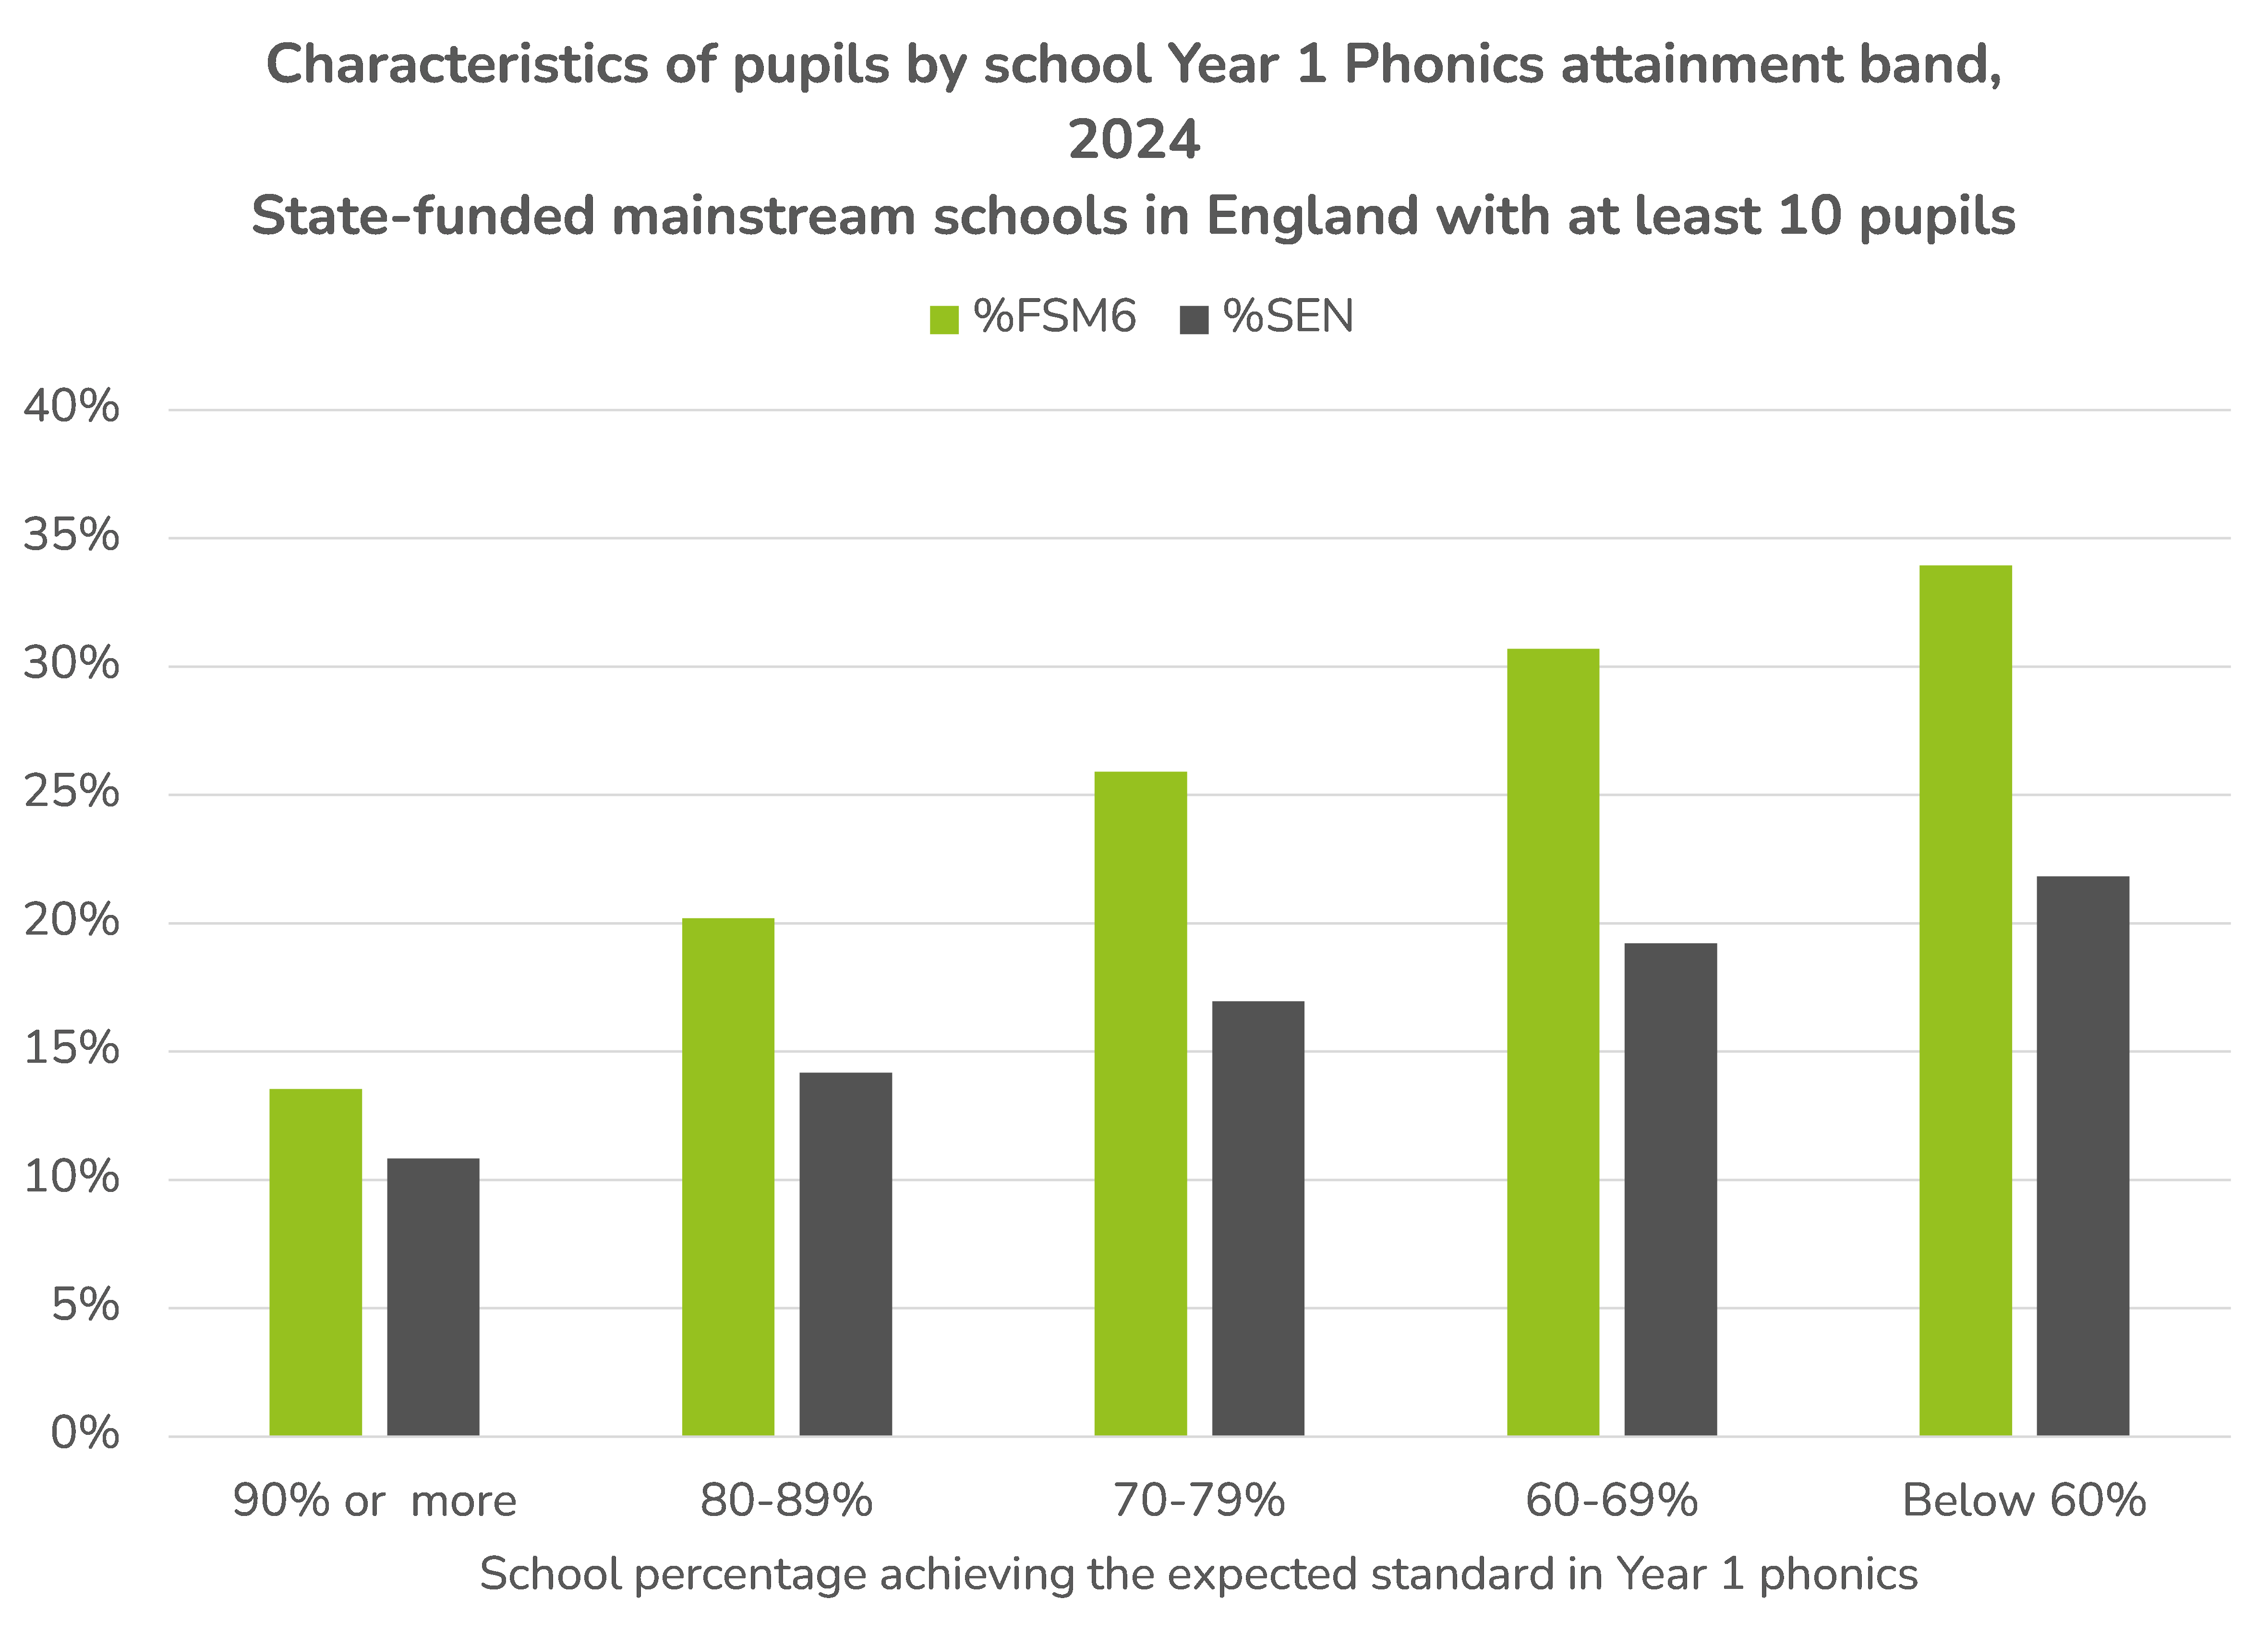
Unsurprisingly, schools with lower achievement rates tend to have higher rates of pupils with SEN and pupils eligible for free school meals.
What are the sorts of words that pupils struggle to decode?
Using words from the decoding check that forms part of our Reading Assessment Programme, we can get a handle on words that Year 1 pupils struggle to read, along with the grapheme (how a sound is written) and the phoneme (the sound itself).
In the attached table we show the percentage of correct responses when pupils read out around 50 words, including pseudo words.
Whereas 90% of pupils read the word SMOKE correctly, only 46% read the word SURE correctly.
In the final chart, we summarise the percentage of correct responses by grapheme.
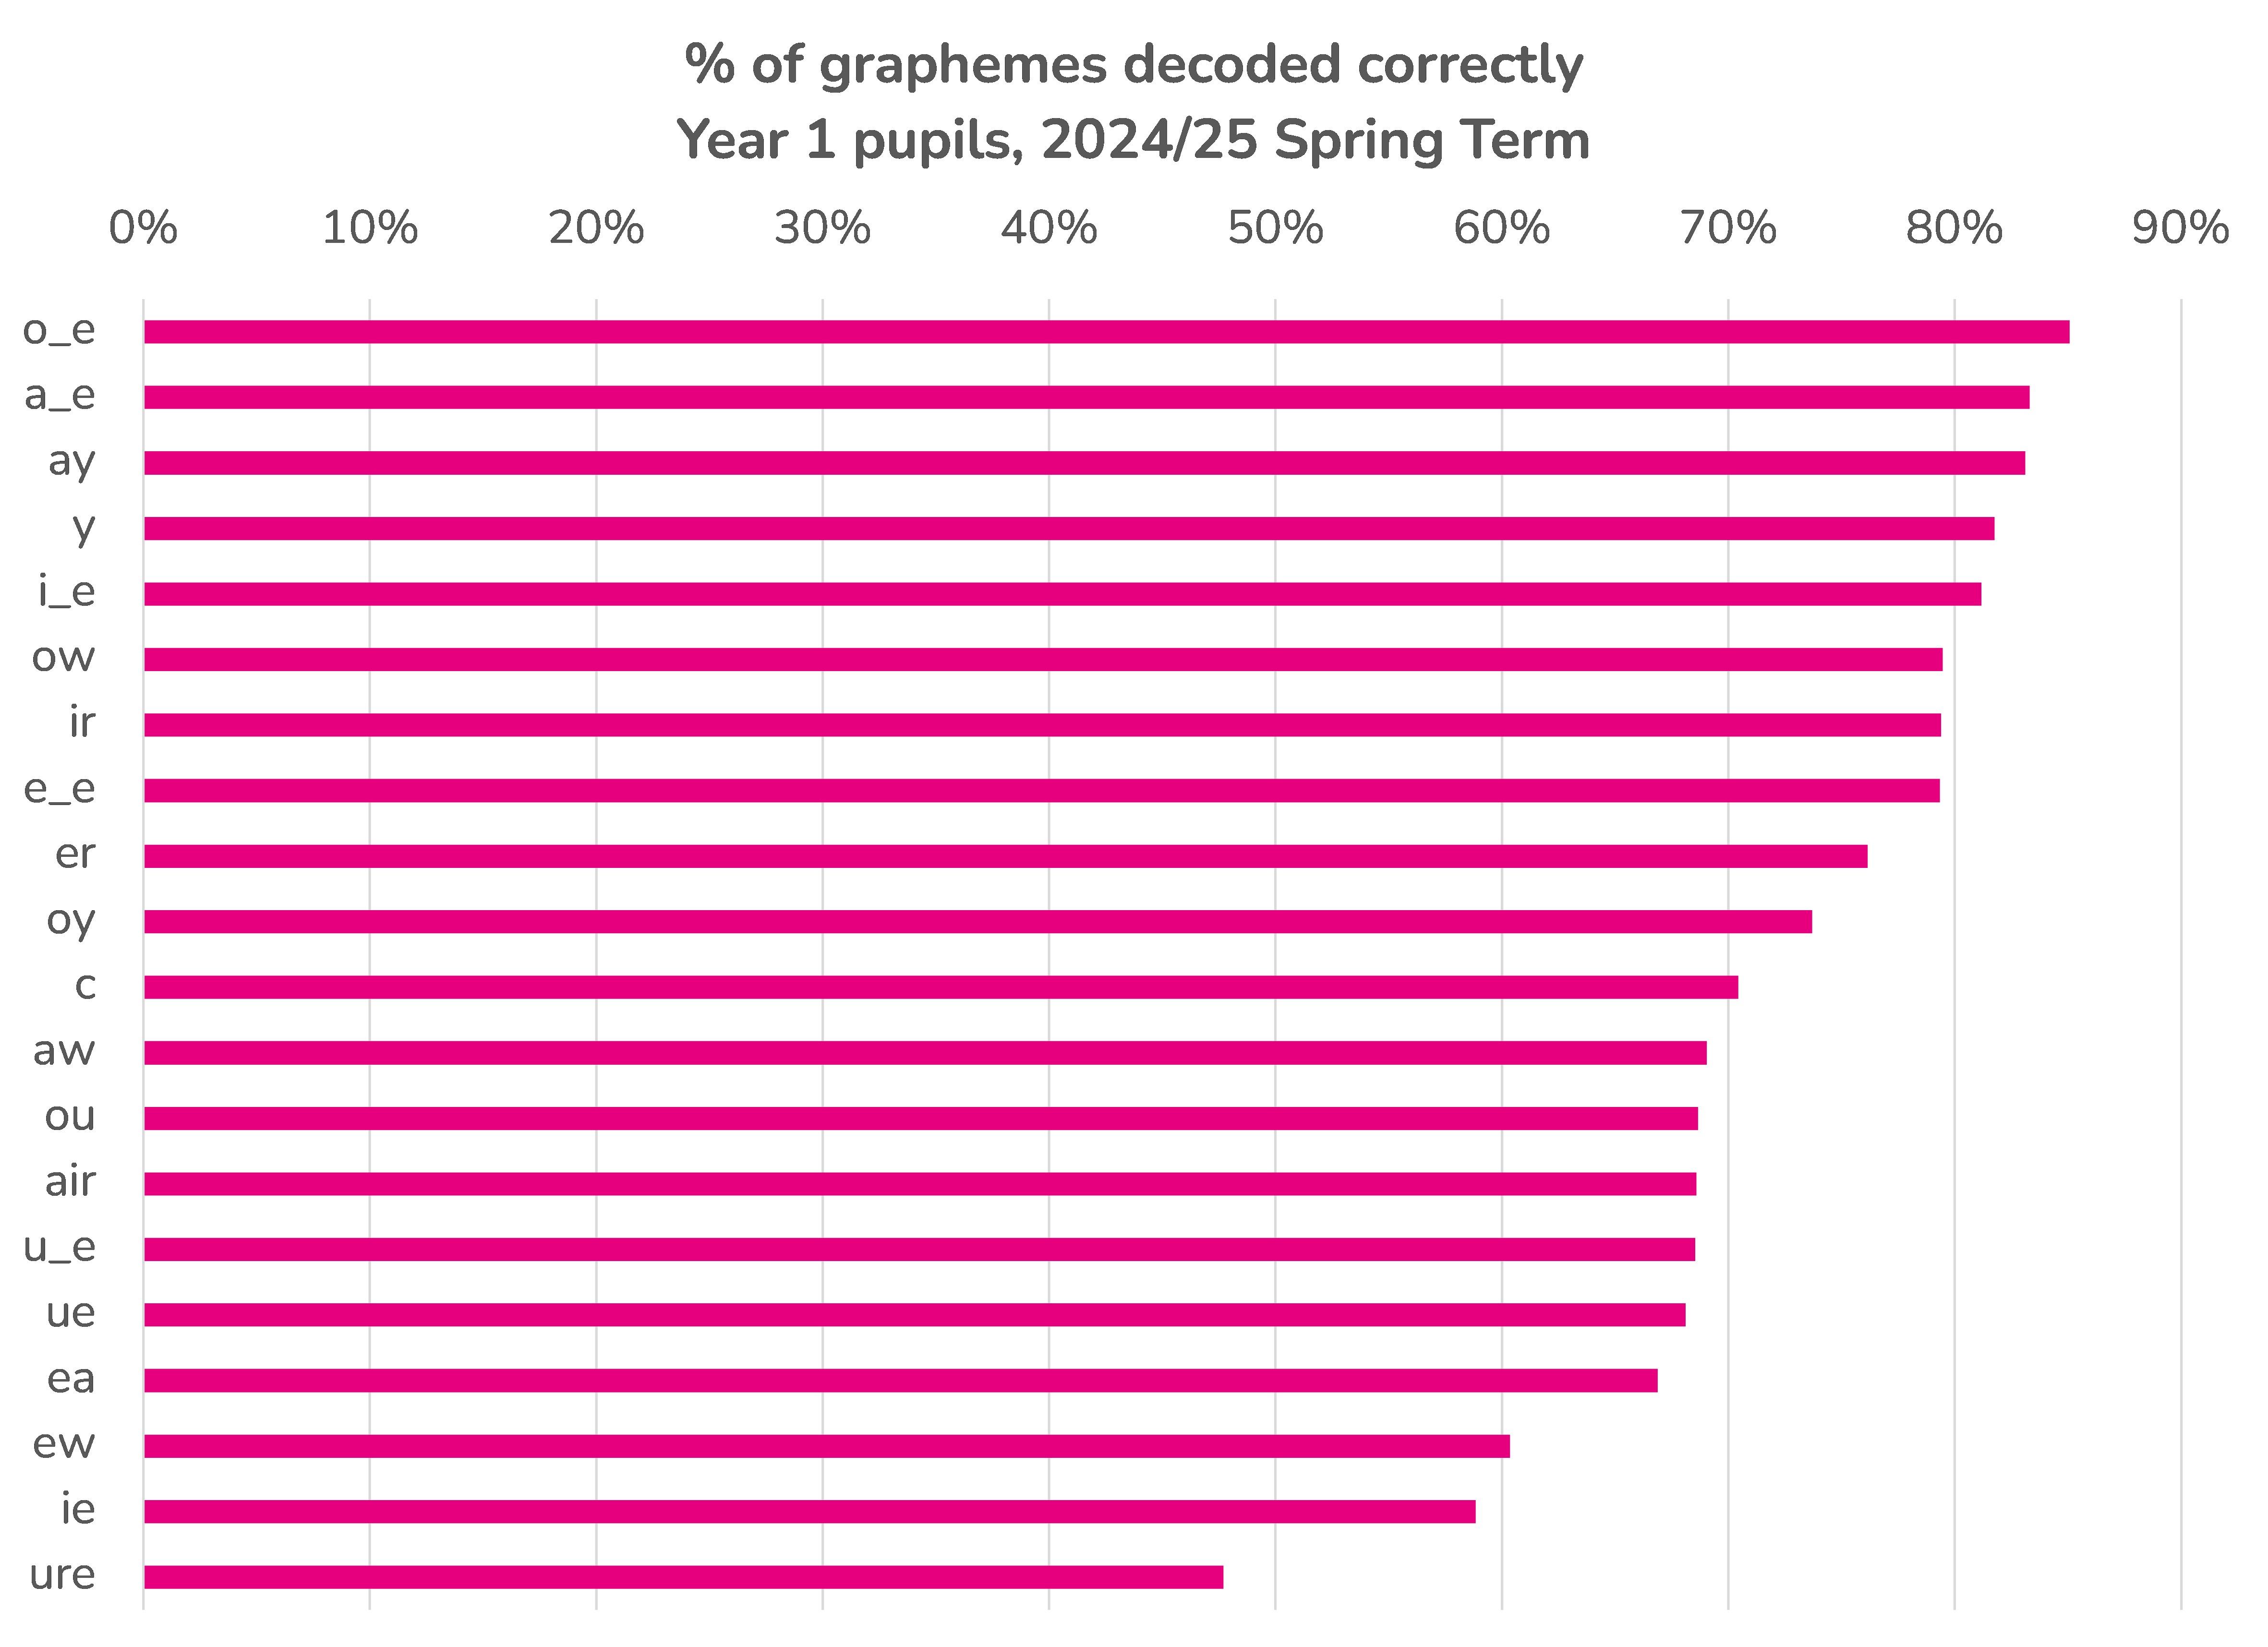
The graphemes ure (e.g. cure), ie (e.g. pie) and ew (e.g. new) were the graphemes least likely to be decoded correctly.
Summing up
At present, 80% of pupils achieve the expected standard in Year 1 phonics.
For the government to meet its stated ambition, an additional 10% of pupils will have to do so. Unless I’ve missed it, no timescale has been put on this.
Summer-born pupils, disadvantaged pupils and those with SEN are less likely to achieve the standard at present. Raising the national average will mean finding ways of improving decoding ability among these groups.
In particular, Year 1 pupils find the graphemes ure and ew difficult to decode.
89% of pupils currently achieve the expected standard by the end of Year 2. To meet its ambition, the government will need to put in place appropriate strategy and action to shorten this timeframe by a year.
As we know from previous work a focus on threshold measures (e.g. a score of 32 or more) results in a focus on marginal (or borderline) pupils. An alternative approach could have been to increase the mean number of correct responses, assuming the level of difficulty for the check as a whole remains consistent from year to year.
Want to stay up-to-date with the latest research from FFT Education Datalab? Sign up to Datalab’s mailing list to get notifications about new blogposts, or to receive the team’s half-termly newsletter.


Leave A Comment