Later this week the Department for Education (DfE) will publish provisional Progress 8 measures for secondary schools for the first time in two years.
Quite how much we will be able to read into measures of school performance given the differential effects of the pandemic on attendance is questionable.
That is on top of existing issues with the measures that we’ve written about here and here [1]
Even then, Progress 8 scores for most schools aren’t that different.
Despite all of that, we still think that Progress 8 isn’t a bad measure. Clearly it’s not perfect. But it is much more equitable to pupils than threshold measures of raw attainment – such as the percentage of pupils achieving 5 or more A*-C grades including English and maths, the dominant measure prior to its introduction.
This is what we conclude in a new working paper we’ve just published. This is an updated version of work we previously published here.
What did we set out to do?
We set out to understand whether the introduction of Progress 8 encouraged schools to work more equitably. By this, we mean whether we could find evidence of schools focusing their efforts less on pupils at the C/D borderline (as it was in those days) and instead spread their effort more evenly across the full range of attainment.
We try to answer this question by analysing how attainment changed for borderline pupils relative to other pupils after the introduction of Progress 8.
Methodological challenges
This was not without its challenges.
Firstly, we do not know with any certainty who the borderline pupils are. The best we can do is to create a proxy group based on attainment at Key Stage 2. We define the borderline group as pupils with a 40-60% probability of achieving grade C or above (later grade 4 or above) in English and mathematics in each year. We then define two other groups, those with a higher than 60% probability and those with a lower than 40% probability.
Secondly, we needed a consistent measure of attainment over time. However, Progress 8 was just one of a series of changes to secondary school accountability introduced since 2010 that substantially affected the types of qualifications taken in schools and the measures of performance that were calculated. We therefore restrict ourselves to grades achieved in GCSE English language and maths.
Prior to 2017, GCSEs were graded A*-G. From 2017, they switched to 9-1 grades. The four grades of the A*-C range were stretched over the five grades of the 9-4 range. Because of this, we used standardised score in GCSE English language and maths as our outcomes [2].
Results
We analysed data over a number of years but for our main results we look at the period 2012 to 2017. 2012 was the year comparable outcomes was (officially) applied to GCSE English and maths results. 2017 was the latest year of data available to us for the project.
Progress 8 was introduced in 2015/16 but had been announced in October 2013 to give schools sufficient time to plan for its introduction. We thought we might see schools begin to anticipate its introduction [3].
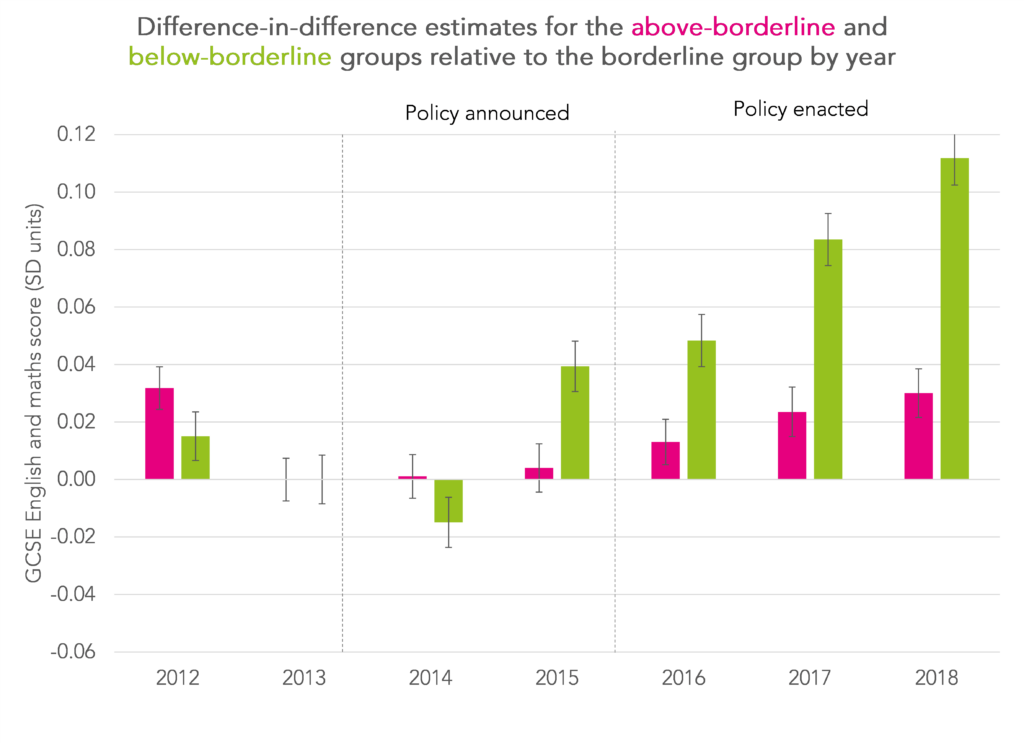
We set out our methodology in more detail in the paper but, briefly, we analyse the change in standardised score in English and maths for pupils in the above-borderline and below-borderline groups relative to the borderline group before and after the introduction of Progress 8. Results are summarised in the chart below.
The effects are small but not trivial: our headline findings show a post-reform gain of 0.01 standard deviations (SD) in GCSE English and maths for the above-borderline group and 0.07SD for the below-borderline group.
Moreover, the effect for the below-borderline group increased in each of the first three years since it was introduced.
0.07SD means very little in the real world. In 2018 it translates 0.25 points in English and maths scores (equivalent to an eighth of a grade in both subjects).
Implications
Our results are consistent with the view that some schools had reacted to the previous regime of high implicit incentives for the exam results of students at the GCSE grade C/D borderline. Once that incentive was removed, the borderline group appeared to make less relative progress compared to other groups. Or put another way, pupils with lower prior attainment tended to make more relative progress compared to the borderline group.
We are, however, cautious in presenting these results. In the paper, we note the issue of trends subsequent to announcement but before implementation. We therefore judge the results to be supportive of the hypothesis but not clinching.
We are also aware that the results may have been sensitive to some of our modelling choices. That said, we ran a range of alternative models making different choices but these made little substantive difference.
The change to the accountability framework was far-reaching and had other implications beyond just exams. The machinery of school accountability also now incentivises schools to enter pupils for particular qualifications. Just as the Government response to the Wolf Review had done two years earlier, the introduction of Progress 8 led to large changes in the types of qualification for which pupils were entered as schools increasingly began to fill the eight qualification ‘slots’ available in the new accountability measures. In most cases, this was a result of switching away from other types of qualification that were not eligible for inclusion in the accountability measures.
Want to stay up-to-date with the latest research from FFT Education Datalab? Sign up to Datalab’s mailing list to get notifications about new blogposts, or to receive the team’s half-termly newsletter.
This project was funded by the Nuffield Foundation, but the views expressed are those of the authors and not necessarily those of the Foundation. Visit www.nuffieldfoundation.org.
- See also this open-access paper in BERA Review of Education
- We standardise scores based on the national mean and standard deviation for each year
- A pilot Progress 8 measure was published in 2014/15 involving 327 schools


Dave, I work for NPP and have begun to consider whether the double counting of maths and Eng in the P8 calculation is in fact a factor in reducing curriculum offer. In effect marginalising more of the creative subjects. Has Datalab ever calculated what P8 would look like if we didn’t double count those two subjects? I suspect it might appear marginal but I wondered whether you thought it might be a limiting factor.
Hi Frank. Good to hear from you. We’ve spoken in the past. It’s interesting to think about what might happen if they weren’t double-counted. 1) Will fewer pupils be entered for English literature? 2) Will less curriculum time be devoted to English and maths? If so, this could result in entries in other subjects increasing. We’ve not looked at this specifically as it’s not straightforward to model how schools would respond. But we do have something on creative subjects in the pipeline.