What difference does a year make? Part 2
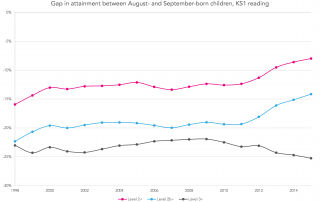
This is part two in a series of posts exploring trends in attainment over time by month of birth. Other posts in the series can be found here. In the first part in this series we looked at how attainment at age seven – Key Stage 1 – varied with pupils’ month of birth. Overall, [...]