This is part four in a series of blogposts exploring long-term disadvantage. Other posts in the series can be found here.
At the start of the summer we showed that there are substantial differences in the attainment and progress of pupils who have been disadvantaged at some stage.
The main findings of these earlier posts were that:
- the impact of disadvantage varies according to the number of times that a pupil has been entitled to free school meals throughout their time in school;
- pupils FSM-eligible for 80% or more of their time in school present the highest level of challenge, in terms of closing attainment gaps;
- there are variations between minority ethnic groups, with disadvantage having most impact upon white and black Caribbean pupils;
- there are a small number of schools where the pupils from disadvantaged backgrounds are making very good progress.
But how much improvement would we see if all schools did as well as two case study schools which we looked at previously, Pipworth Primary and Sheffield Park Academy?
And should Pupil Premium funding take account of the level of challenge which a school faces in closing attainment gaps – i.e. characteristics of that school’s disadvantaged pupils?
How much improvement might we see?
As seen in earlier blogposts, our two case study schools are helping disadvantaged pupils to make exceptional progress. We can see this by comparing the value-added scores in these schools with national figures.
In the following tables, data is based on outcomes in 2013, 2014 and 2015, aggregated together.
For Key Stage 2, expected standards for 2013 and 2014 have been calculated using FFT calculations which convert national curriculum levels into scaled scores [PDF]. Value added (VA) scores are based on using prior attainment from Foundation Stage (for KS2 VA) and Key Stage 2 (for KS4 VA).
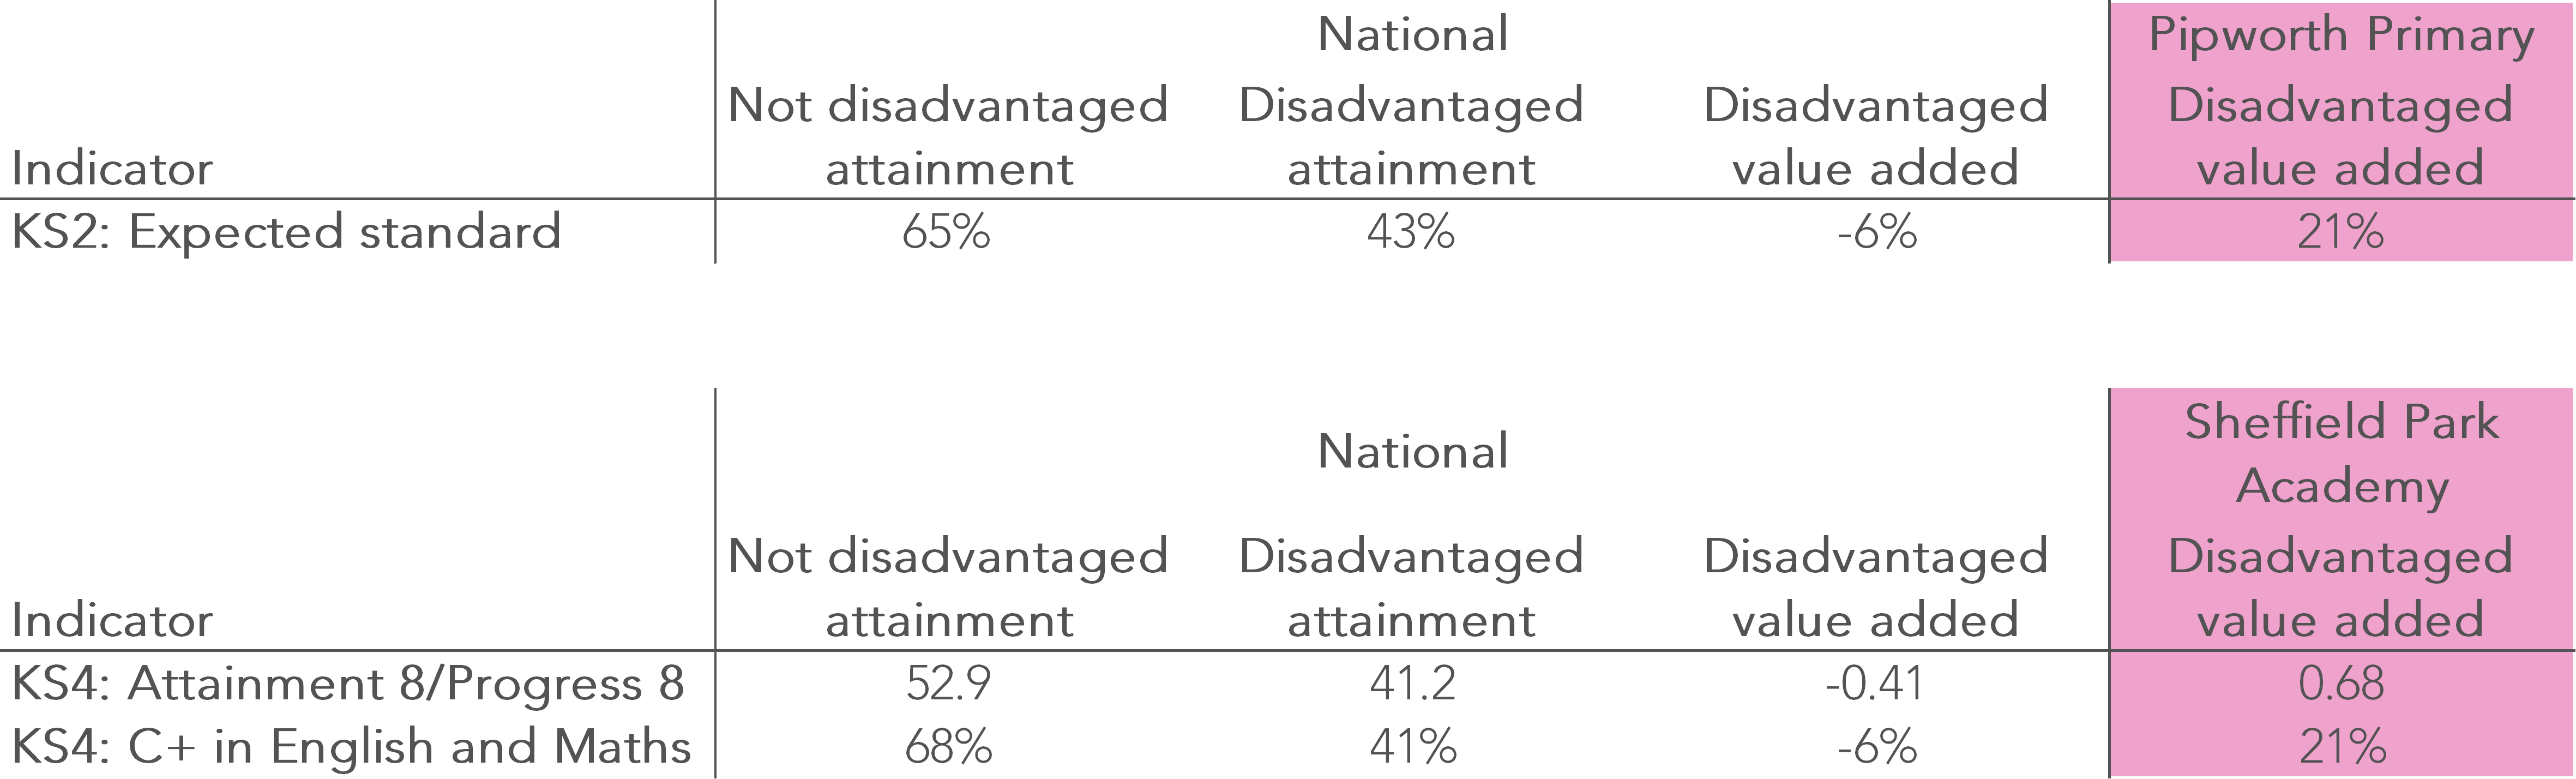
If all disadvantaged (Pupil Premium) pupils made the same progress as achieved by our two case study schools, we would find that 70% of disadvantaged pupils would reach the expected standard at Key Stage 2 – actually 5% higher than that for other pupils![1]
At Key Stage 4, the exams regulator, Ofqual, has a policy called comparable outcomes, which ensures that results stay in line from year-to-year.
Ignoring that momentarily, if all disadvantaged pupils nationally made the same progress as those at Sheffield Park Academy, attainment of a C or higher in English and maths for disadvantaged pupils would rise to 68%. That is, the same as for other pupils. Their Attainment 8 score would increase to 52.1, just below that for other pupils.[2]
In other words, if all schools did as well as our case study schools then the Pupil Premium gap would be eliminated.
If it did happen, would we believe it, or would we think that examinations had just got a whole pile easier?
Under Ofqual’s comparable outcomes policy, if the exams regulator were able to satisfy themselves that there had been a genuine rise in underlying standards, the KS4 scenario outlined above could arise.
Unless Ofqual were able to reach that conclusion, however, an increase in the attainment of the disadvantaged group could only come at the expense of the non-disadvantaged group.
Pupil Premium funding – reflecting the level of challenge
We know from previous work that the attainment and progress of disadvantaged pupils varies substantially if we take account of how many times they have been FSM throughout their time in school.
The attainment gap for pupils who have been FSM-eligible just once in six years is about half that of pupils who have been FSM-eligible on every occasion i.e. 18 school census collections in six years. (In both cases the attainment gap is measured against the group of pupils who have never been FSM-eligible.)
So, the level of challenge in closing the gap will vary between schools depending upon variations in the level of disadvantage of their Pupil Premium pupils.
At the moment the additional funding received by schools is the same for each Pupil Premium pupil: £1,320 for primary and £935 for secondary. What might happen if we take account of the level of challenge?
We could do this by differentiating the funding according to the percentage of times that each pupil has been FSM:

The figures above would, nationally, require the same overall level of expenditure as the current system.
They reflect the level of challenge, with funding for the most disadvantaged pupils being twice that for the least disadvantaged.
What would happen if we applied these figures? Looked at regionally, then we find that the changes are relatively small – there would be some change, but no change larger than 5%, as the below chart shows.
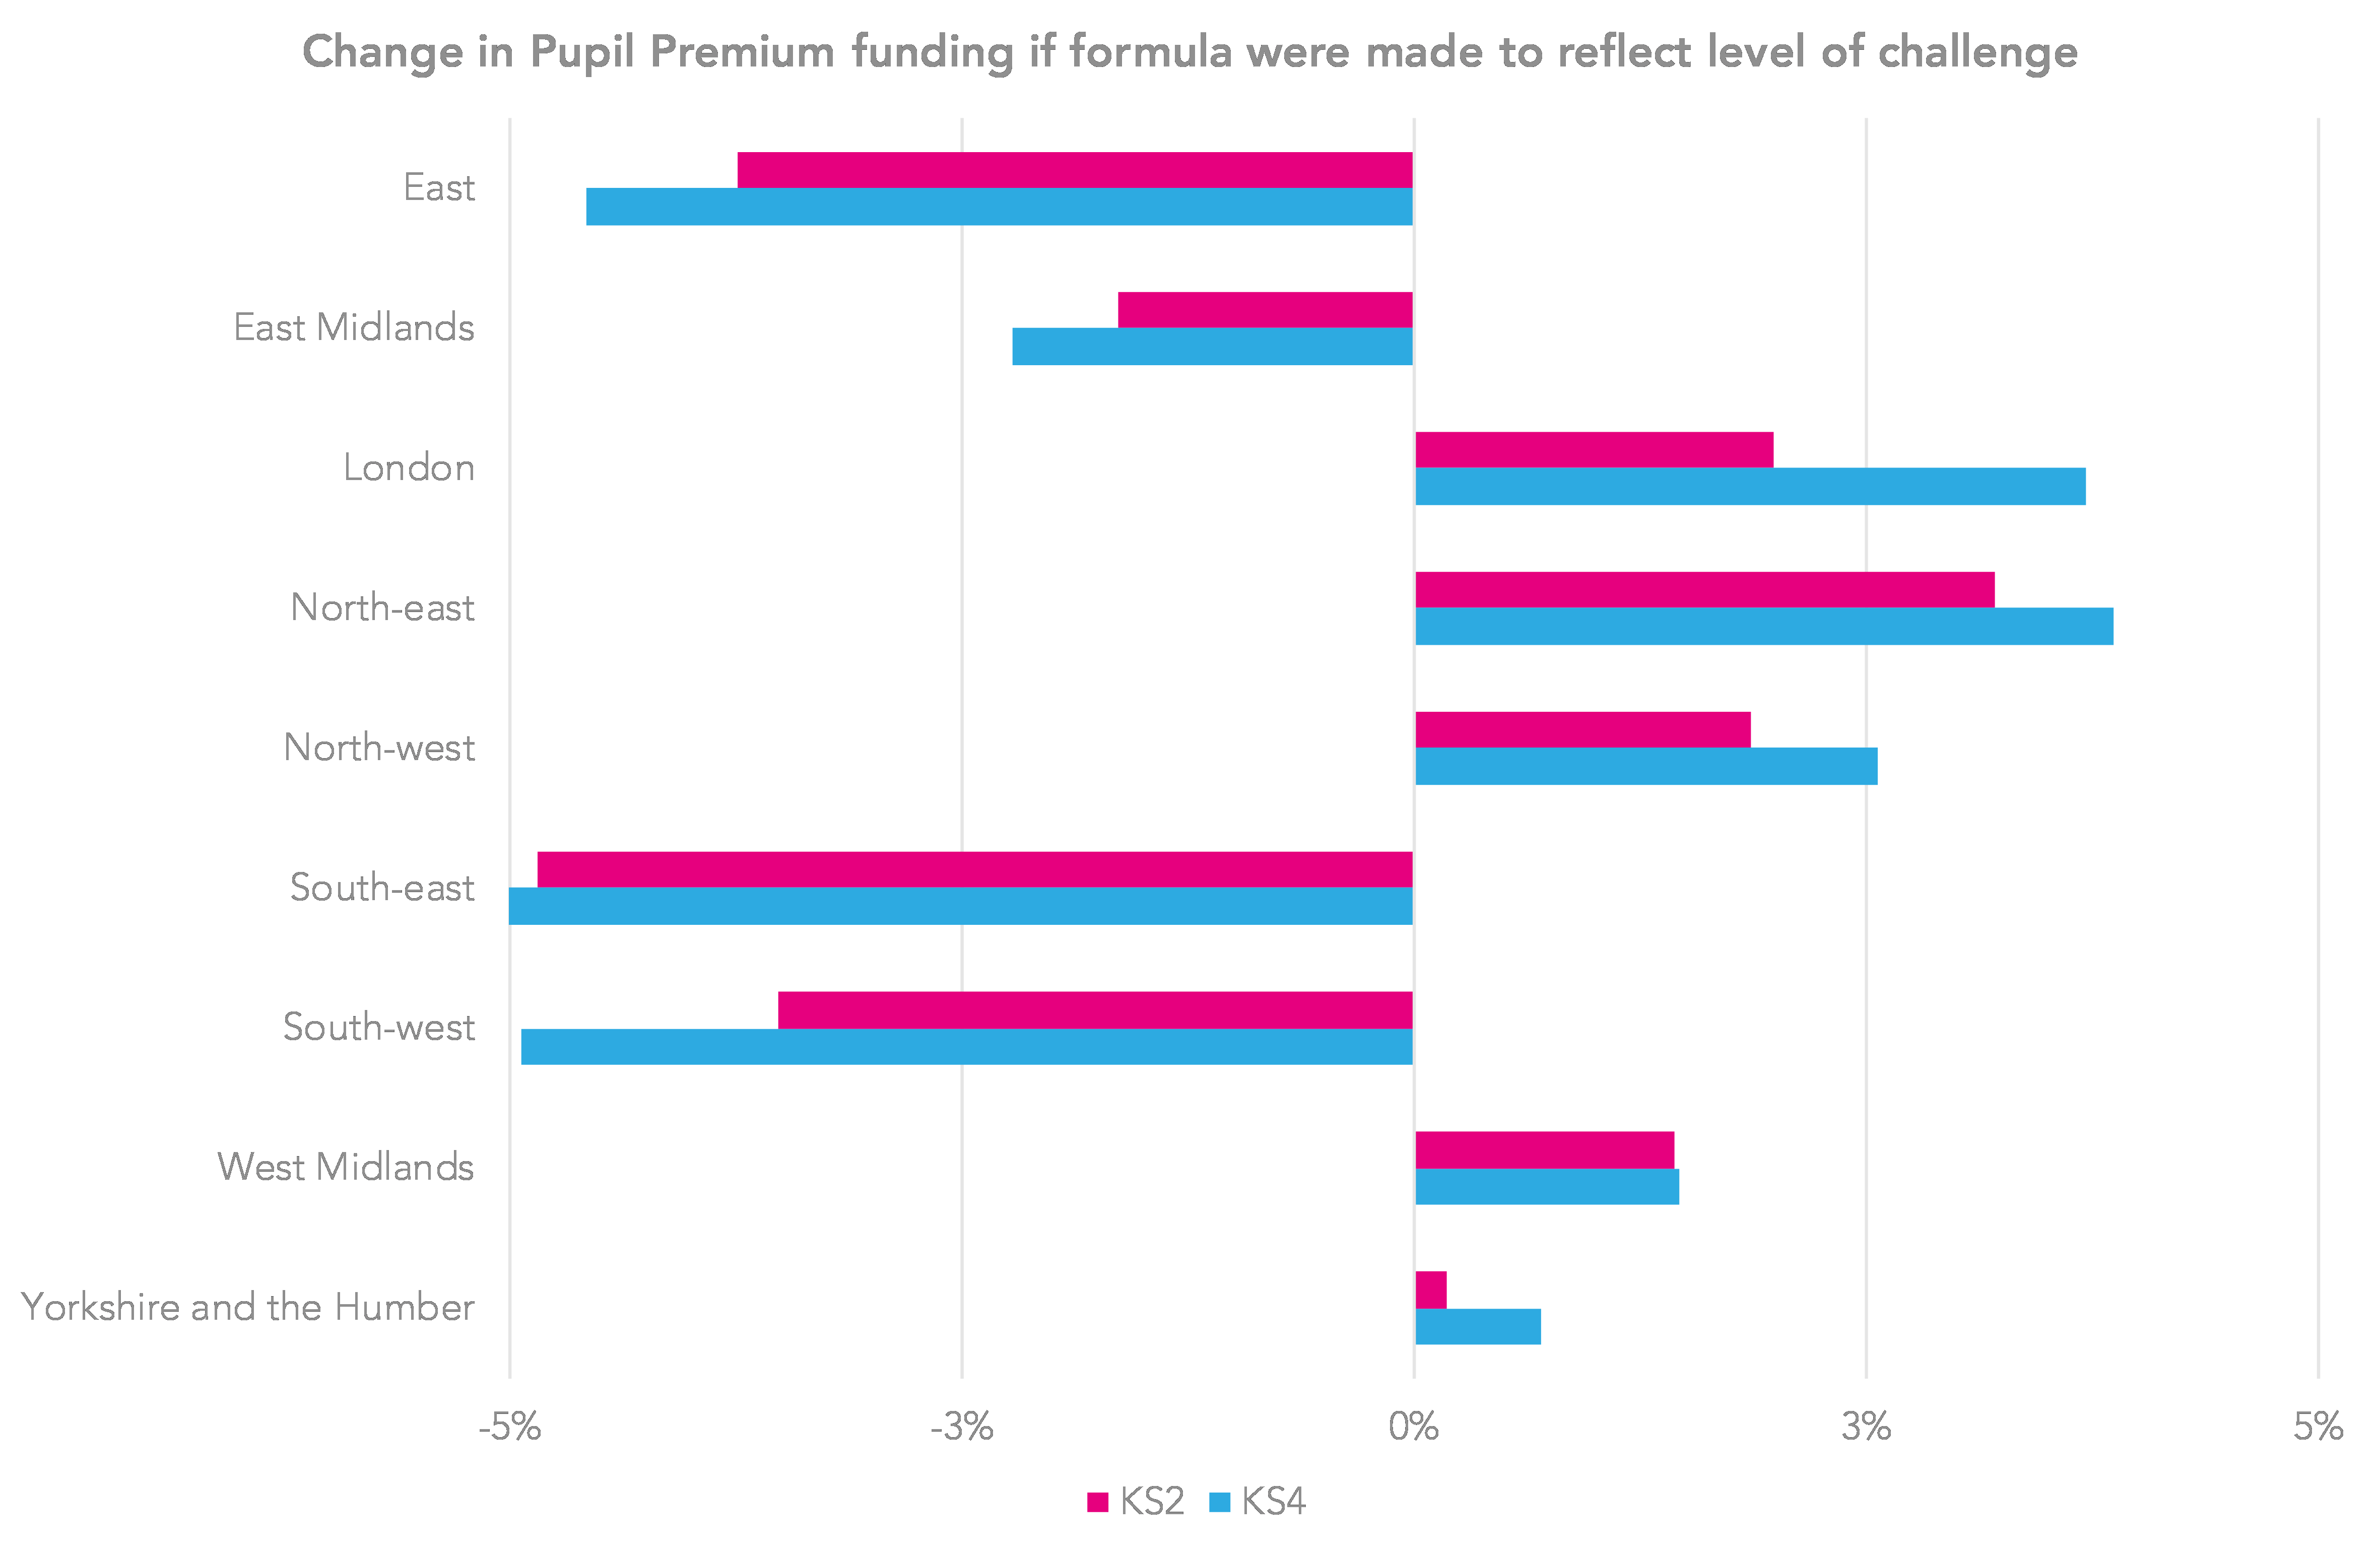
The north-east, north-west and London would be the biggest gainers, with the south-east and south-west the biggest losers.
If we look at individual schools, as we might expect, we do find more variation:
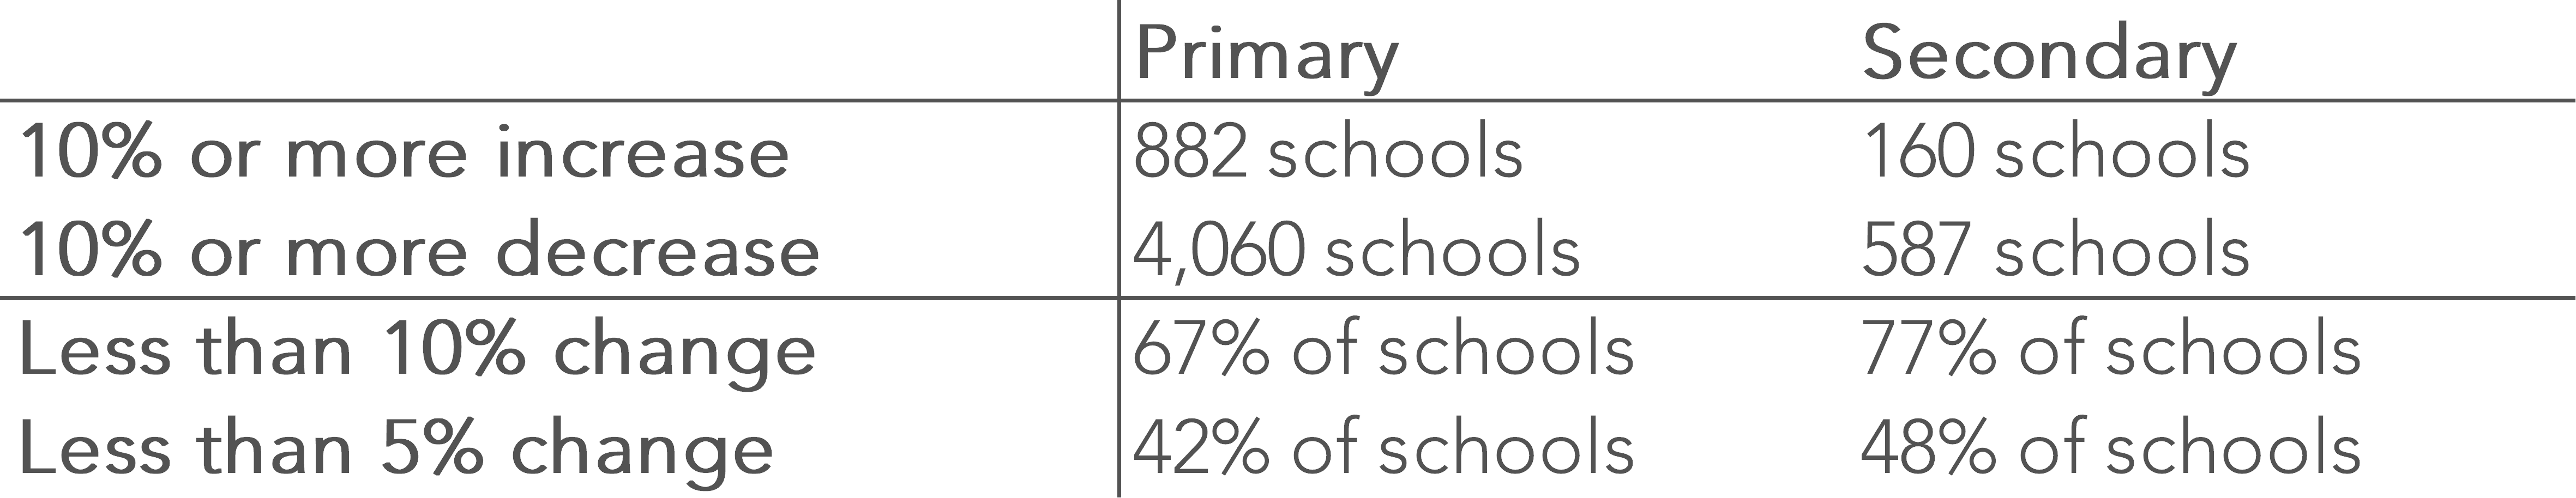
Schools with larger (10% or more) increases in funding have higher than average proportions of Pupil Premium pupils – that is why fewer schools gain than lose.
And whilst nearly 50% of schools would see little change (less than 5%), others would see substantial changes – with four secondary schools and 52 primary schools seing an increase of over 20%.
An alternative might be to keep funding the same and compare like with like when evaluating and inspecting progress towards closing gaps. This, though, runs the risk of accepting lower attainment for more disadvantaged pupils.
My vote would be to make the funding reflect the level of challenge – and find mechanisms to help more schools succeed as well as Pipworth, Sheffield Park, and other schools like them.
Mike Treadaway will be speaking on long-term disadvantage, and, separately, on English as an additional language, at the researchED 2017 national conference on Saturday 9 September.
Want to stay up-to-date with the latest research from Education Datalab? Sign up to our mailing list to get notifications about new blogposts, or to receive our half-termly newsletter.
1. If disadvantaged pupils nationally had Pipworth’s value added score of 21% rather than -6%, attainment for this group would be 70% (43%-(-6%)+21%) rather than the 43% it is currently.
2. Following the approach in the above note, if disadvantaged pupils nationally had Sheffield Park’s English and maths A*-C value added score of 21% rather than -6%, attainment for this group would be 68% (41%-(-6%)+21%) – the same as that for non-disadvantaged pupils. The national Attainment 8 figure, following the outcomes achieved by Sheffield Park, would be 52.1 (41.2-(-0.41×10)+(0.68×10)).


Great paper, the point about comparable outcomes is crucial until that is addressed policy makers have to answer ‘if you wish the disadvantage gap to close which other groups do you wish to do worse?’