This is part six in a series of blogposts exploring long-term disadvantage. Other posts in the series can be found here.
In previous blogposts in this series we have shown that the impact of disadvantage on attainment and progress varies according to the percentage of their time in school that a pupil has been eligible for free school meals (FSM).
We have also shown that the impact of disadvantage varies between different ethnicity groupings – with the impact of disadvantage being lower than average for most minority ethnic groups, particularly where these pupils form a majority of the cohort.
We also concluded that much of the difference in attainment and progress for disadvantaged pupils in the north when compared to London can be explained by taking these factors into account.
So, if differences in school effectiveness between the north and London are smaller than we thought, how is it that the attainment of disadvantaged pupils in the north is nearly one grade lower per subject? Well, that’s how it was reported in the news. More correctly, 6.5 Attainment 8 points is around two-thirds of a subject, but that is still a large difference.
Let’s look at where pupils with different characteristics are located across England, focusing on two indicators:
- the proportion of long-term disadvantaged pupils in the overall Pupil Premium cohort. As in previous posts in this series, long-term disadvantage is defined as being FSM-eligible for 90% or more of a pupil’s total time in school.
- the number and proportion of schools where long-term disadvantaged pupils form more than 20% of the school’s Pupil Premium pupils.
The table below shows the first of these indicators for Year 11 pupils over the period 2014 to 2016, and it also shows the proportion of pupils in one of the ethnicity groupings that we classified as seeing a higher than average impact of disadvantage in an earlier post (white pupils are the largest element of the high impact group).
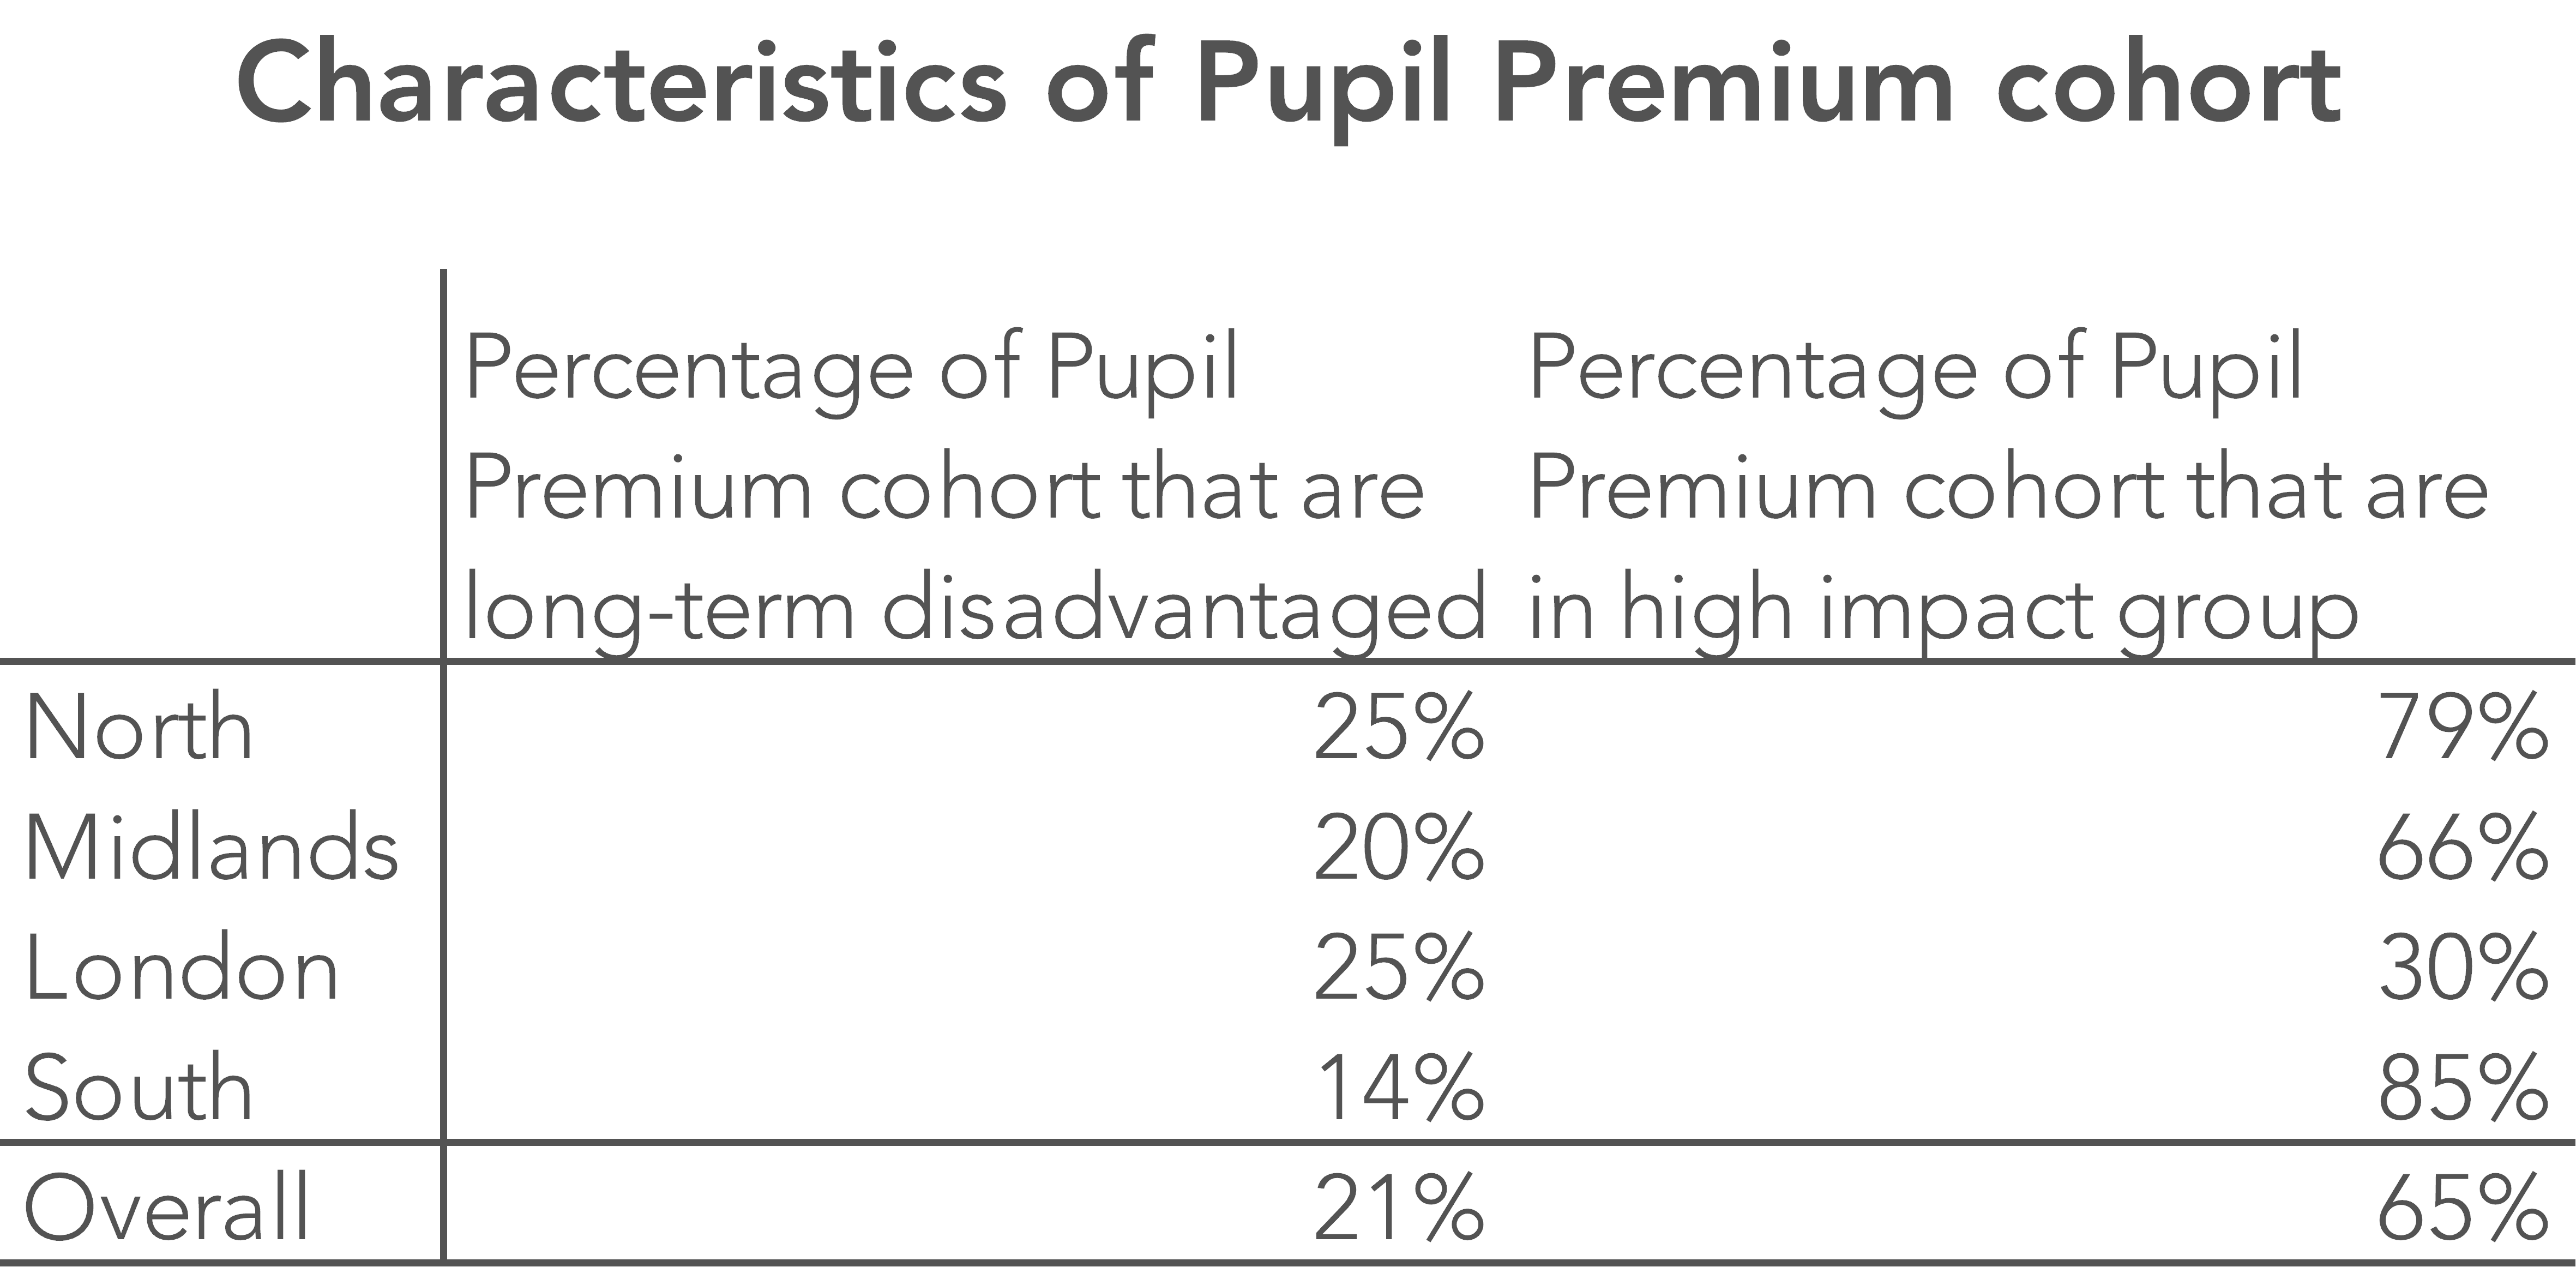
So the north has the same percentage of long-term disadvantaged pupils as London, and a higher proportion than the Midlands or south.
But differences are more apparent when we look at the percentage of pupils in the high impact group. In the north, 79% of Pupil Premium pupils are in the high impact group, whereas for London the figure is 30%. This reflects the high proportion of minority ethnic pupils in London, the majority of which are in the low impact group.
The second table, below, shows the percentage of schools where long-term disadvantaged pupils represent 20% or more of their Pupil Premium cohort. Data is shown for schools with 30 or more Pupil Premium pupils over a three-year period:
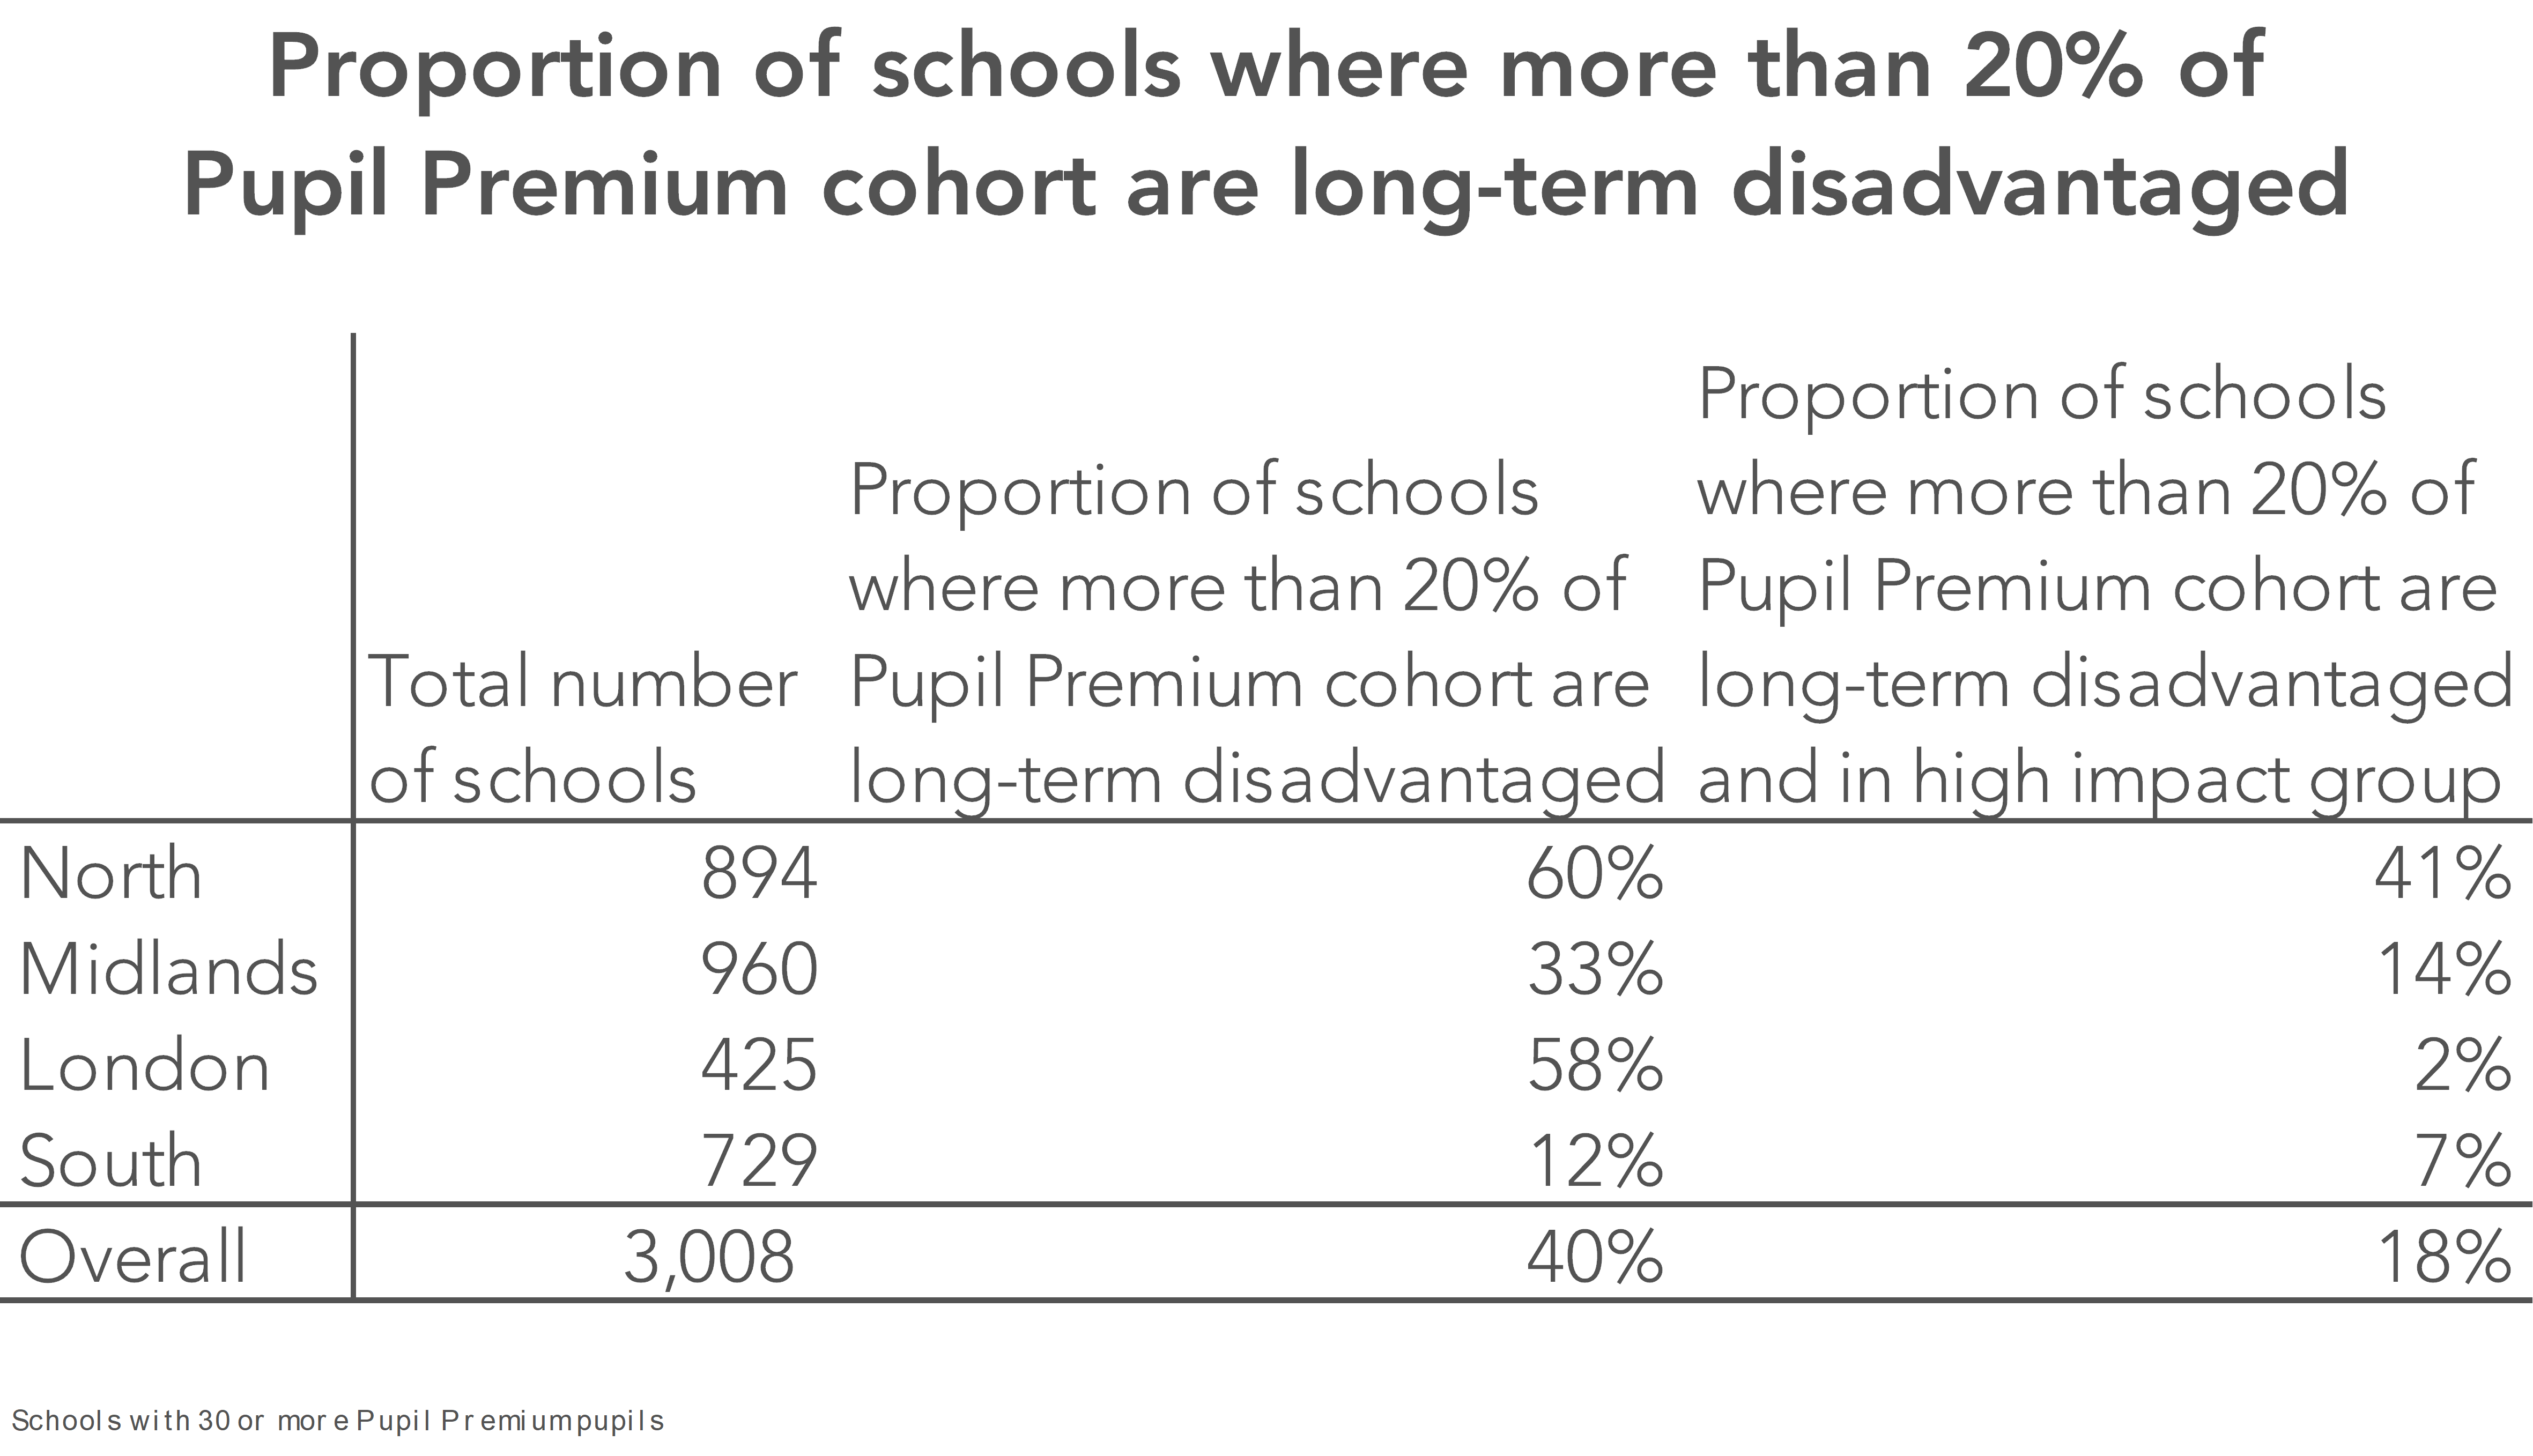
London and the north have the highest percentage of schools with over 20% long-term disadvantaged pupils, but, when we look at high impact (mainly white) long-term disadvantaged pupils, the north has a much higher percentage than any other region.
The third table, below, shows how the proportion of low impact (most minority ethnic) pupils varies between regions:
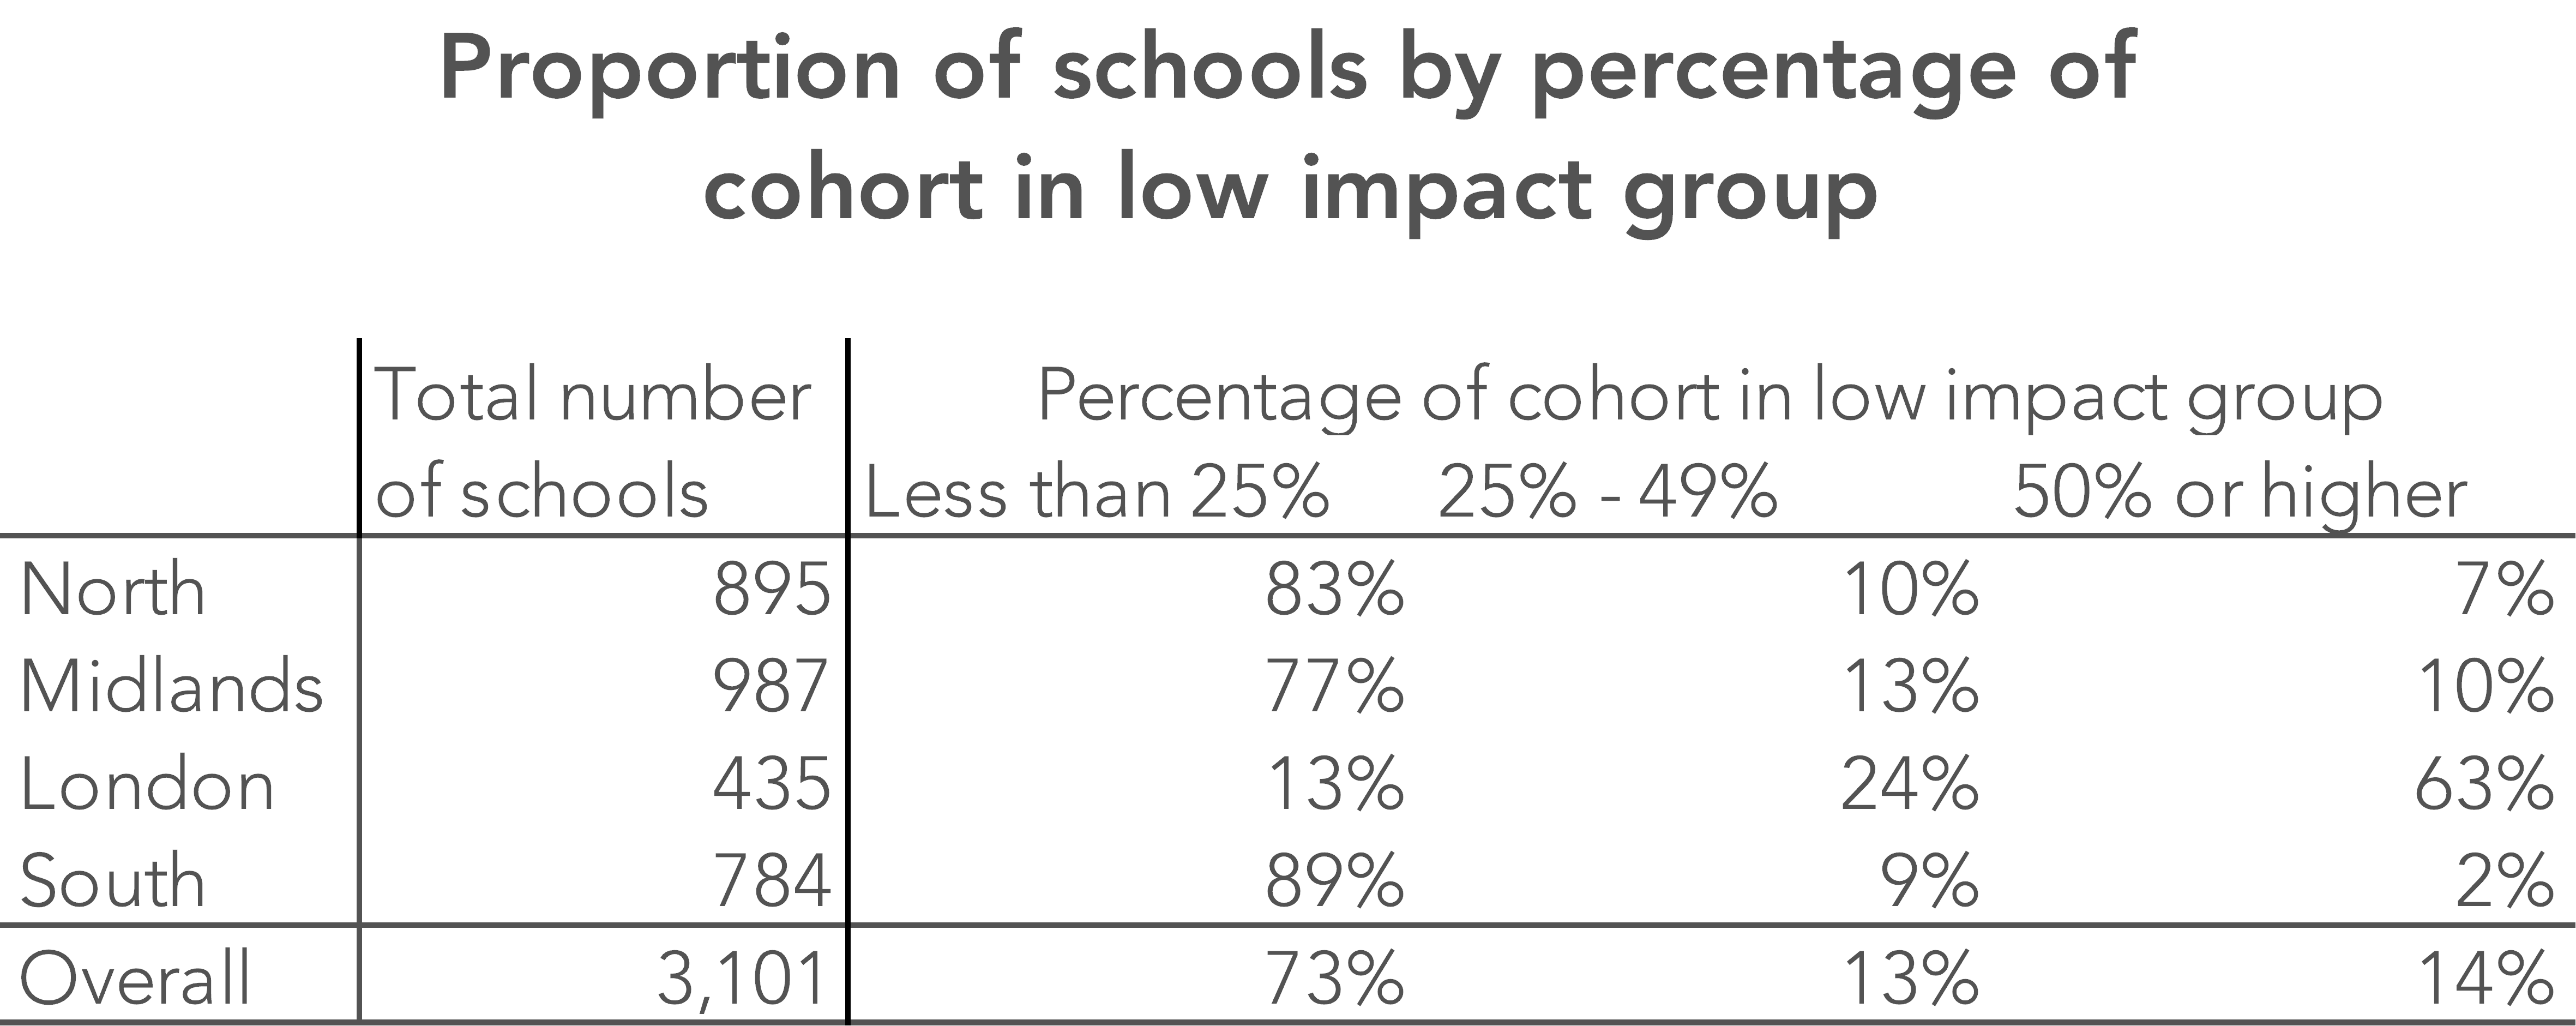
London has a far higher percentage of schools where minority ethnic pupils form 50% or more of the cohort and it is in these schools like this – whether in London or not – that disadvantaged pupils make better progress than in other schools.
From our analysis it is clear that the greatest challenge to closing the Pupil Premium gap lies with pupils who are:
- the most disadvantaged – and particularly those FSM-eligible for 90% of their time in schools;
- in groups where the impact of disadvantage is high: mainly white pupils;
- in schools where the proportion of minority ethnic pupils in the cohort is lower than 50%.
The north has higher than average proportions in all of the above categories.
We might, therefore, conclude that the recommendations for additional funding made in the Northern Powerhouse Partnership report are justified – but that they are justified more on the basis of demographic differences rather than differences in school effectiveness.
It does not mean that schools in the north cannot learn from London. There is much to learn, especially in the performance of minority ethnic groups and in the gains that were made in London during the London Challenge years.
It might, however, be helpful if it were recognised that there are some schools in the north doing well with their most disadvantaged pupils.
In 2016 there were 1,162 schools in England with six or more long-term disadvantaged pupils in our high impact group, and where white pupils formed the majority of their Pupil Premium cohort.
In 80 of these schools, the Progress 8 score for these pupils was average (zero) or higher – and 38 of these 80 schools were in the north!
Want to stay up-to-date with the latest research from Education Datalab? Sign up to our mailing list to get notifications about new blogposts, or to receive our half-termly newsletter.


Is this long term disadvantaged something that could be included in FFT then ? Similarly to the ‘ever FSM’ flag if there’s clear evidence of this group performing differently it would be useful to see it in FFT no ?
Thanks for your comment. Yes this is something we’ll be looking to include in Aspire in the near future at pupil level and possibly as a separate report for schools.