The mystery of why London’s schools improved so much in the early part of the century remains an enduring puzzle.
As far as we can see, attainment gaps between London and the rest of England are more a reflection of the areas that they serve than the effectiveness of the schools in each region. This echoes the work of Simon Burgess [PDF].
That said, some groups of pupils and some types of schools have improved more than others over the last twenty years, and London (as well as Birmingham and Manchester) seems to have disproportionately benefited.
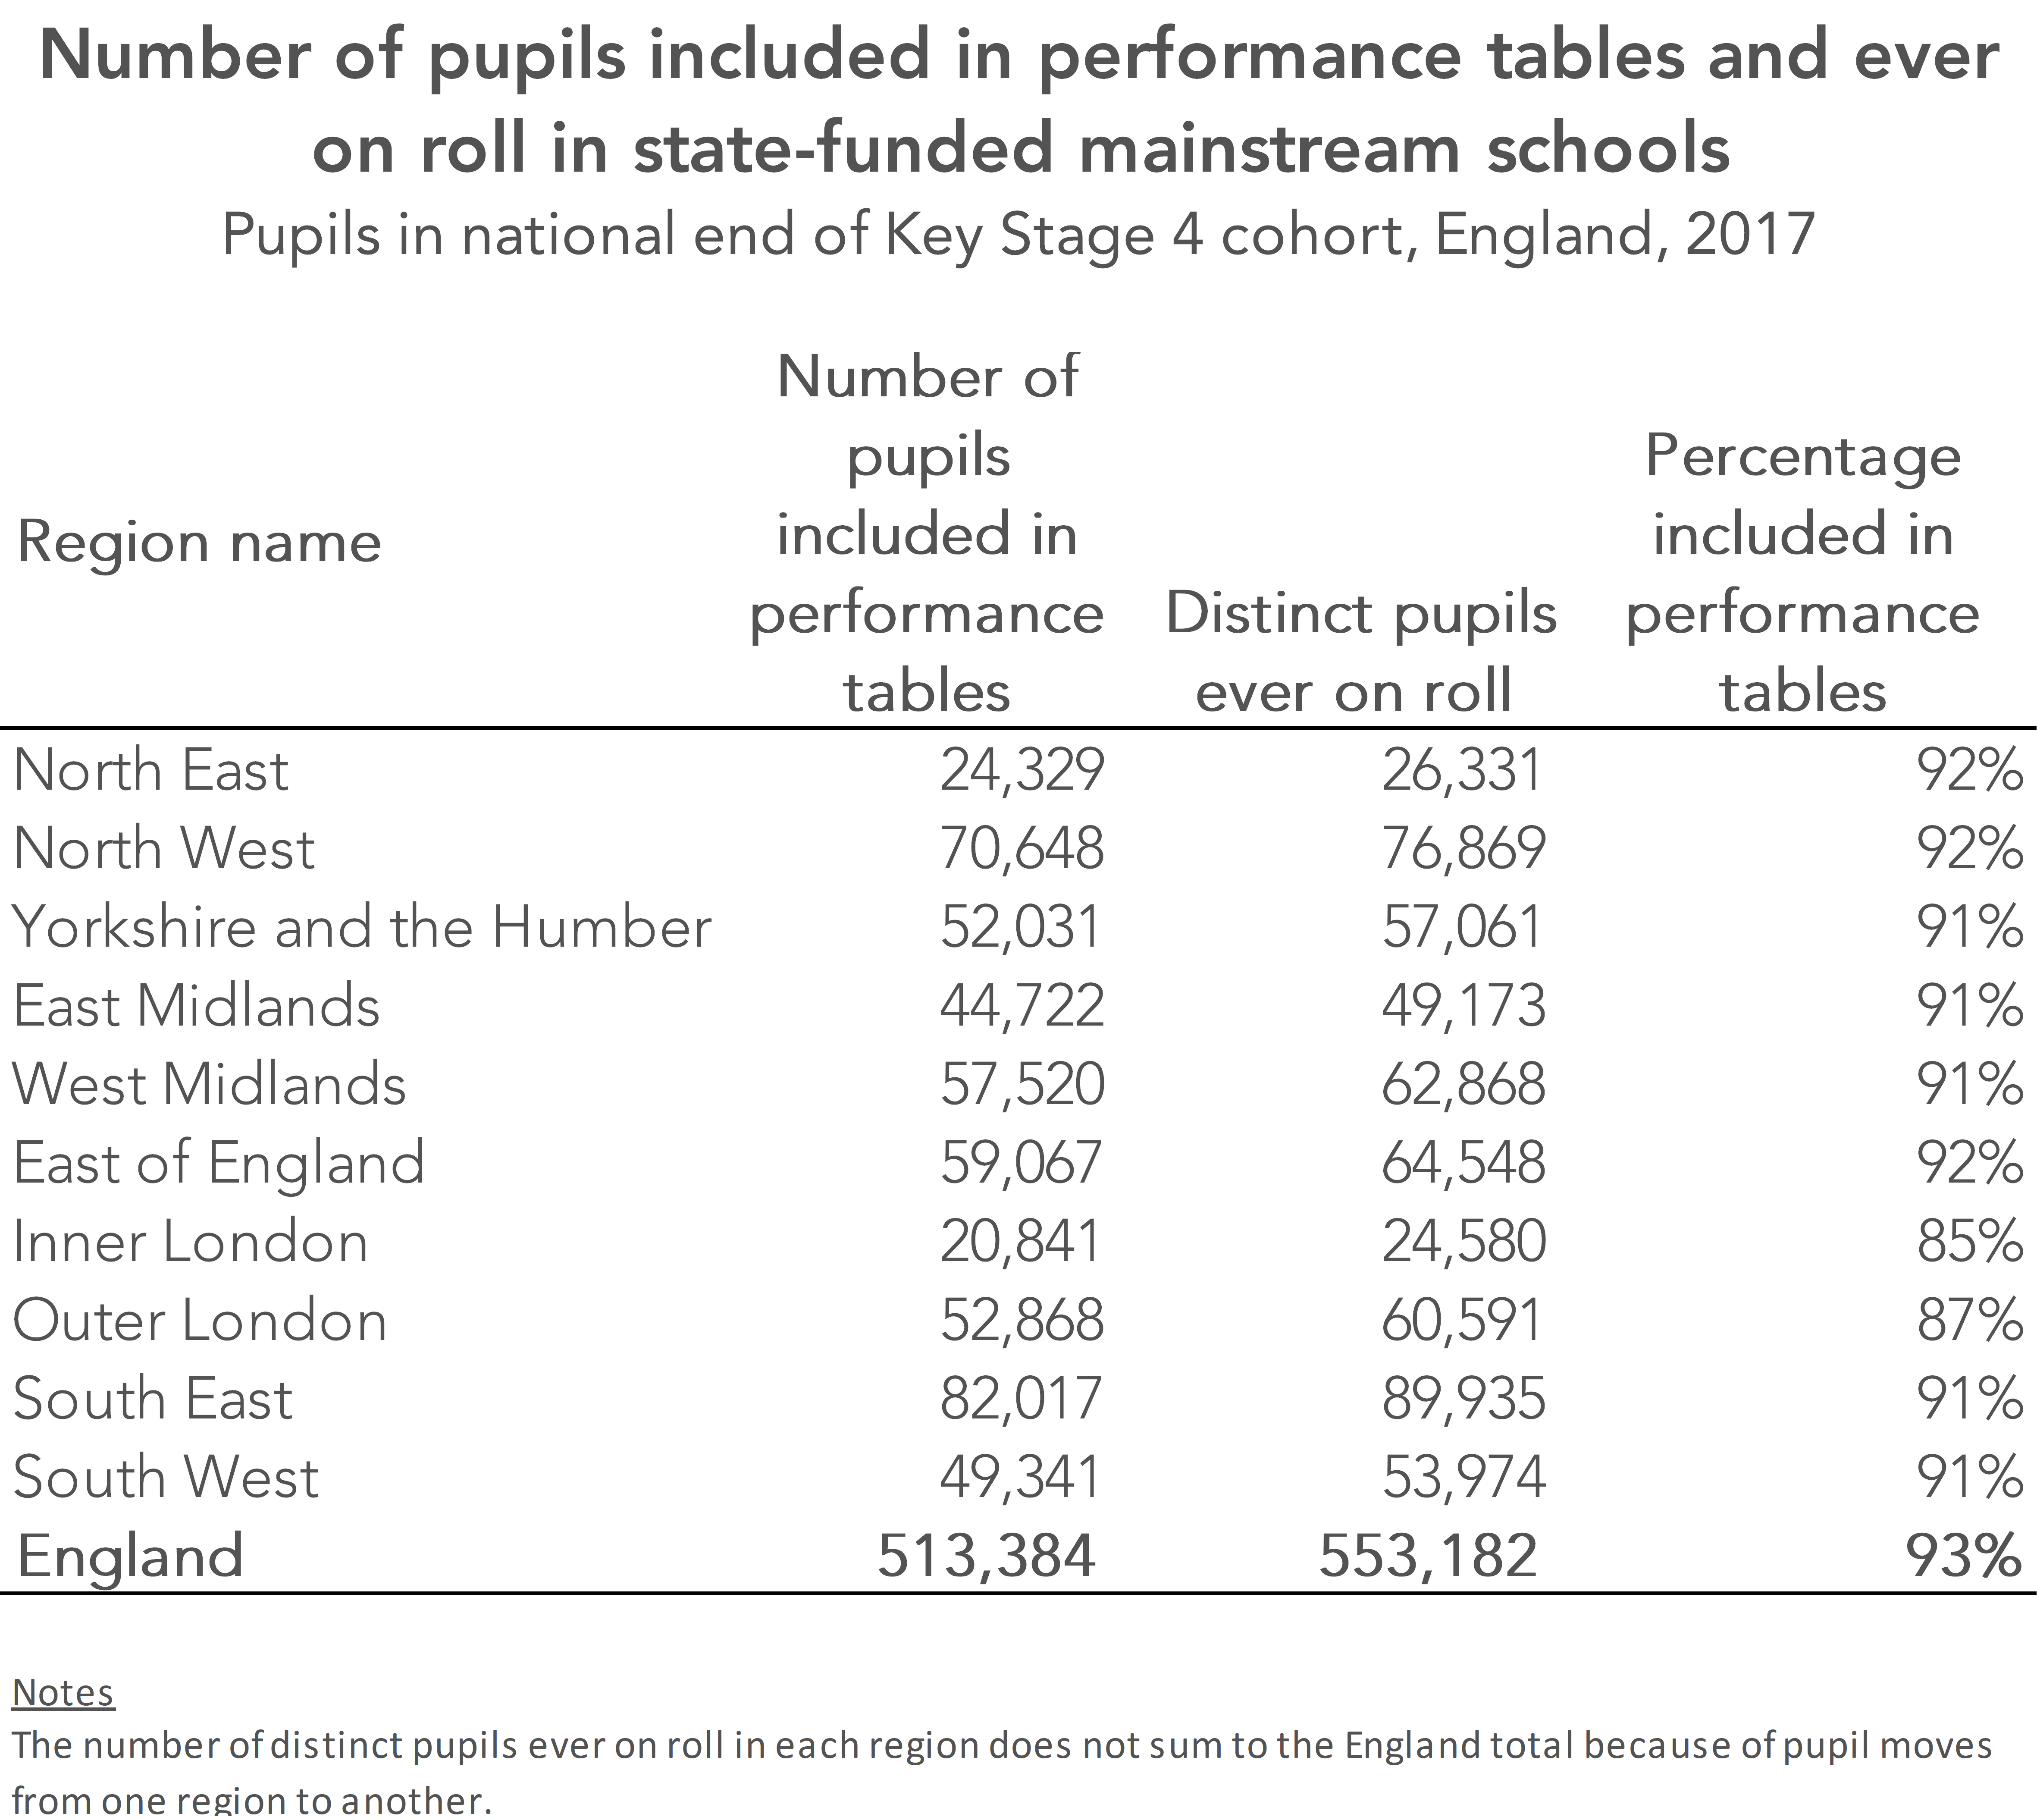
But all this analysis only considers pupils who reach the end of Key Stage 4 in state-funded schools. What about those who leave?
Schools in London appear to lose more pupils than other areas of the country. For example, 15% of pupils in the 2017 Key Stage 4 cohort who were ever on-roll in a state-funded mainstream school in inner London were not included in the results of such a school.
Maybe we should not be surprised at increased levels of population turnover in the capital, perhaps arising from domestic and international economic migration. In fact, schools in Birmingham (13%) and Manchester (15%) also had higher levels of leavers.
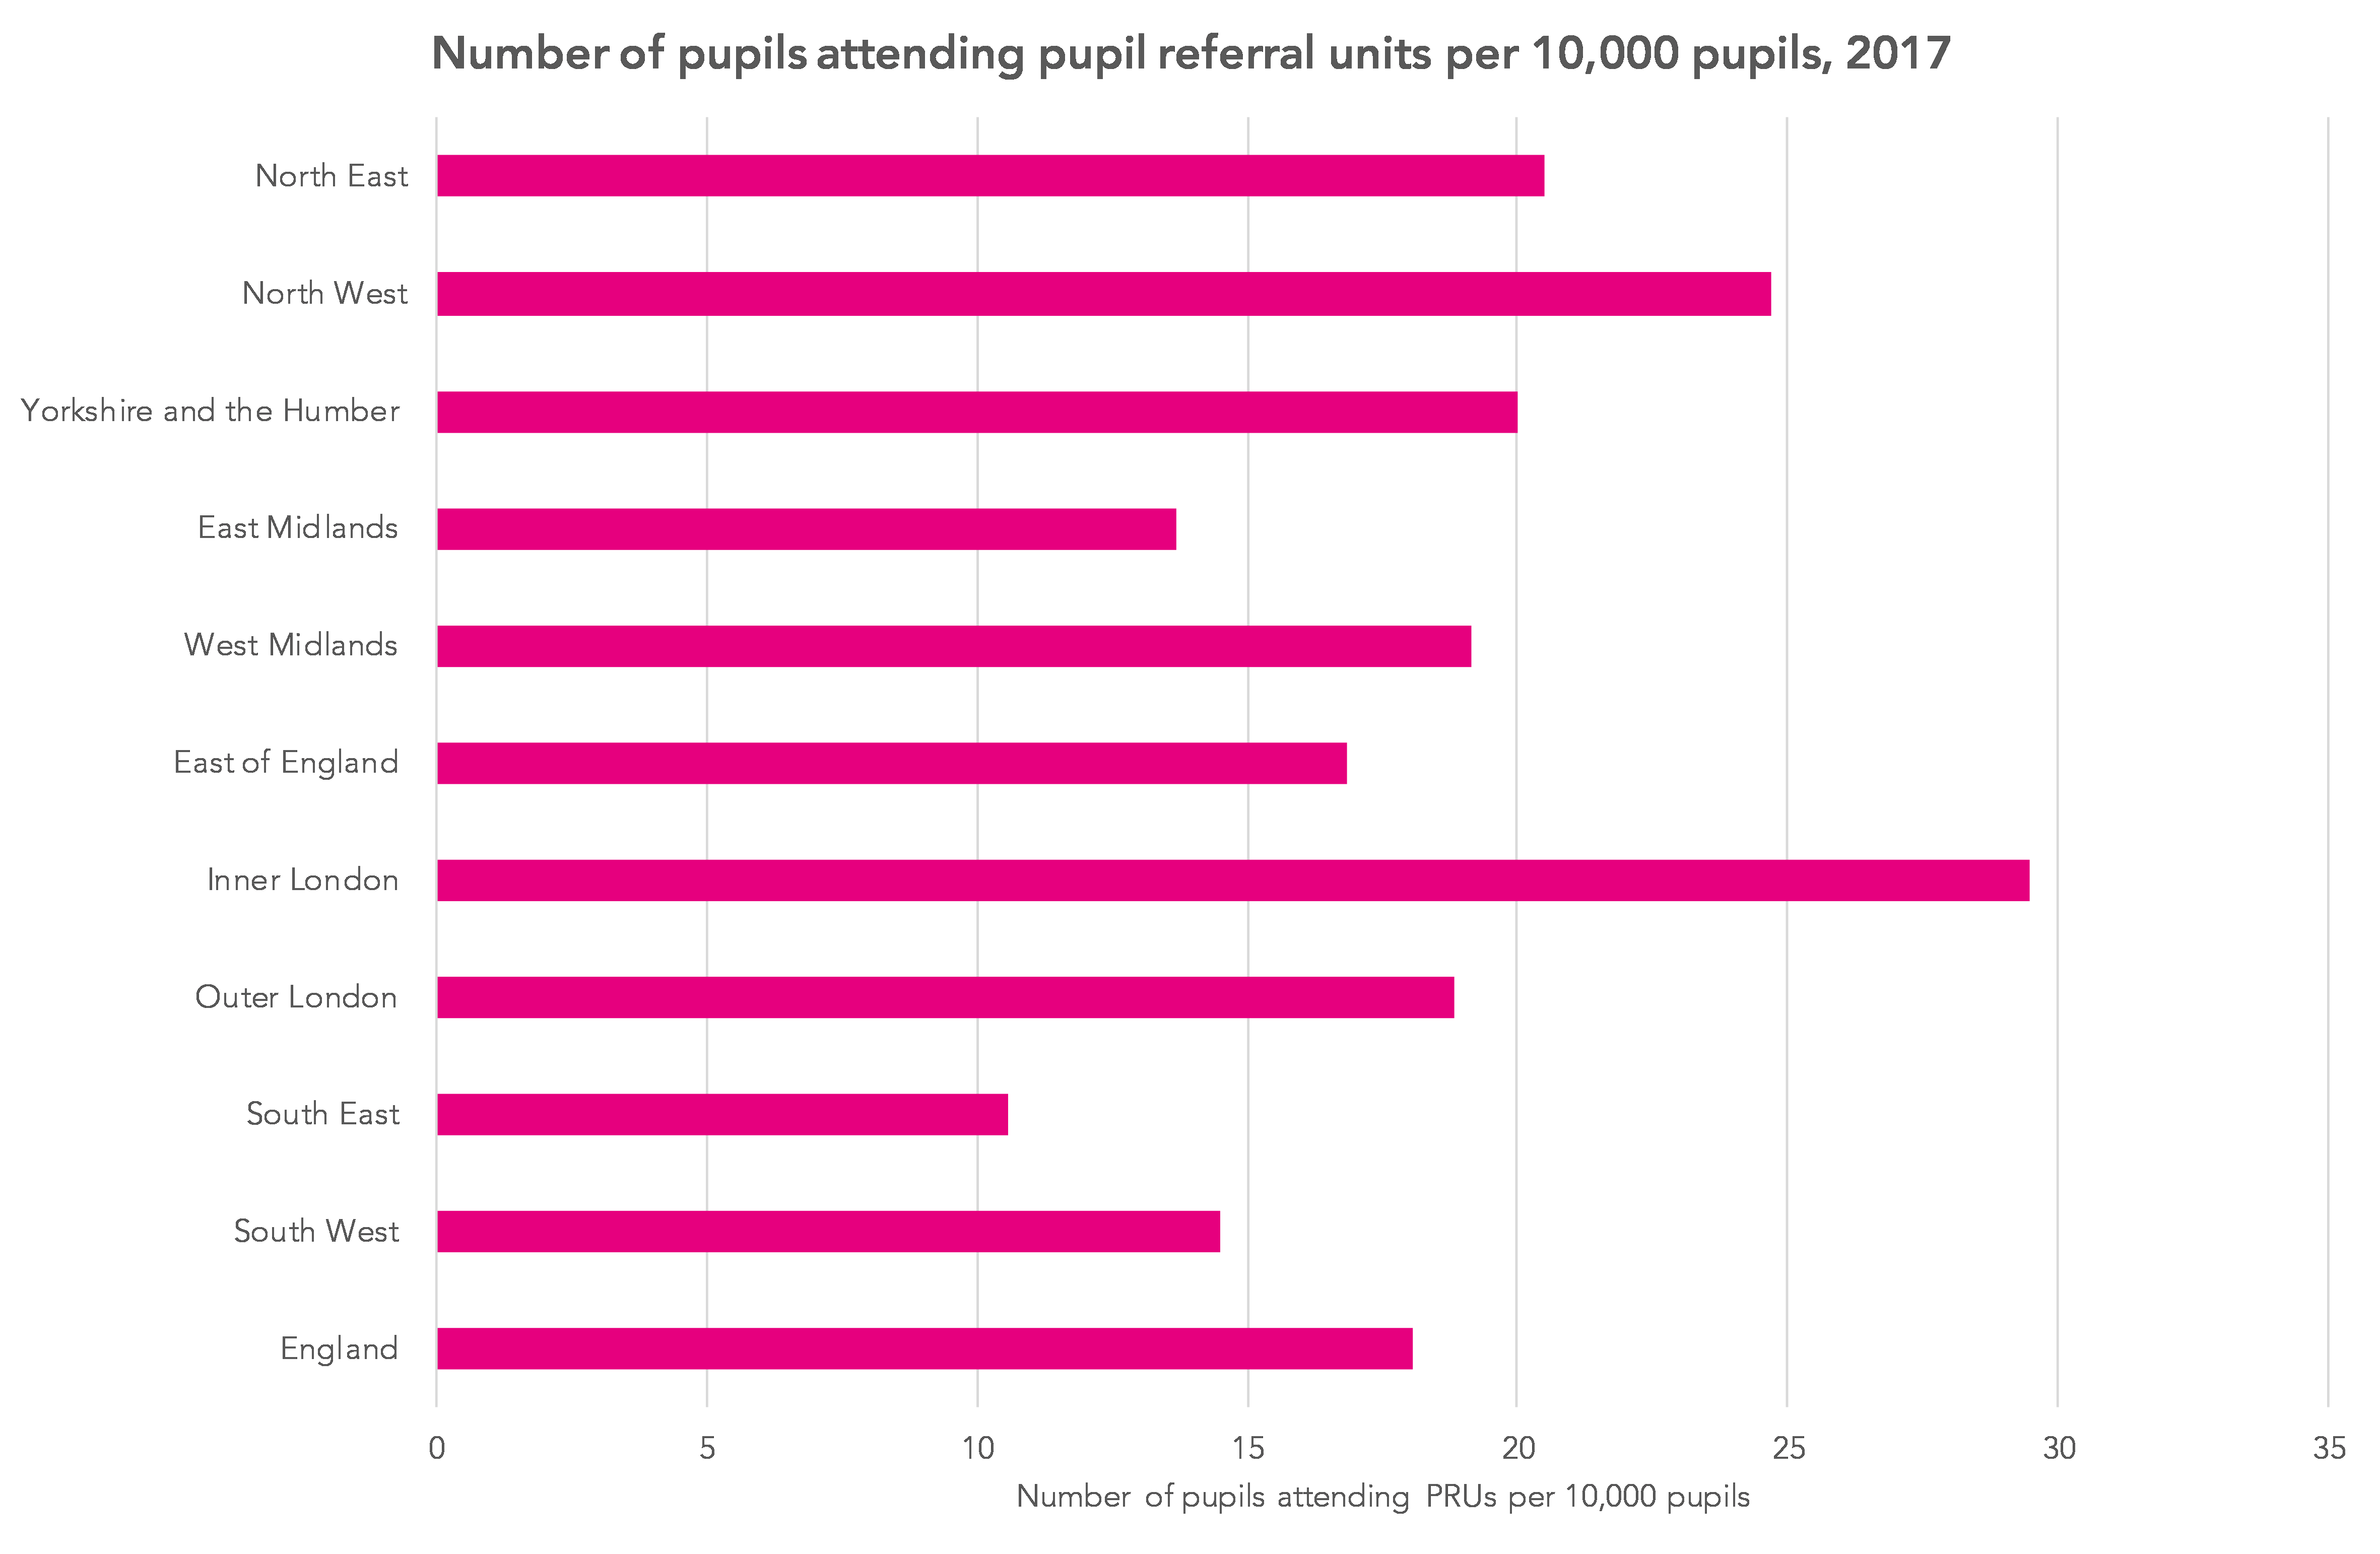
That said, inner London does have higher levels of pupils attending pupil referral units (PRUs), including alternative provision academies and free schools. According to the latest figures available, there are 29 pupils in PRUs for every 10,000 pupils in the capital. These rates were also high in Birmingham (31) and Manchester (34).
There are also more pupils in London attending another group of establishments, referred to by the Department for Education as local authority alternative provision (data available here is from one year earlier). As we wrote here, most of these pupils have been placed in independent special schools or alternative provision.
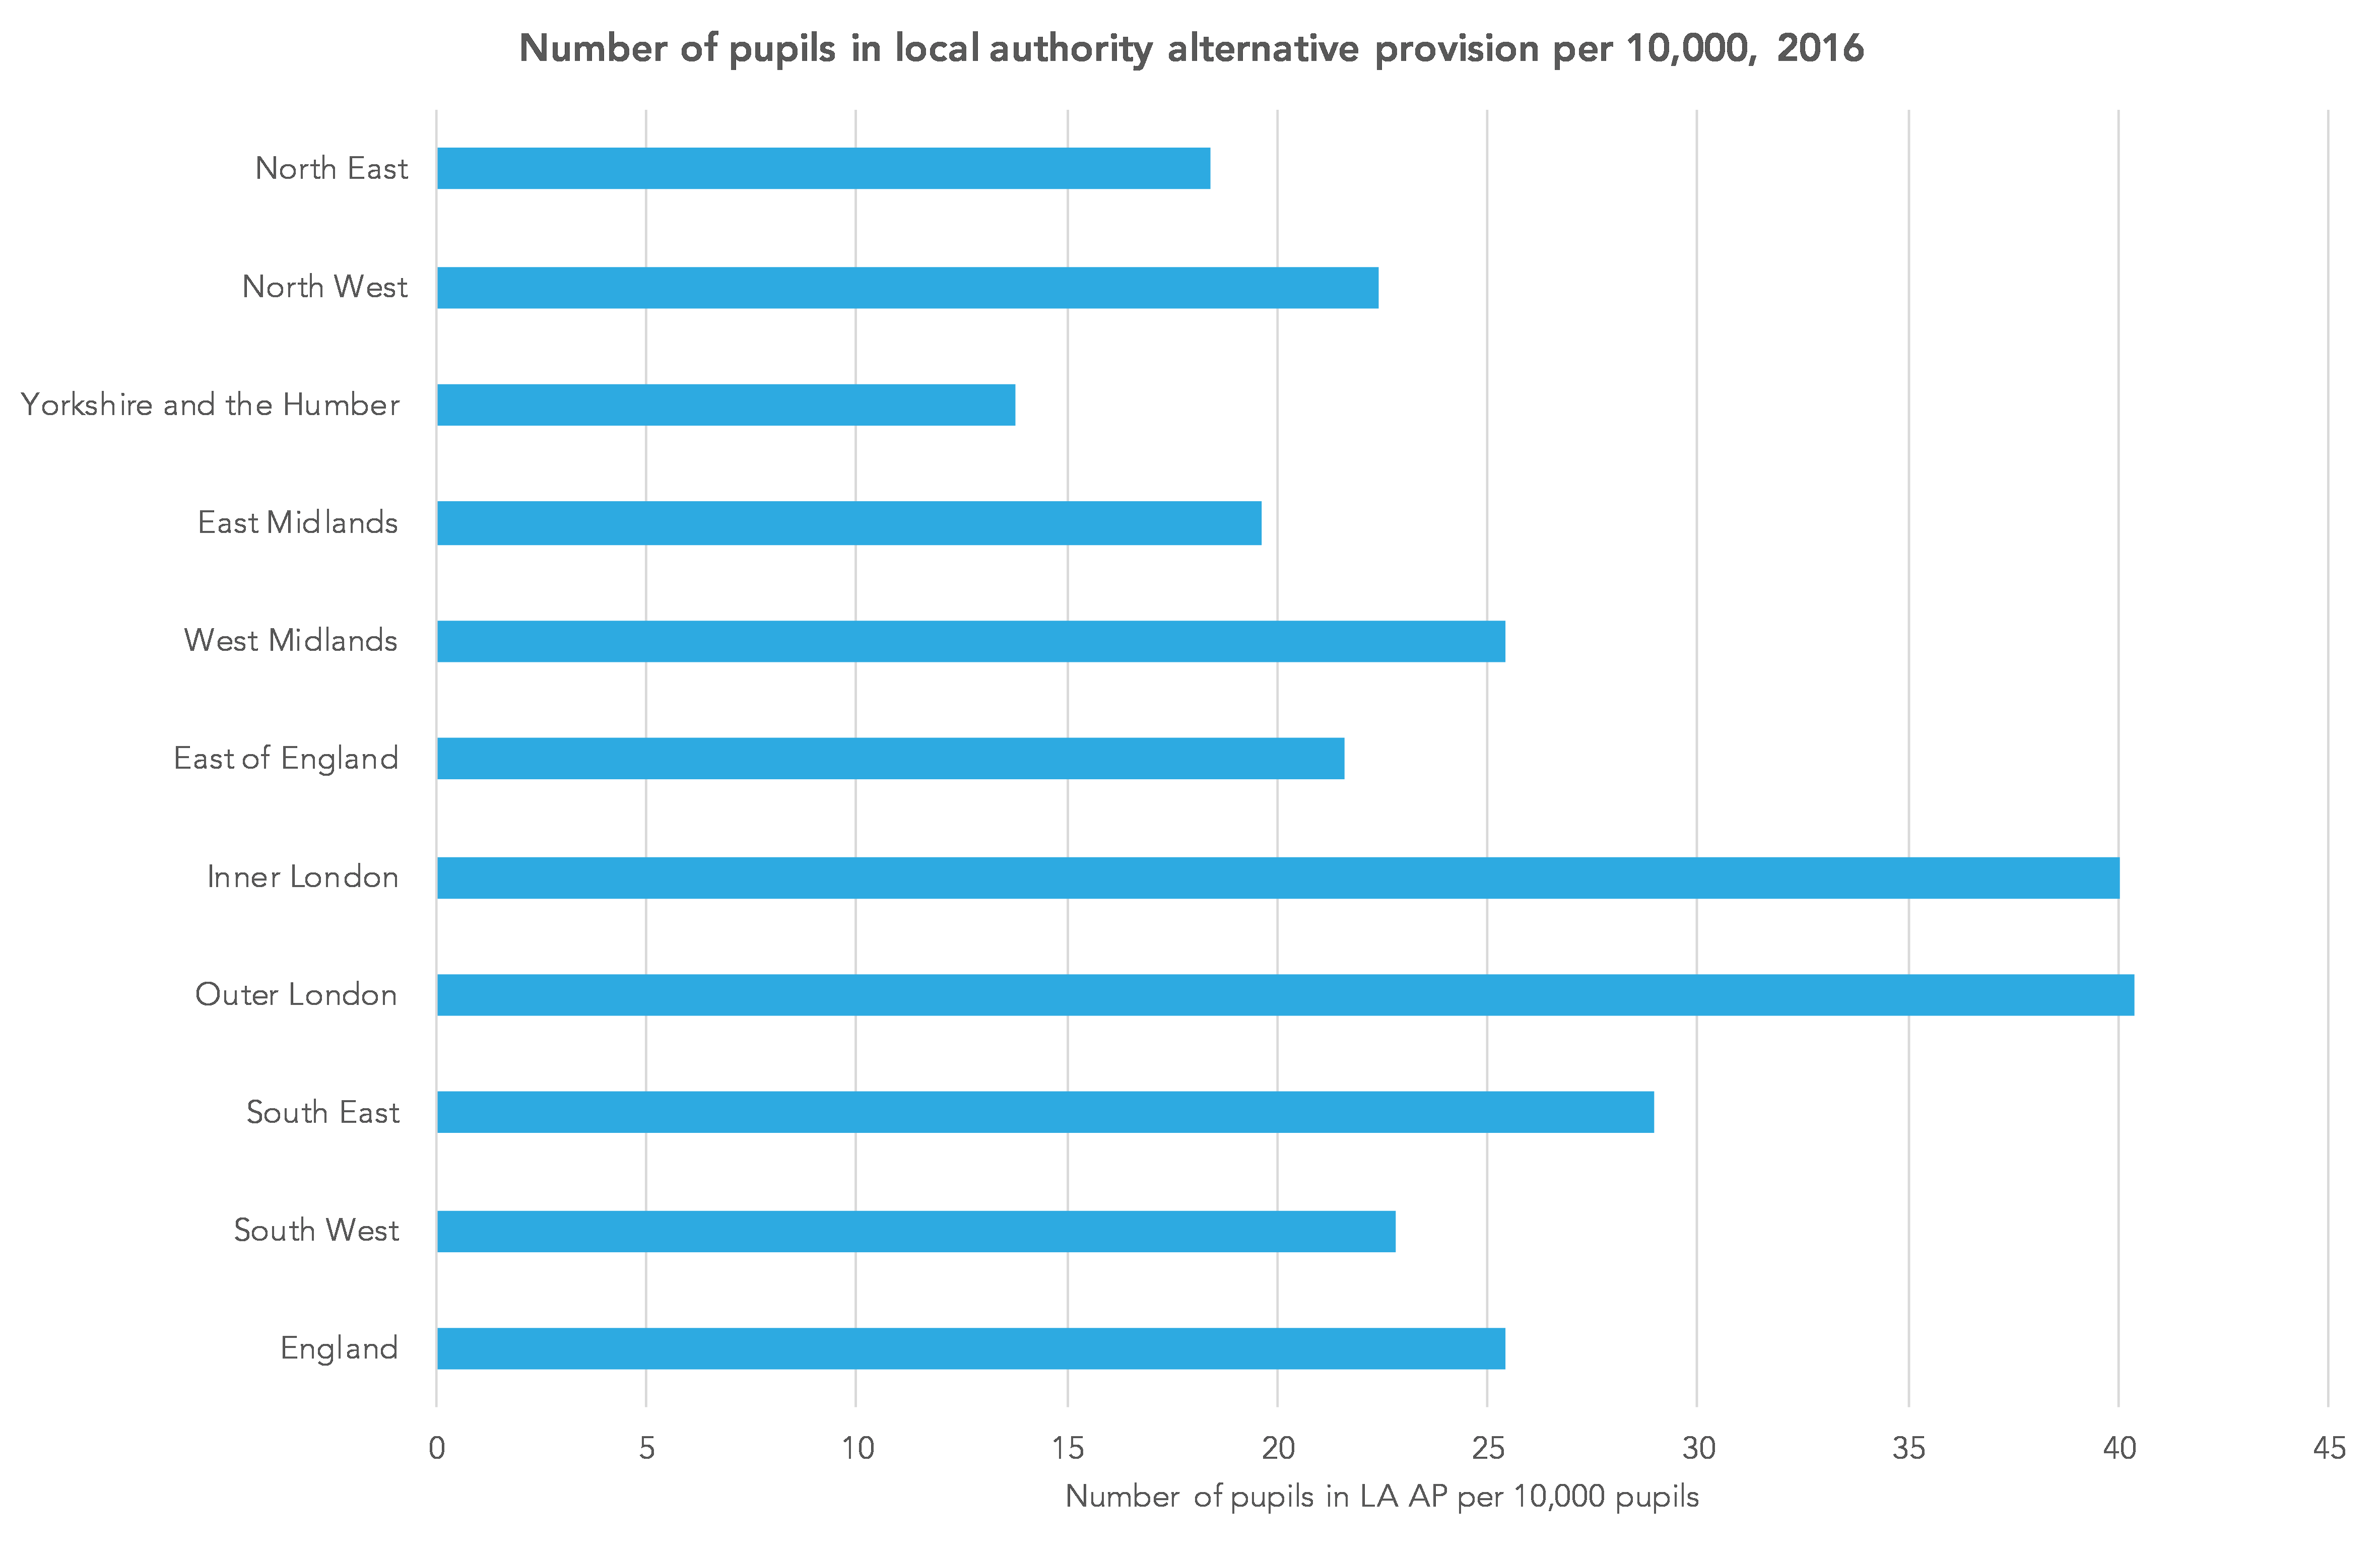
So while we might expect more pupils to leave schools in urban areas due to economic migration, there are also more potential destinations for those who do so, both in terms of other schools within near proximity and in terms of alternative provision.
These movements on and off school rolls have an effect on published school performance statistics, as we describe here. But they also affect regional statistics if pupils either a) move regions or b) leave a mainstream school but do not move to another mainstream school.
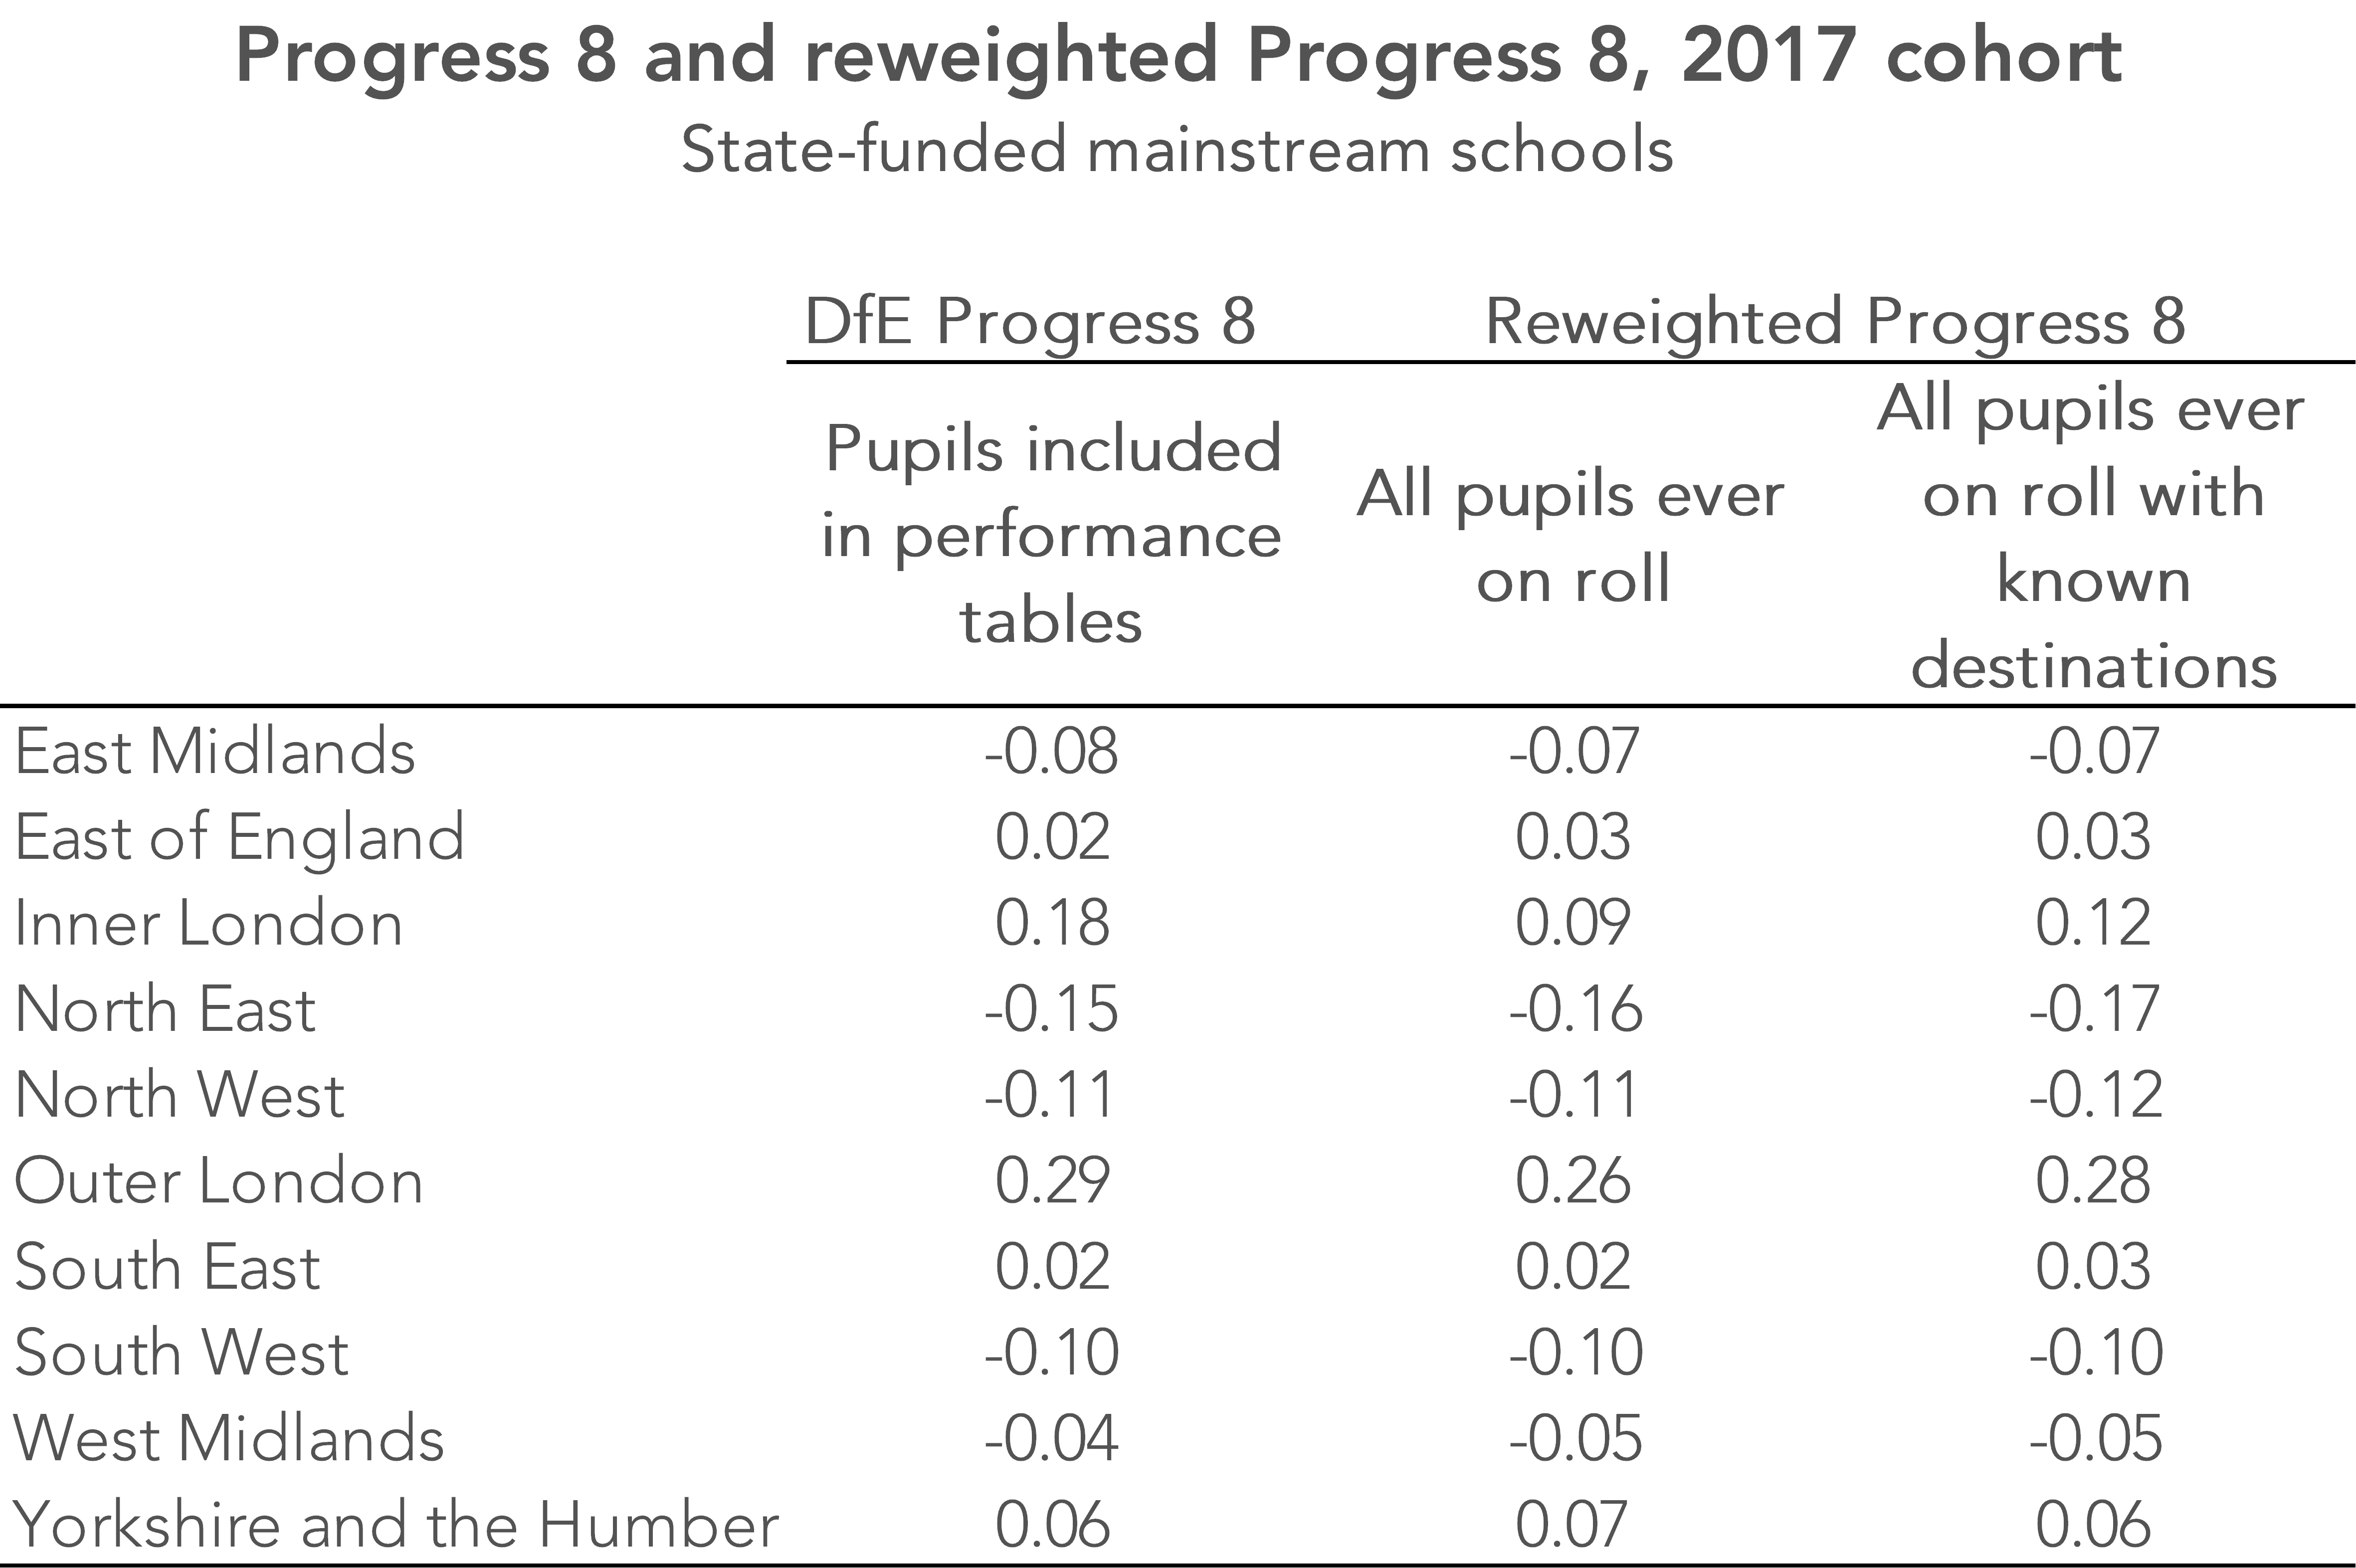
We have reweighted Progress 8 scores to take off all pupils seen on-roll within a region, in proportion to the amount of time they spent on-roll – full details of our approach can be found here.
Using our reweighted approach, the advantage inner London has over other regions reduces from 0.18 to 0.09. However, the Progress 8 score for outer London remains largely unchanged. Of course, most of this advantage stems from London serving quite a different pupil population to the rest of the country.
Some of the pupils who were ever on roll but not included in 2017 Performance Tables may well have emigrated. If we only include pupils with a known destination, including those in special schools, independent schools and alternative provision, the inner London advantage still reduces but not by as much, from 0.18 to 0.12. Both sets of figures are shown in the table below.
So the published performance statistics on London and its schools don’t tell the whole story. Movements off the school roll are hidden from view, and these affect inner London more than other regions.
Perhaps there is little to be gained from trying to understand why London improved so much, given that the system seems to function differently in the capital, and it serves a distinct pupil population.
Now read the next post in the Who’s Left 2018 series.
Want to stay up-to-date with the latest research from FFT Education Datalab? Sign up to Datalab’s mailing list to get notifications about new blogposts, or to receive the team’s half-termly newsletter.


Leave A Comment