With the Conservative leadership contest about to kick into full swing, undoubtedly grammar schools will filter to the top of the education news agenda before too long.
There is evidence pointing to the negative effects of selection on equity, such as this.
However, the challenge for researchers is how to make causal claims about the effects of grammar schools.
What we do not have is a ready-made counterfactual that tells us what might have happened to the pupils who went to grammar schools had they gone to a comprehensive. And similarly, what might have happened to pupils in highly-selective areas who didn’t get into grammar schools.
Unless we were to introduce some sort of lottery system, the evaluation of grammar schools through randomisation would be impossible to achieve.
We therefore have to try our best with observational data, controlling as much as possible for systematic social, demographic and economic characteristics between those who go to grammar schools and those who do not.
Outcomes for pupils who get into grammar schools
Firstly, a quick reminder just how much pupils in grammar schools differ from pupils in other schools.
Their Key Stage 2 attainment is much higher and they are much less likely to be disadvantaged. Not only that, there is a strong regional dimension. Fully 37% of grammar school pupils were in the south east of England and there were none in the north east. And, the two sets of pupils differ in a number of other ways, as the chart below shows.
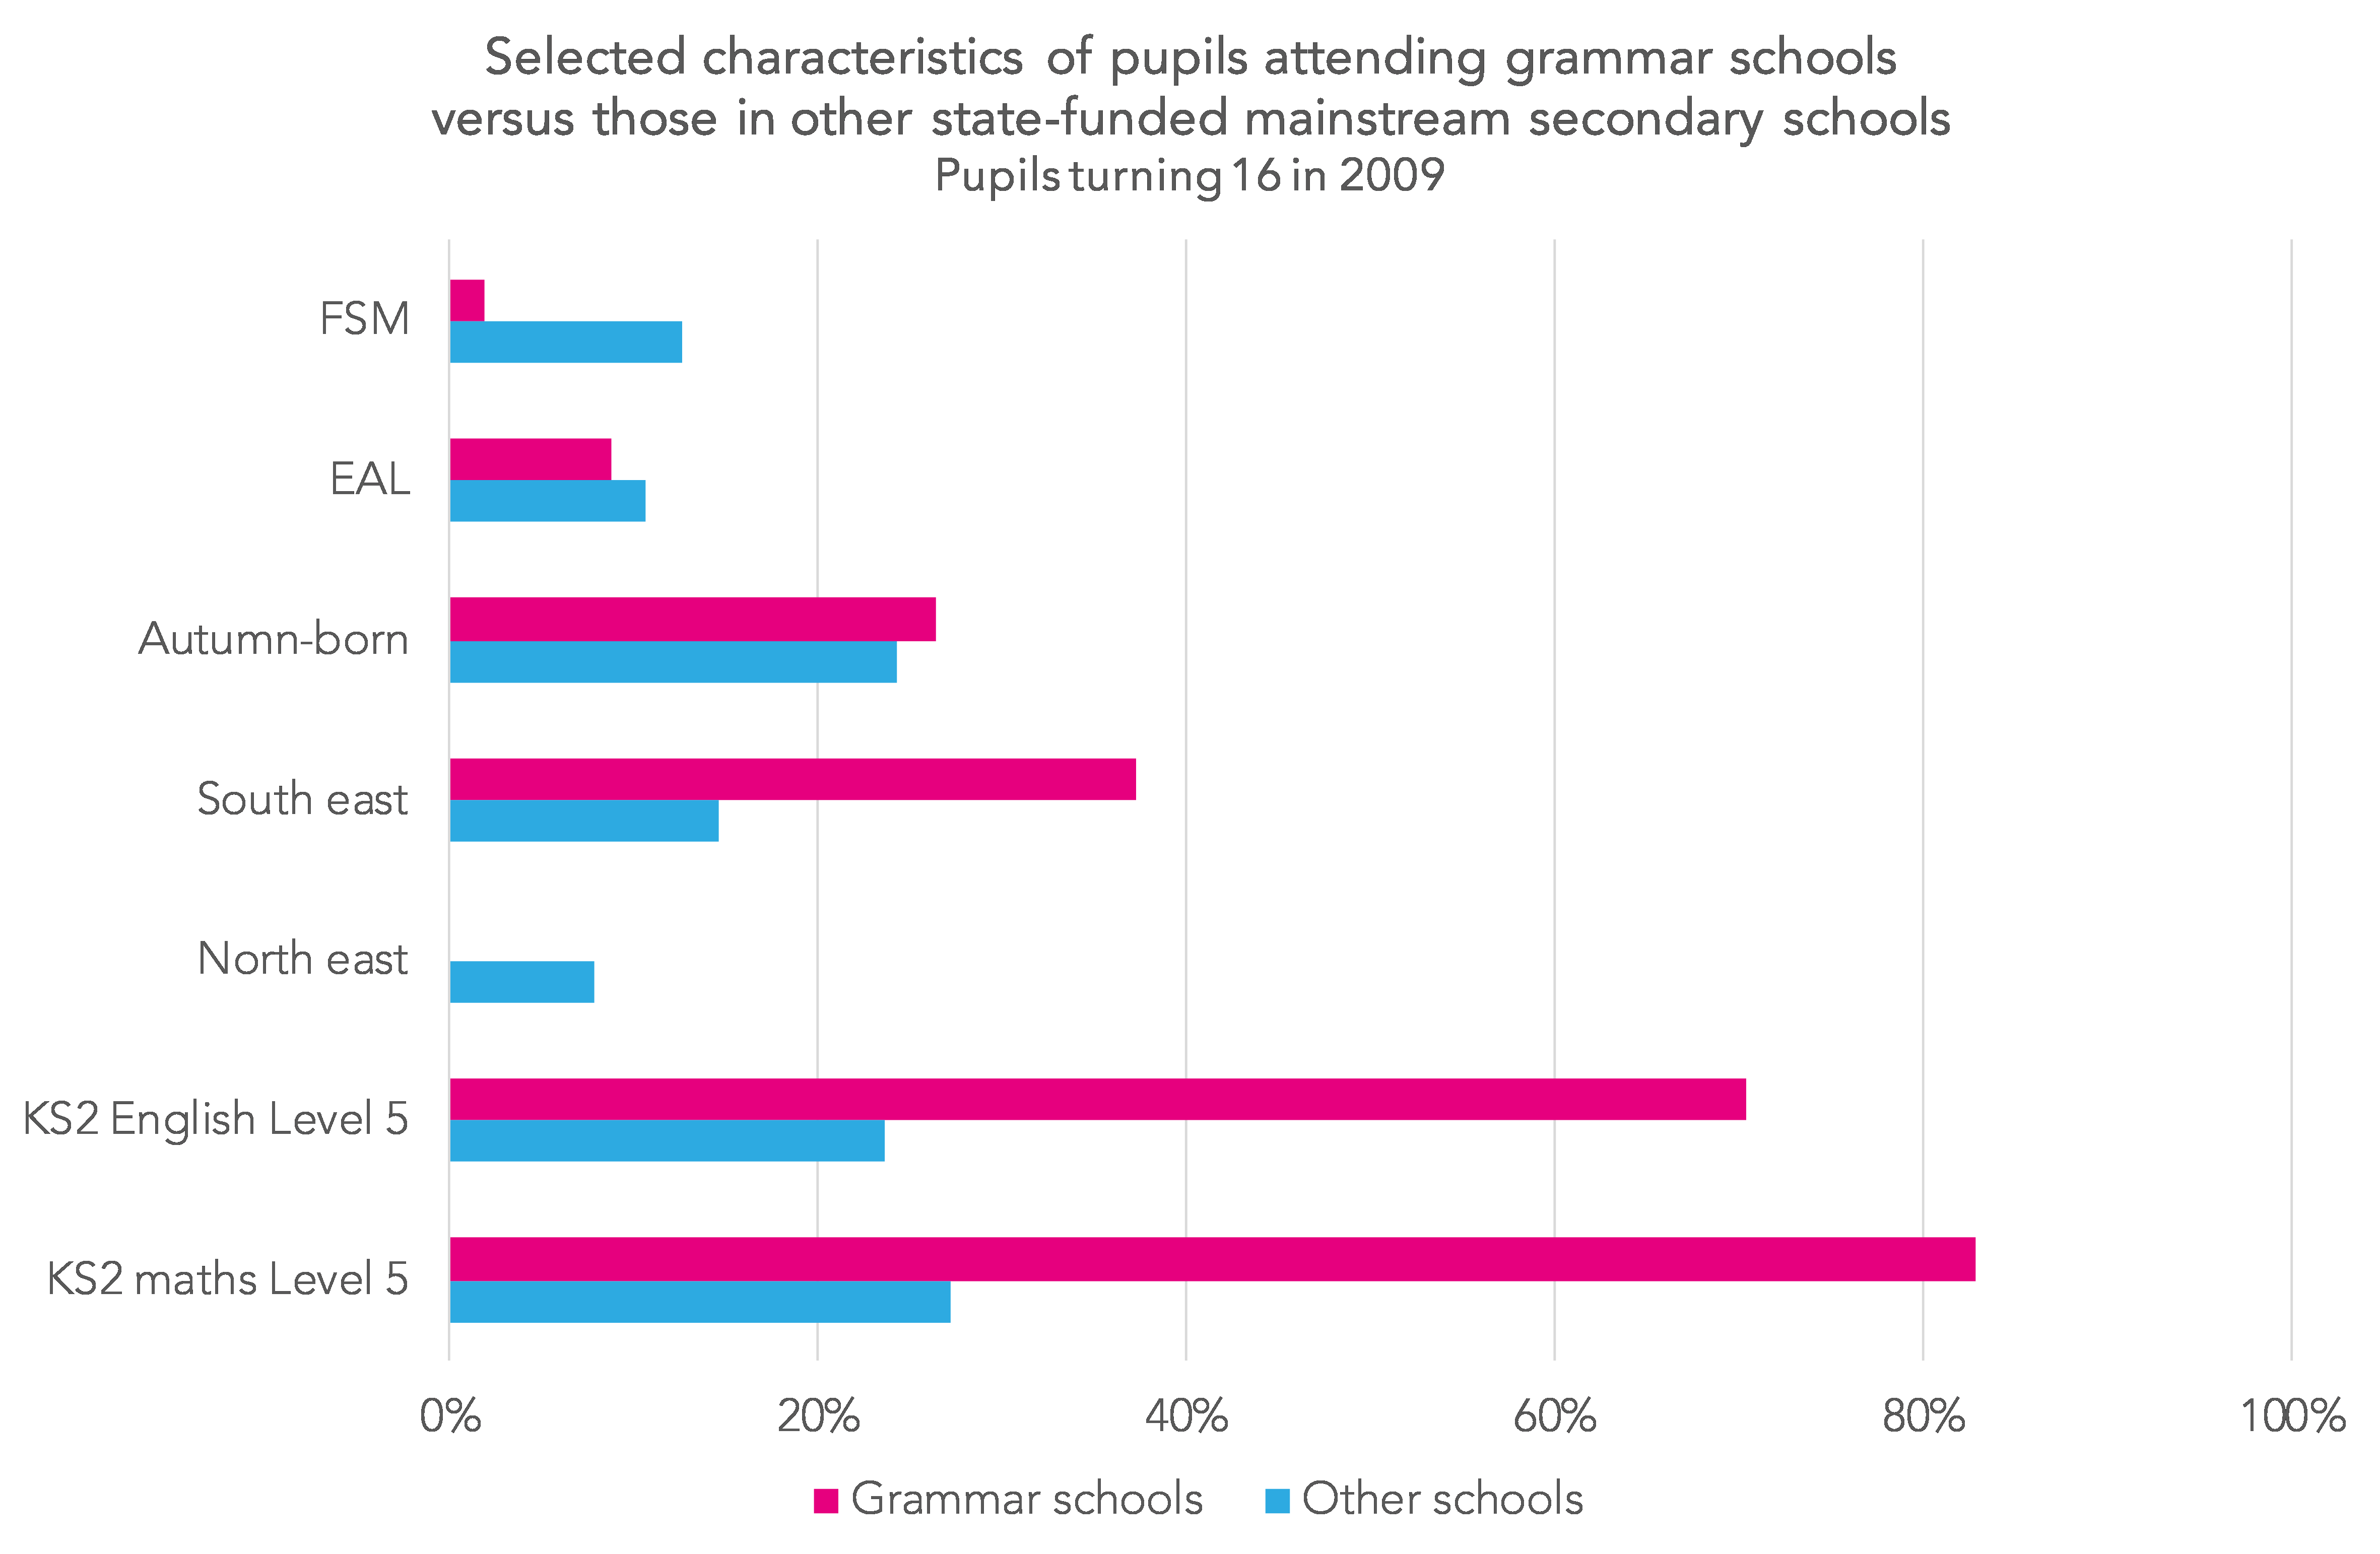
(This analysis is based on the cohort which turned 16 in 2009, as I’m going to look at their subsequent outcomes up to the end of 2015/16 – the latest year for which the data required is available.)
So let’s have a go at comparing like-with-like.
The table below shows the long-term outcomes of around 21,000 pupils who, in the year they turned 16, attended or previously attended a grammar school, and for whom all of the required data is available. It compares the outcomes of these pupils to:
- a matched group of pupils in the 115 local authorities without any grammar schools, for which they are equivalent to the grammar school group in terms of propensity to attend a grammar school, based on a range of pupil and neighbourhood characteristics.[1]
- a second group of matched pupils – matched in the same way as the first group, but with the addition of a school-level measure: the percentage of pupils eligible for free school meals.
In the first comparison, I am comparing similar pupils in similar neighbourhoods. In the second, I am comparing similar pupils in similar neighbourhoods attending schools with similar levels of disadvantage. As you might expect, this produces some differences in results.
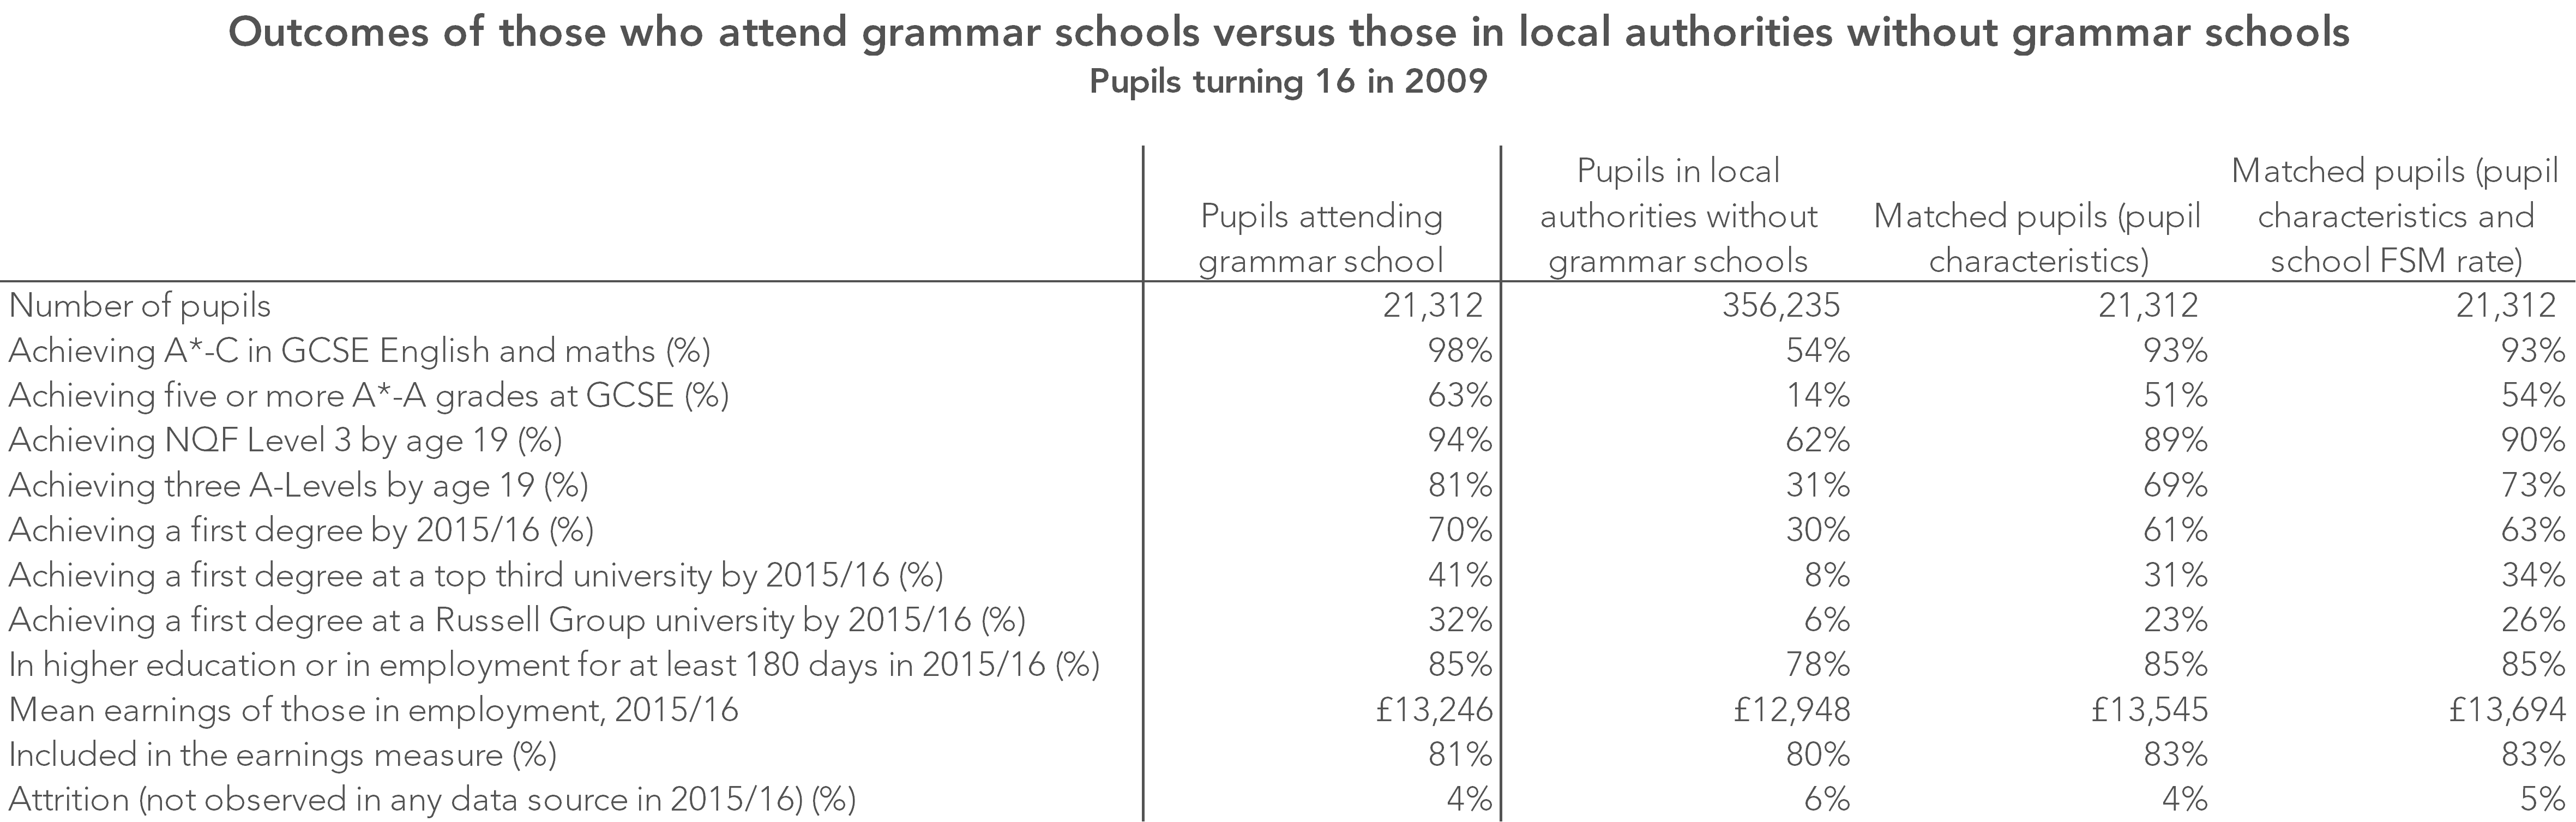
The outcomes for grammar school pupils are far higher than those of all pupils from schools in local authorities without grammar schools, as would be expected given the differences in characteristics shown in the chart above. A total of 41% of the former achieved a first degree from a top-third selective university[2] compared to 8% of the latter.
However, these differences narrow when we attempt to control for differences in pupil characteristics and, especially, when we control for school-level disadvantage.[3]
In essence, outcomes for the sorts of pupils most likely to go to grammar schools tended to be better if they went to schools with lower levels of disadvantage.
Nonetheless, these results show a small advantage in favour of grammar schools for education outcomes but no advantage for earnings and employment. However, I am only looking here at mean earnings at age 23. There may well be gaps at other parts of the distribution, and differences may well emerge later in life.
In any event, the analysis of outcomes for pupils who get into grammar schools needs to be balanced by consideration of the outcomes for those who don’t get in.
Outcomes for pupils who don’t get in to grammar schools
To measure this, I’m going to look at the outcomes of pupils who go to non-selective schools but live in areas where at least 20% of pupils go to grammar schools, comparing their outcomes to those of pupils living in non-selective areas.[4]
Running the same matching procedure described above, including the measure of school-level disadvantage, leads to the results shown below.
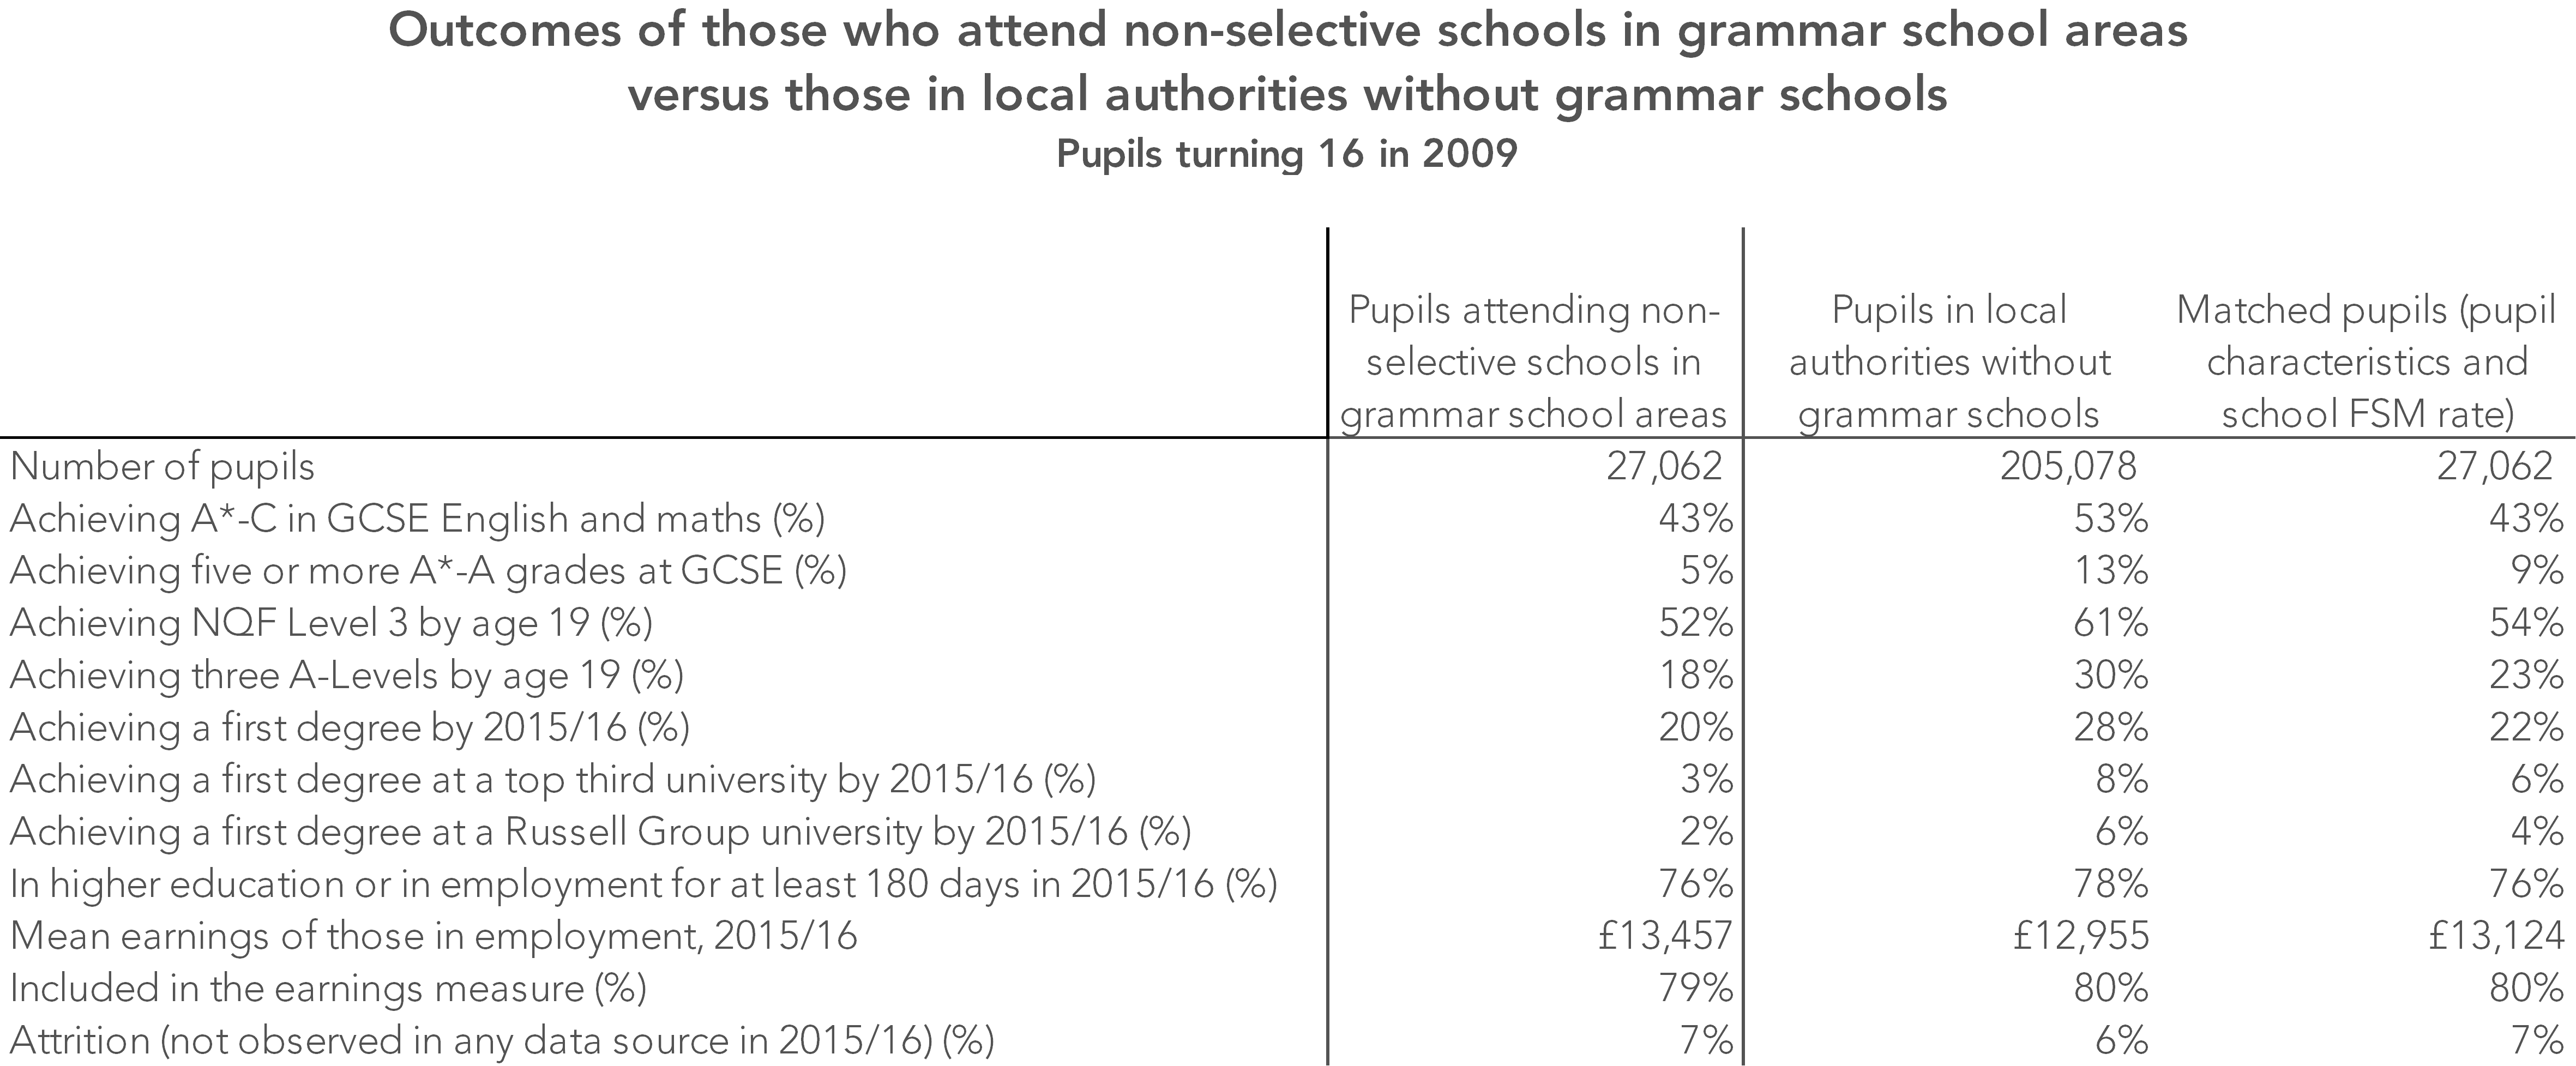
Educational outcomes for pupils attending non-selective schools in areas served by grammar schools tend to be lower than for similar pupils living in non-grammar areas. Although the percentage of pupils achieving five or more A*-C grades including GCSE English and maths was the same, the former group tend to do worse on higher-level outcomes. For instance, they were half as likely to achieve five A*-A grades at GCSE or attend a top third university.
Final thoughts
It looks like outcomes for pupils who went to grammar schools are slightly higher than those of similar pupils who didn’t, but these have to be balanced against worse outcomes for those who don’t get in.
More generally, pupil outcomes tend to be higher when pupils attend schools with higher attaining cohorts. This is the case whether pupils have low or high prior attainment. The grammar school debate will ultimately always come down to whether you think it is acceptable or not to segregate those with high levels of prior attainment (or measured ability) at a given age from other pupils.
The support of the Economic and Social Research Council is gratefully acknowledged.
![]()
Want to stay up-to-date with the latest research from FFT Education Datalab? Sign up to Datalab’s mailing list to get notifications about new blogposts, or to receive the team’s half-termly newsletter.
1. This is done using a statistical matching procedure, known as covariate balancing propensity score matching [PDF].
Pupil characteristics used are: Key Stage 2 English; Key Stage 2 maths; Key Stage 2 science; free school meals eligibility at 16; ethnic background; gender; term of birth; first language (English/other); special educational needs (statement/school action plus, school action, not SEN). Neighbourhood characteristics (measured at lower super output area level) are IDACI score, percentage of households that are owned and percentage of working population educated to level 4 and above.
3. If we went further and controlled for the school-level KS2 mean we’d see the gap reduce further as we see in this earlier post. We do not do this here because we are more generally interested in the effect of teaching pupils with high levels of prior attainment in high attaining cohorts.2. These are listed in Annex A of the methodology guide to the DfE destinations statistical first release.
4. Defined here as local authority districts (326 in England) in which fewer than five Year 11 pupils attended grammar schools.

Thanks very much. Would it be meaningful and if so possible to makea comparison between pupils attending Grammar Schools and ppupils attending high performingcomprehensive schools? I know that high performing comprehensive schools might be likely to be socially selective and wonder if any high performing comprehensives which are not socially selective can be found?
Thanks Russell. We do something along those lines here where we find a handful of comprehensives with high attaining intakes. https://ffteducationdatalab.org.uk/2016/11/apples-to-apples-are-grammar-schools-really-as-effective-as-they-seem/. How these schools have ended up with such intakes is an important question as you allude. Not sure I have an answer immediately to hand.
Thanks very much for posting this link to your earlier work. Very useful
Thanks for this Dave. We always welcome a blog about grammars here in Lincolnshire.
However, could I just point out that Lincolnshire is a selective authority and is part of the the East Midlands region, but you state “Fully 37% of grammar school pupils were in the south east of England and there were none in the north east or east Midlands.” Is this an error, or did you simply not include Lincolnshire grammar pupils in your calculations for this piece of analysis?
Hi Laura. That’s a great spot, thank you. I’d incorrectly coded Lincolnshire into the East rather than the East Midlands.
First I would say read Brian Jackson’s and Derek Meredith’s book ‘Education and the Working Class. Currently, I am writing up some of the experiences of working class people of my generation in the fifties who failed the 11+ and experienced the culture of apartheid that the presence of grammar schools promoted. With the provision of good apprenticeships and Further Education Colleges they did well. The preparation they received for the 11+ was sadly wanting compared to most MC children. Inequality in education persists. I have witnessed the lengths MC parents go to get access to grammar schools both in the fifties and currently. Schools have vastly improved since the former times but inequality to means still persists
This is great analysis. Can a similar comparison be done for top 50 grammar schools vs top 50 comprehensives?
Since Kent has a large number of grammar schools, the average kids may manage to reach there. However the more highly super selectives may be the ones where the difference lies.