Key Stage 4 performance data has been published this morning in provisional form (more detailed, revised data will be published in January).
Here are four of the most interesting things in the figures.
1. EBacc entry rates have increased
Entries rates for the English Baccalaureate – the agglomeration of academic subjects favoured by the government – increased this year.
In total, 40.0% of the 2019 cohort took all components of the EBacc, compared to 38.4% in the previous cohort. This is still far, far from the government’s ambition of 90% of all pupils entering all components of the EBacc by 2027, via an interim goal of 75% of pupils taking the EBacc by 2024 – now only five years away.

As the chart above shows, there was an increase in humanities entry rates this summer – up from 78.3% of all pupils taking a humanities subject last year, to 80.6% this year.
The share of pupils entering languages also increased this year, albeit not by particularly much (46.6% of pupils, versus 46.1% last year).
On GCSE results day this summer we learnt that overall modern foreign language GCSE entry numbers were up by a healthy amount. But we warned at the time that the numbers should be treated with caution, as they weren’t necessarily as positive news as they seemed.
As well as a larger age 16 cohort, we said that at least some of the increase could have been due to independent school pupils switching to GCSEs from international GCSEs.
This morning’s numbers suggest that some of the increase did come from state schools – but that this increase isn’t as big as the numbers back in August will have led some to conclude.
2. EBacc entry rates vary quite a lot regionally
The chart below shows entry rates into the different EBacc components by region (English and maths aren’t shown as they are taken by almost all pupils take English and maths).
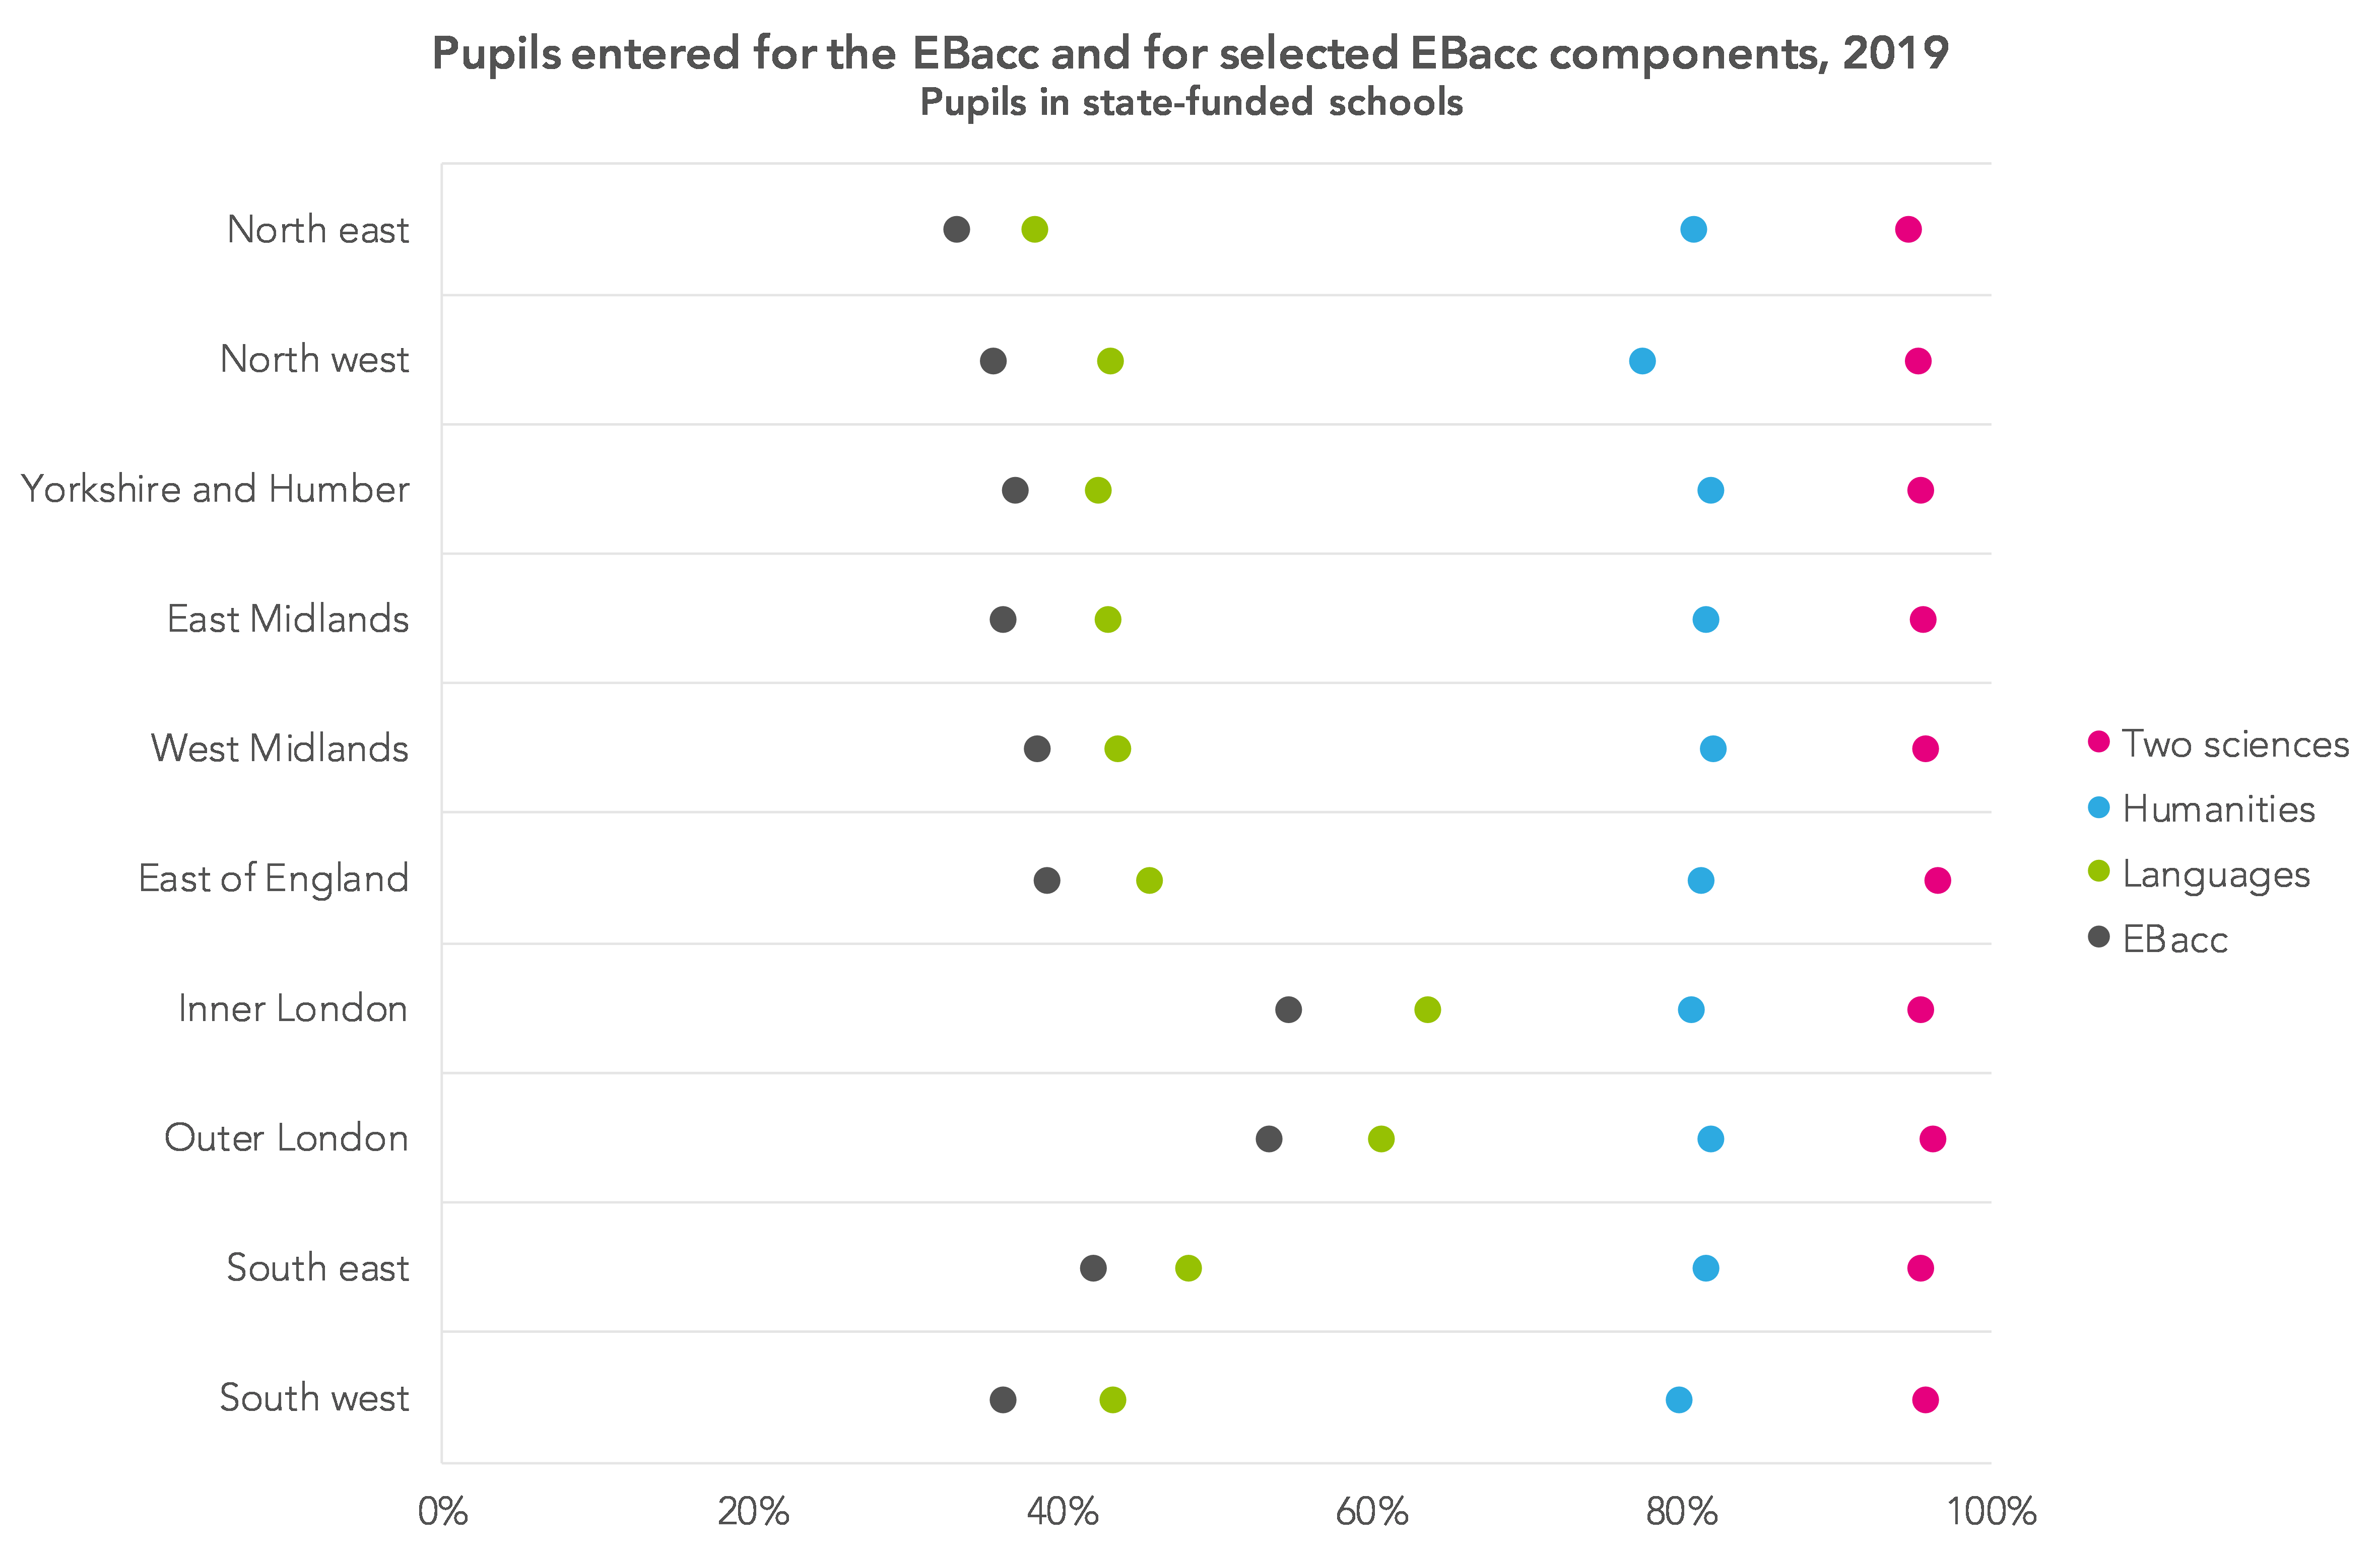
A couple of things stand out. Firstly, humanities entry rates in the north west lag behind those in other parts of the country – 77.5% of pupils there taken a humanities subject. With the exception of the south west (where 79.8% of pupils take a humanities subject), all other regions see more than 80% of their pupils sit geography or history.
Also apparent are the very high entries into language subjects in London, which contribute to the capital having much higher overall EBacc entry rates than other parts of the country – 63.5% in inner London and 60.6% in outer London, compared to 46.6% for the country as a whole.
The post is quite old now, but back in 2016 we wrote that about 6 percentage point of London’s language entry rate (around 46% at the time) were in languages other than French, German, Spanish, Latin or classical Greek. High levels of entries into community languages will still explain some, though not all, of London’s high EBacc language entry rates.
3. P8 scores also vary a lot regionally
There is also wide variation in Progress 8 scores when looked at by region. There are a few trends worth pulling out.
Firstly, and little remarked upon as far as we can tell, there’s been a really notable increase in P8 scores in Yorkshire and the Humber. For the chart below we’ve retrospectively calculated P8 scores going back to 2012. Had the performance measure been in existence then, Yorkshire and the Humber would have had the second lowest P8 score. It has been firmly in the middle of the pack since 2016, though, despite a fall in 2018 as a result of the removal of the ECDL from the list of approved qualifications.

Way back as part of our launch report in 2015 we noted that the Midlands and the north – and Yorkshire and the Humber more than other regions – would have the greatest scope to increase Attainment 8 scores, simply by filling A8 ‘slots’ that were at the time unfilled.
It is worth saying that increases similar to those observed in Yorkshire and the Humber haven’t been seen in the north east and the north west – see the chart below.

In the north west, pupil progress – as measured by P8 at least – has been on the slide since 2012. Relatively low entry rates into EBacc components such as the humanities might be playing a part in this.
The north east, meanwhile, has the lowest attainment at KS4 – and when progress from KS2 is measured this is compounded by very high attainment at the end of primary school.
Finally, very briefly, it’s worth noting that a clear gap in progress seems to have opened up between inner London and outer London – shown on the chart below. While both regions still outperform other parts of the country, outer London’s P8 is now 0.06 higher than inner London’s – +0.24 versus +0.18, respectively. Do share your thoughts on what the reasons for this may be in the comments section below.

4. Free schools
P8 scores were published for 101 free schools today. The average P8 score of their pupils was +0.21. However, as today’s report by the Education Policy Institute notes, some of this is driven by being disproportionately located in London.
Although Eden Boys School in Birmingham was the free school with the highest P8 score, free schools outside London tend to have lower P8 scores than those in the capital, but still slightly higher scores than other schools (+0.12 compared to -0.02).

In London, the picture is slightly different. The median P8 score of free schools is broadly the same as other types of school (see the box plot below) but there is a much longer tail of low-scoring schools that aren’t free schools. Consequently, there is a slightly bigger difference in mean P8 scores between free schools and other types of school (+0.44 compared to +0.26).

Want to stay up-to-date with the latest research from FFT Education Datalab? Sign up to Datalab’s mailing list to get notifications about new blogposts, or to receive the team’s half-termly newsletter.


Is it possible to separate the Year10 early entry results from the 17yr resit results awarded a grade 9 in Summer 2018 ?
Hi there. The data that school performance tables are based on relates just to those pupils at the end of KS4 – 16-year-olds in most cases. But what you might be after is the GCSE results figures published by the Joint Council for Qualifications in the summer, which do split things out by age in that way – see the PDF available here: https://www.jcq.org.uk/examination-results/gcses/2019/main-results-tables/gcse-full-course-results-summer-2019