This blogpost is based on data collected via our 2023 Early Results Service for primary schools. By uploading their EYFS, Phonics, KS1 and KS2 assessments, Aspire schools can access an early 2023 national analysis of their results before the end of term. There’s still time to take part – the next submission window for KS1 closes on Friday 21 July!
Data
For the first time this year we’ve collected Year 1 phonics data from schools.
Almost 1,400 primary schools kindly shared their data with us.
The results we present below for 2023 are for this sample of schools. Generally, we find that data collected from a large number of schools produces a close approximation of the national average but results for groups of pupils can sometimes be more variable.
We have also been collecting absence data from schools since the start of the pandemic. The 1,300 schools also supplied us with absence data for the 2023 academic year.
Headline results
The chart below shows the distribution of marks in our sample of 2023 sample of schools compared to the full national distribution in 2022.

This is a classic example of a left-skewed distribution. The majority of pupils are plotted to the right of the chart. Once again, 32 was the threshold for the expected standard.
81% of pupils achieved the expected standard in our sample of schools in 2023. For comparison purposes, the national average in 2022 was 75% having stood at 82% in 2019.
The chart does not include absent pupils or those for whom the requirement to take the phonics check was disapplied. This latter group includes pupils working below the standard assessed or who may be a recent arrival to the UK with limited English.
National data for 2022 showed an increase of almost 50% in the percentage of disapplied pupils, up from 1.7% in 2019 to 2.4% in 2022. Among our sample, 1.5% of Year 1 pupils were disapplied in 2023.
Pupil groups
In previous work we showed how early literacy skills (at the end of Key Stage 1) related to outcomes at Key Stage 4. But this also showed the importance of context, both in terms of early literacy and in terms of subsequent progress.
In the table below, we show the percentage of pupils in our sample who achieved the expected standard in phonics broken down by three key contextual variables: gender, term of birth and disadvantage.

79% of girls achieved the expected standard nationally in 2022, down from 85% in 2019. The average in 2023 for our sample was 84%, slightly below the pre-pandemic rate.
The average for boys in the sample was in line with the national average from 2019 at 78%, increasing from 72% in 2022.
91% of Autumn-born girls who were not disadvantaged reached the expected standard. This compares to 58% of disadvantaged Summer-born boys.
Absence
The final chart shows the relationship between Year 1 phonics attainment and Year 1 absence for disadvantaged and non-disadvantaged pupils.
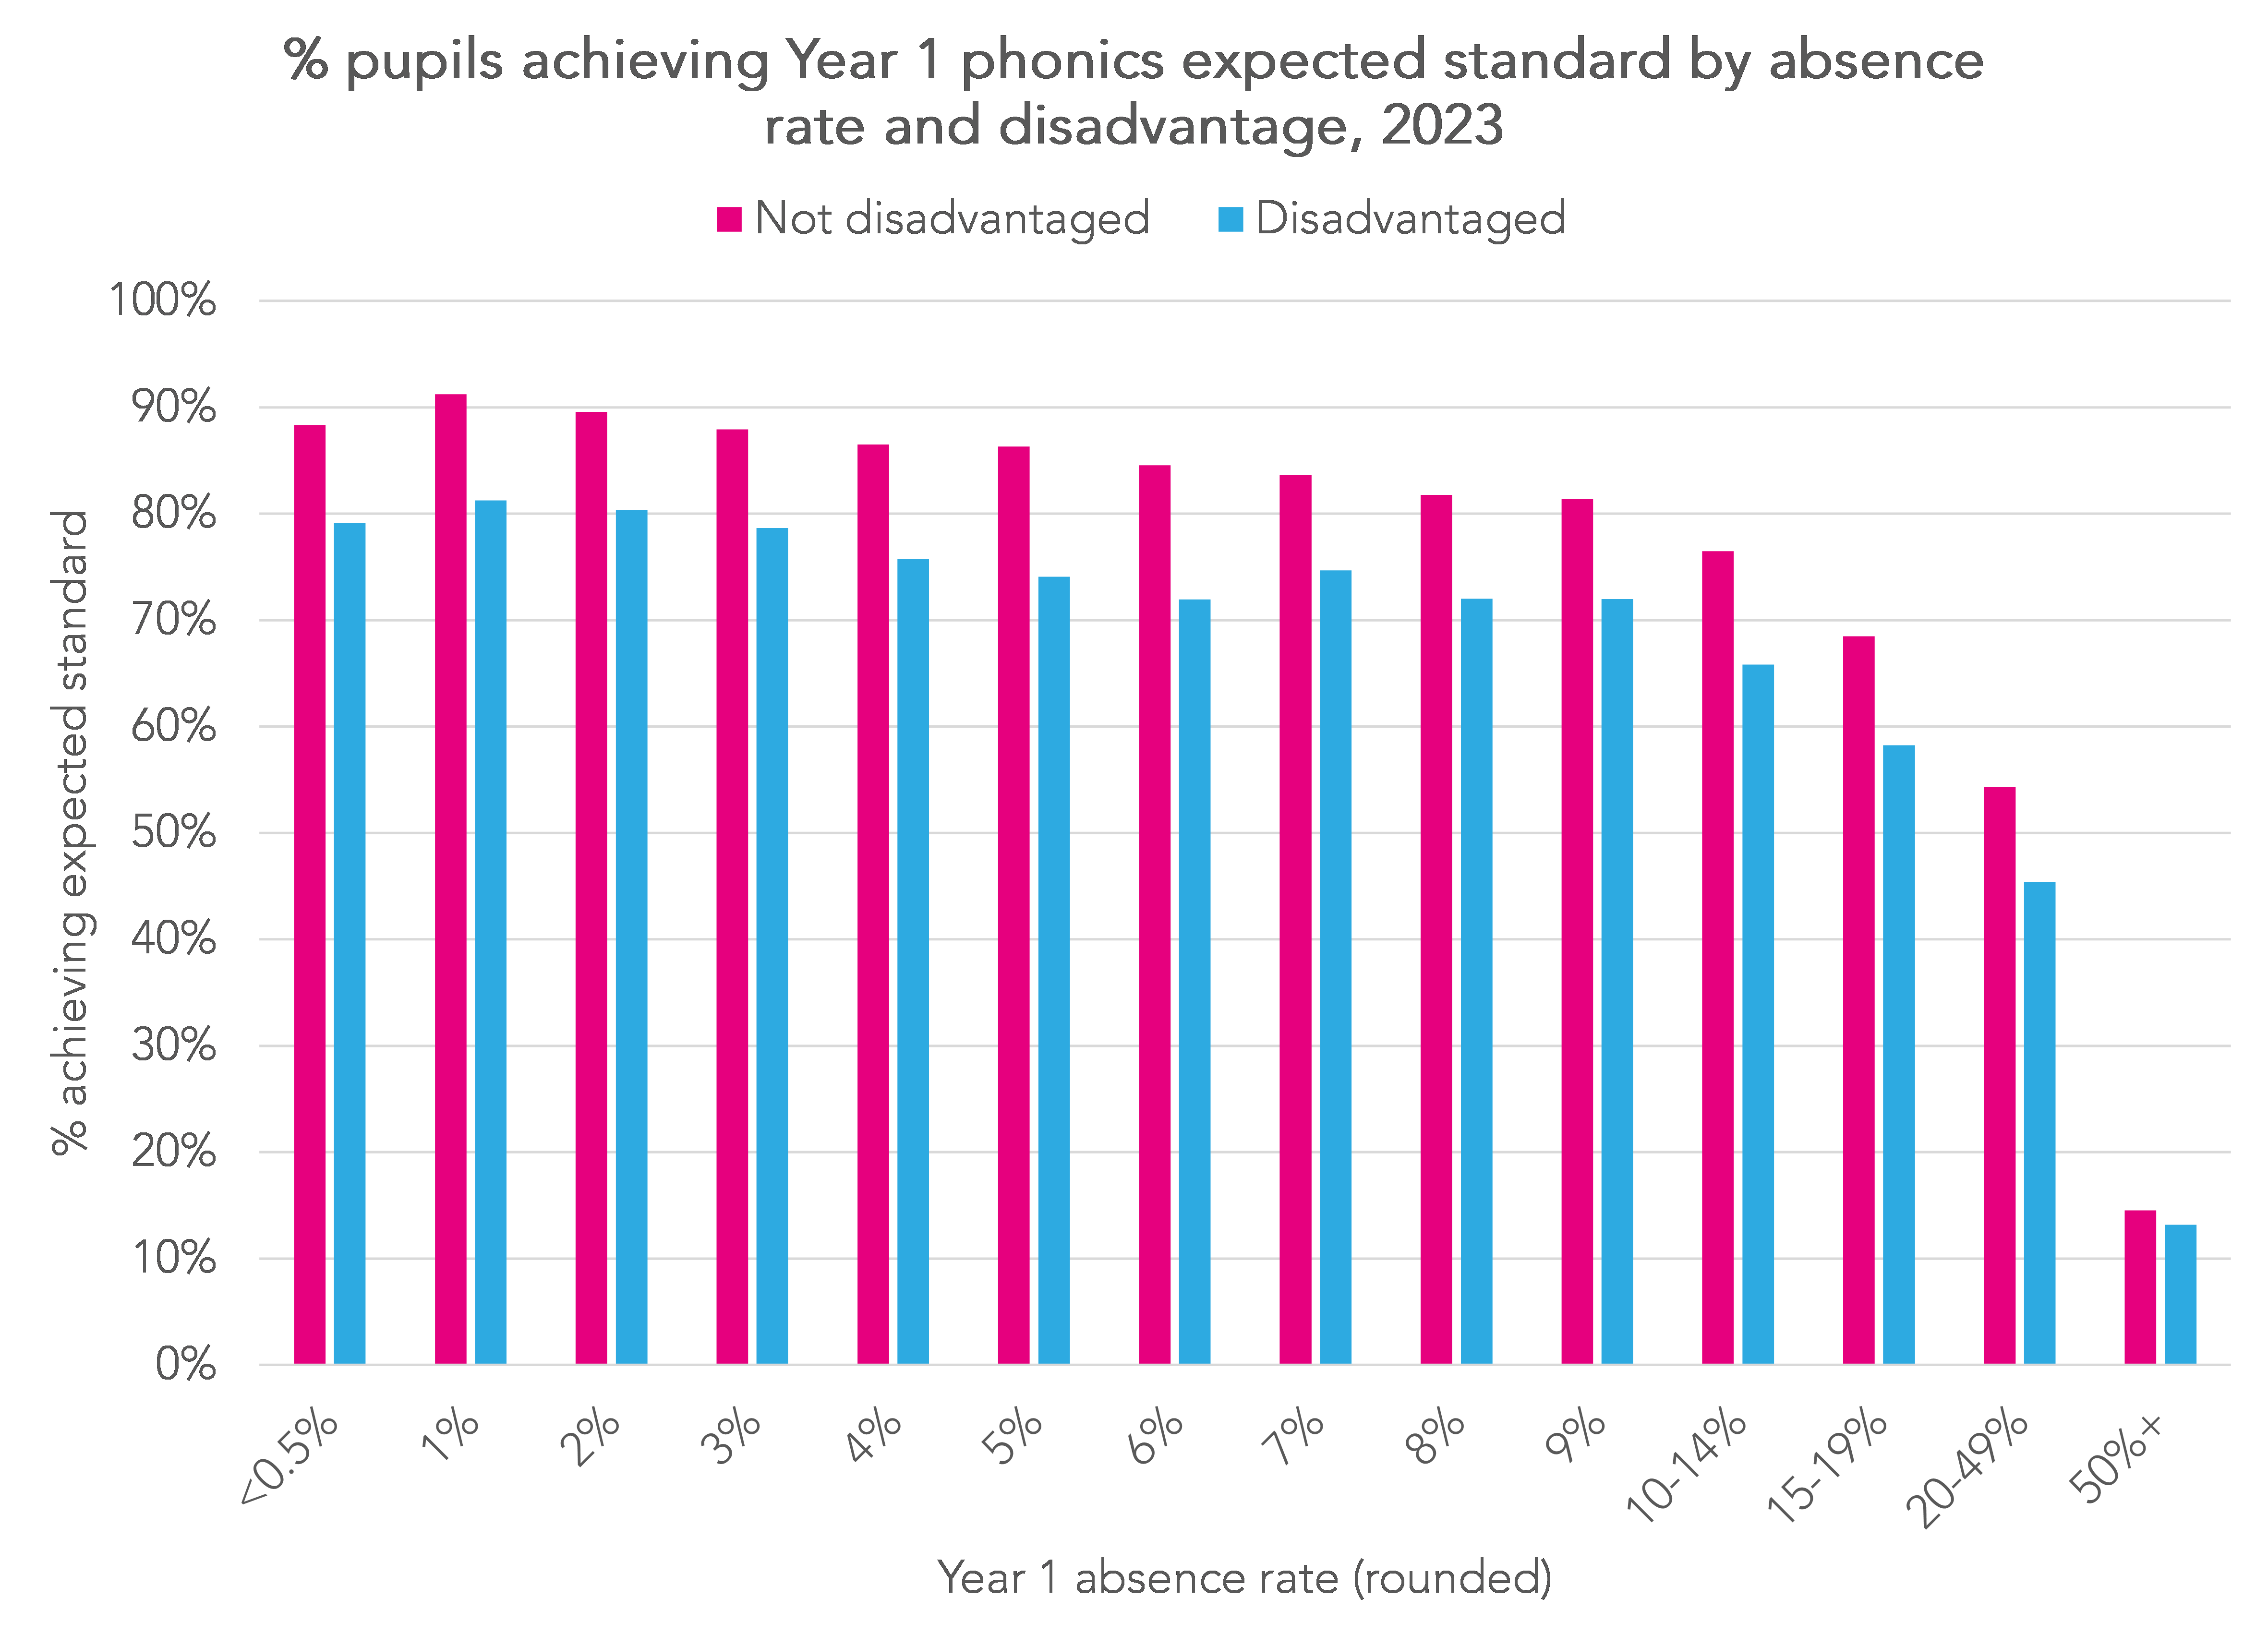
The chart shows that absence and attainment are negatively associated.
Among non-disadvantaged pupils, the percentage achieving the expected standard fell below 80% among those with an absence rate of 10% or higher.
In general, the attainment of disadvantaged pupils was 8-9 percentage points lower than non-disadvantaged pupils with similar absence rates.
81% of disadvantaged pupils with an absence rate of 1% (between 0.5% and 1.4%) achieved the expected standard. This was matched by non-disadvantaged pupils with an absence rate of 9%.
However, the relationship isn’t necessarily causal, that is to say there may be underlying factors behind both low attainment and high absence.
Summing up
Just like at Key Stage 1, attainment in Year 1 phonics appears to have improved this year following a decline in 2022 as a result of the Covid-19 pandemic.
81% of pupils in our sample of schools achieved the expected standard. This compares to a national average of 75% in 2022 and was close to the pre-pandemic national average of 82%.
But although attainment has improved overall, there remains familiar variation in attainment between groups of pupils based on gender, term of birth and disadvantage.
Want to stay up-to-date with the latest research from FFT Education Datalab? Sign up to Datalab’s mailing list to get notifications about new blogposts, or to receive the team’s half-termly newsletter.


Leave A Comment