Prior to the pandemic we had begun work on a School Quality Index which attempted to measure the quality of schools in terms of both inclusion and academic outcomes.
We plan to publish an update to that work later in the year.
Ahead of that, in this article we set out our approach to measuring academic outcomes using a contextualised Progress 8 measure.
Alongside it we have produced an appendix (xlsx) of school-level scores for 2023.
The problem with Progress 8
Although we think Progress 8 is a useful performance indicator, we’ve written before about the problems of interpreting it as a measure of school effectiveness. It is a measure of Key Stage 4 attainment accounting for pupils’ prior attainment at Key Stage 2.
(There is a side issue about which Key Stage 4 subjects and qualifications should and shouldn’t “count” – we’re going to sidestep that here.)
But Key Stage 4 attainment is impacted by lots of things other than prior attainment. For example, pupils’ socioeconomic disadvantage and ethnicity. Some schools have disproportionately more disadvantaged pupils than others and as a result will tend to achieve lower Progress 8 scores. This is sometimes seen as a weakness of the measure.
This is where a contextualised version of Progress 8 comes in. One which accounts for a much wider range of pupil characteristics.
It’s still not a measure of school effectiveness though. Because there are factors other than those which are possible to model which influence Key Stage 4 attainment, and have nothing to do with school effectiveness. For example, levels of parental support, a pupil’s choice of peer group, etc.
However, it does go some of the way towards removing some of the bias of Progress 8 due to different schools having different proportions of pupils with particular characteristics. This is the idea we’ll explore in this post.
The impact of pupil characteristics on pupils’ Progress 8 scores
Firstly, let’s see how Progress 8 scores in 2023 varied by a selection of pupil characteristics.
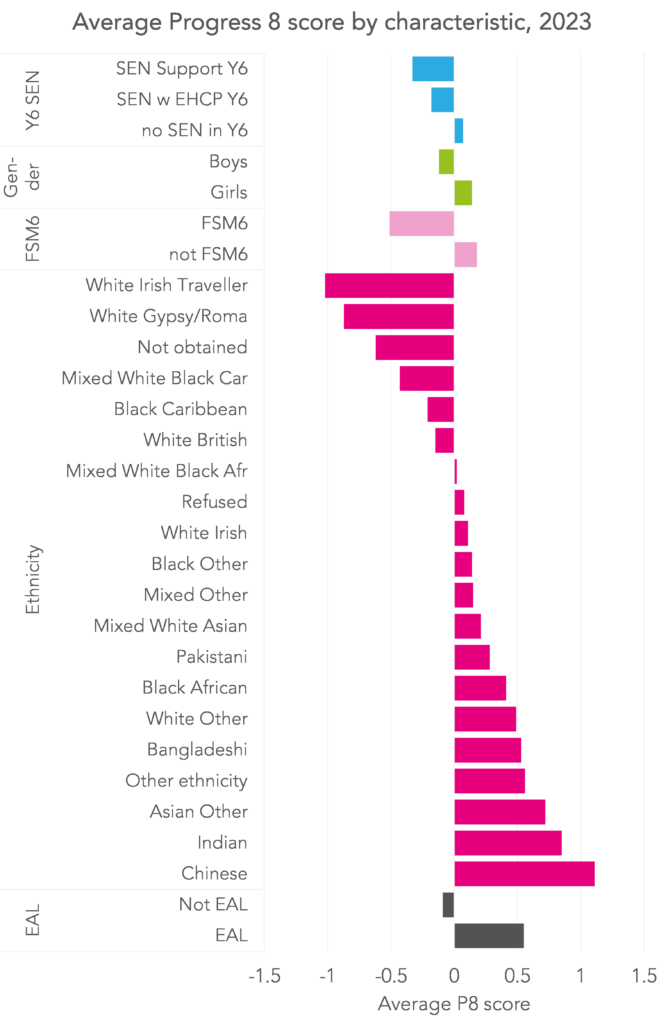
Certain characteristics are associated with particularly high or low scores. For example, disadvantaged pupils (those eligible for free school meals in the six years preceding the end of Key Stage 4, or “FSM6”) had an average score of -0.51, compared with +0.18 for their peers. This translates to disadvantaged pupils achieving around two thirds of a grade lower than non-disadvantaged pupils with similar prior attainment in each of their qualifications.
Chinese pupils had an average score of +1.11, while Irish Traveller pupils scored -1.02. And pupils whose first language was not English had an average score of +0.55, compared with -0.09 for those with English as their first language (a phenomenon we’ve looked at before).
Now let’s look at some combinations of pupil characteristics. Here, we’ll see how Progress 8 scores in 2023 varied by disadvantage, separately for those with and without English as an additional language (EAL).
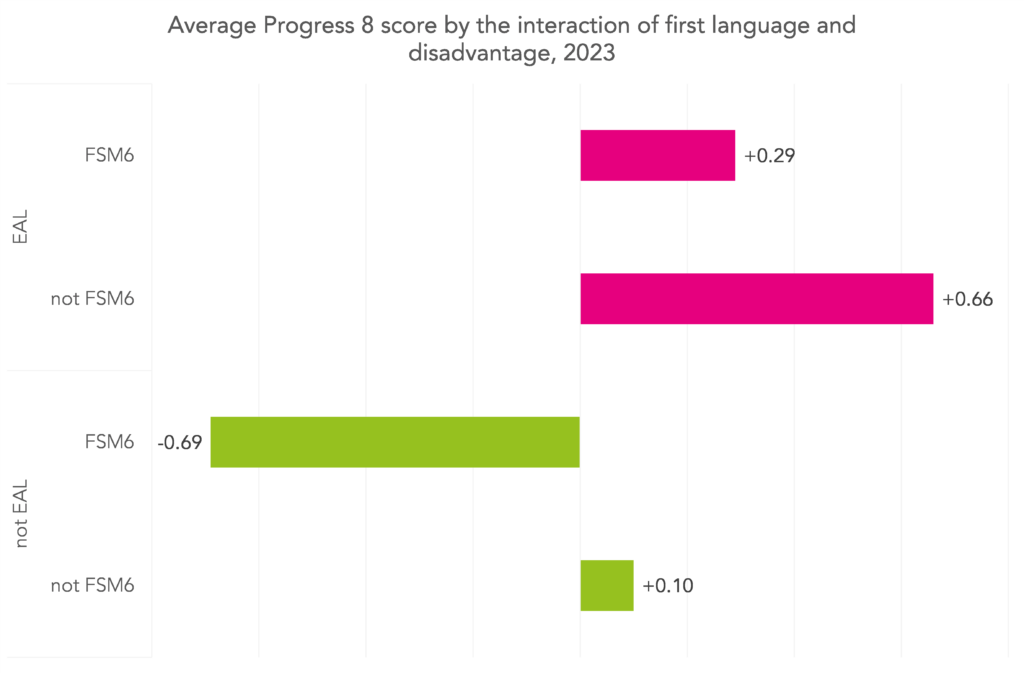
The relationship between disadvantage and Progress 8 score is not the same for pupils with EAL[1] and those without. While disadvantage among EAL pupils was associated with a drop of 0.37 (+0.26 for disadvantaged EAL pupils vs +0.66 for non-disadvantaged EAL pupils), among non-EAL pupils it was 0.79 (-0.69 vs 0.10).
In models like the one we’ll use to calculate contextualised Progress 8 we account for this by including “interactions” between our chosen characteristics.
The impact of pupil disadvantage on schools’ Progress 8 scores
Let’s turn now to school-level Progress 8 scores and the impact of different pupil populations. We’ll focus on disadvantage, but the results would be the same for any characteristic which is associated with big variations in Progress 8 score.
Below, we plot the proportion of schools by their 2023 Progress 8 score. We divide schools into three groups of equal size, according to the proportion of their pupils who were disadvantaged.
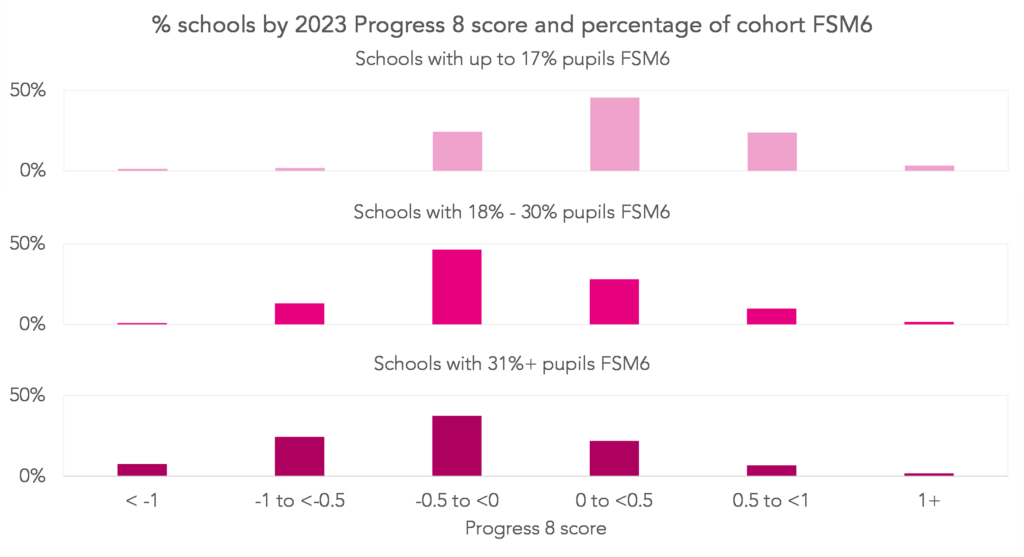
As expected, on average, schools with more disadvantaged cohorts tend to have lower Progress 8 scores. While 27% of schools with the least disadvantaged cohorts achieved a score of at least +0.5, this was true for only 9% of schools with the most disadvantage cohorts. Similarly, 32% of schools with the most disadvantaged cohorts had a score lower than -0.5, but only 3% of schools with the least disadvantaged cohorts.
Contextualised Progress 8 removes bias due to measurable pupil characteristics
The model we use to calculate contextualised Progress 8 contains the following characteristics (and all interaction terms[2]):
- Key Stage 2 attainment
- month of birth
- gender
- % terms eligible for FSM
- ethnicity
- SEN status in Year 6[3]
- EAL status
- IDACI decile of pupil’s postcode
- whether the pupil joined their school after the start of Year 10
- whether the pupil has ever been looked after and/or in need
- mean KS2 score of pupils in the same KS4 cohort
The choice of which factors to include is, to a certain degree, a subjective one. We include a fairly wide list but we are constrained by the data available. Maybe we could have included others, maybe we could have included more interactions, maybe we could have left some out. Changing the “recipe” changes the scores that are produced, but only usually by a small amount as we show here.
Nonetheless, we can see the difference that contextualising Progress 8 makes by looking again at school-level scores by the proportion of pupils who were disadvantaged.
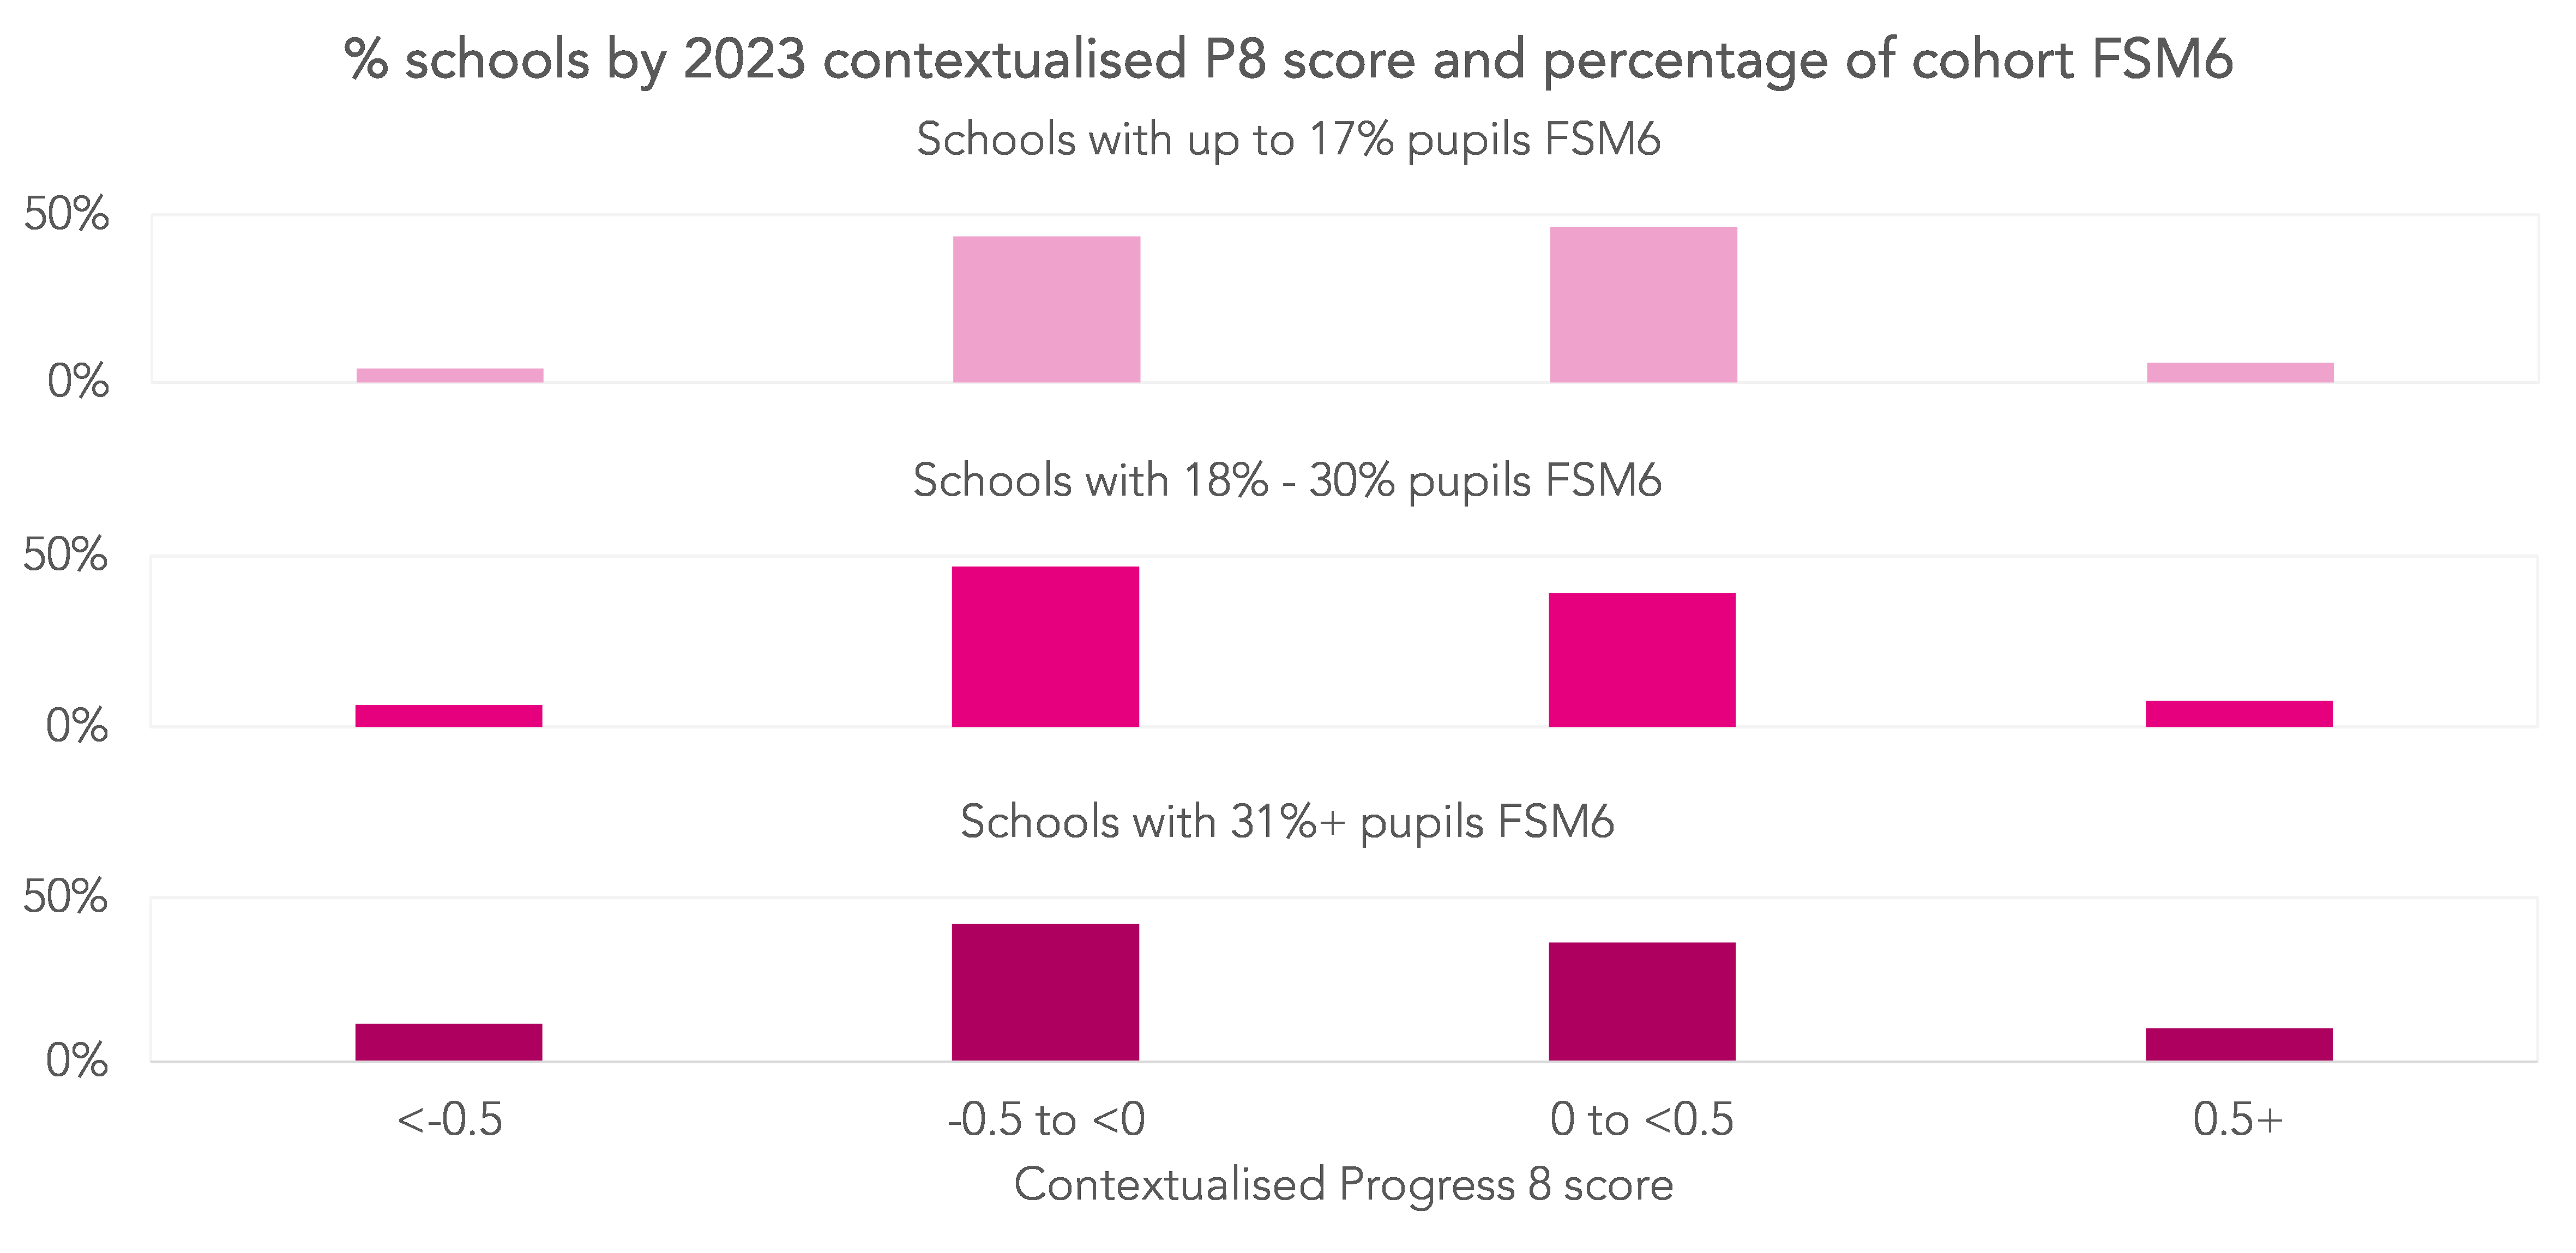
This time, all of the distributions are much more similar to each other. Around 50% of schools in each disadvantage grouping have a contextualised Progress 8 score of 0.0 or higher. There are some differences at the extremes of the distribution, likely as a result of schools having different proportions of pupils with characteristics other than disadvantage[4].
What it means for individual schools
To finish, let’s compare Progress 8 and contextualised Progress 8 scores for individual schools. Below we plot Progress 8 on the horizontal axis and contextualised Progress 8 on the vertical axis, and show each school as a point. Schools below the diagonal line saw their Progress 8 score drop in the contextualised version, and schools above saw it rise.
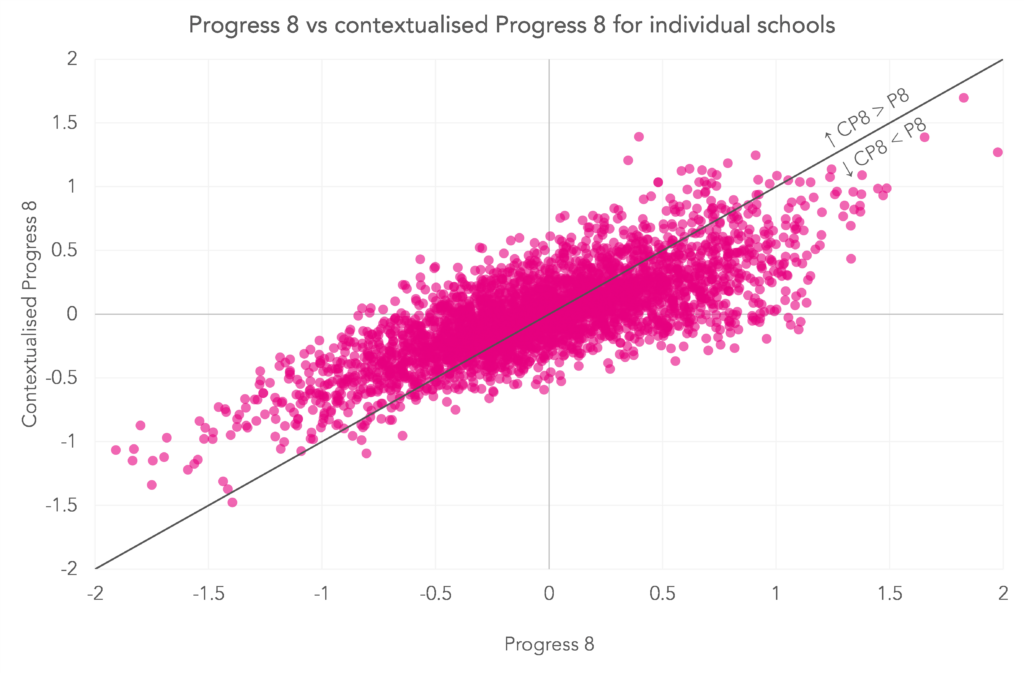
Generally, schools with low Progress 8 scores saw them increase in the contextualised version, while schools with high Progress 8 scores saw them fall. This is particularly noticeable for schools with extremely high or low Progress 8 scores.
Around 7.5% of schools saw increases of at least 0.5 when their Progress 8 scores were contextualised, and 6.8% saw drops of more than 0.5.
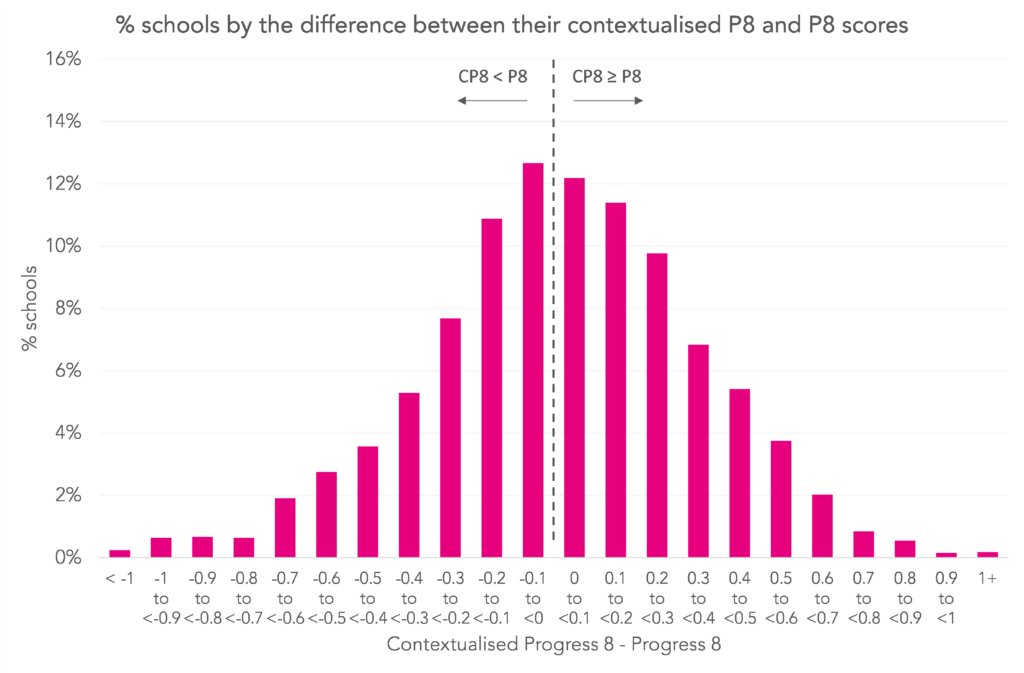
However, for most schools, their Progress 8 and contextualised Progress 8 scores were similar. Around 25% of schools saw changes of less than 0.1 in either direction, and 71% saw changes of less than 0.3.
This is summarised below, where we show the percentage of schools by the difference between their contextualised Progress 8 score and their Progress 8 score.
The correlation between the two measures is 0.79 (where 1 would indicate perfect correlation, and 0 no correlation at all.)
In summary
Pupils with particular characteristics tend to get better Progress 8 scores than others.
Contextualised Progress 8 doesn’t have this problem because it accounts for a wide range of pupil characteristics.
But its downside is that it can be a bit “black box”. We’ve chosen to include a particular set of characteristics in addition to Key Stage 2 attainment in this version. But lots of other options are possible and these would produce different results. In fact, if you use our FFT Aspire system, we use a different (though similar) model in there. In most cases, results will be very similar but there might be some large differences in a handful of cases.
Neither Progress 8 nor its contextualised version is a measure of school effectiveness. And neither is necessarily a “good” or “bad” measure. That really depends on how they’re used. But we think that using contextualised Progress 8 together with Progress 8 (and raw attainment) gives a more complete picture of pupil achievement than either on its own.
Want to stay up-to-date with the latest research from FFT Education Datalab? Sign up to Datalab’s mailing list to get notifications about new blogposts, or to receive the team’s half-termly newsletter.

[1] Pupils whose first language was listed as something other than English in the Year 11 Spring census (this is unlikely to capture all pupils who actually have a first language other than English because first language for some pupils changes over time)
[3] We choose SEN status in Year 6 rather than at the end of Year 11 because schools have some control over SEN status
[4] Could also be due to schools having different proportions of pupils with different levels of persistent disadvantage. The model uses % terms eligible for FSM rather than FSM6.
is the x axis correct on the ‘% schools by 2023 contextualized P8 score and percentage of cohort FSM6’ chart? Supporting comment says ‘ Around 50% of schools in each disadvantage grouping have a contextualised Progress 8 score of 0.0 or higher. ‘ but the chart looks as though most schools are below zero as I read it. Thanks
Hi Mike. Another great spot! Now fixed. Thanks for raising it.
Unfortunately OFSTED, the DfE and others do not give any contextualisation and use P8 as a blunt tool. The consequence is that those in some of the most challenging schools, traditional white working class with 50%+ FSM, are very likely to be consistently told they are failing, pupils, staff, governors…..
However, this does serve a certain purpose, as without an obvious whipping dog, some of those who wield power have no contribution to make.
A very interesting piece of work. I don’t suppose you are able to share the adjustments that you made for each characteristic?
Thanks John. We didn’t extract the coefficients from SRS (the secure platform provided by ONS in which we do our work) for this piece. We’ll probably do some further work on it so will bear this in mind next time.
Thank you
Thank you for work on this. It makes for fascinating reading.
I wonder if it would be possible to work out the P8 and CP8 scores for Local Authorities.
Hi, we always liked FFTs contextualised P8, as it showed we weren’t as bad as the DFE were making us out to be!
I’ve downloaded the DFE file which gives every school’s performance measure. From that I’ve helped the school I worked at understand what Progress 8 score they should get. They had the triple whammy of ‘low average KS2 scores’ , high FSM%’ & ‘Low EAL %’. However, by looking at just schools within 0.1 of their average KS2 score, could tell them their P8 of -0.18 was basically the same as the -0.16 the pupils at similar schools achieved (for reference, the 16 schools with average KS2 of >115 achieved a Progress 8 of 0.97!
Which schools are top of FFT contextualised P8 please?
Hi Joe. You can see this by sorting the Excel file of school level scores https://ffteducationdatalab.org.uk/wp-content/uploads/2024/05/annex-1.xlsx
Hello, are there any plans to carry out the contextual calculations on the buckets as well as the overall P8? This would prove very useful.
Thank you.
Hi Ben. These are available in Aspire (along with a bunch of other indicators).