The last time we had a Labour government there was a concerted effort to improve “failing” (or sometimes even more pejoratively “sink”) schools, even if some of the methods of identifying such schools were pretty rudimentary.
Excellence in Cities, Education Action Zones, Fresh Start, Keys to Success, City Challenge, National Strategies and (City) Academies[1] to name but a few initiatives from around this time.
Back then, and much more difficult to believe now, schools in inner London were very much in the policy crosshairs.
In this article we’re going to take a step back in time to identify some of these schools and then see how they are doing now.
Identifying some “failing” schools in the early 2000s
To do this, I’m going to use the published School Performance Tables data for 2001/02.
Back then, the headline measure was the percentage of pupils achieving five or more GCSEs (or GNVQ equivalents) at grades A*-C. That’s grades 9-4 in new money. There were no restrictions on which five could be included until five A*-C including English and maths measure was introduced in 2004/05. So in 2002, you could achieve an intermediate GNVQ (worth four GCSEs) and a GCSE at A*-C in one subject to hit five A*-C threshold.
In 2002, 50% of pupils achieved five or more A*-C grades nationally. However, at some schools this figure was less than 20%. The first “floor targets” were introduced a couple of years later, using 20% as the minimum target all schools should reach.
For this analysis, we pick out “persistently low attaining” schools in 2002. These are schools at which fewer than 20% of pupils achieved five or more A*-C grades at GCSE in at least three of the four years between 1999 and 2002 inclusive.
This would be seen nowadays as a rather simplistic way of going about the identification of low-attaining schools. Although some rudimentary value-added measures were published back then, they predated the widescale appreciation of the impact of variations in intake on school performance measures and, alongside this, the development of contextual value added measures from Key Stage 2 to Key Stage 4, in which my late colleague Mike Treadaway played no small part. Some of these schools could have been performing well given their intakes back in 2002.
But leaving that to one side, let’s take a look at attainment in these schools alongside disadvantage, using the contemporaneous free school meal (FSM) eligibility rate for each school.
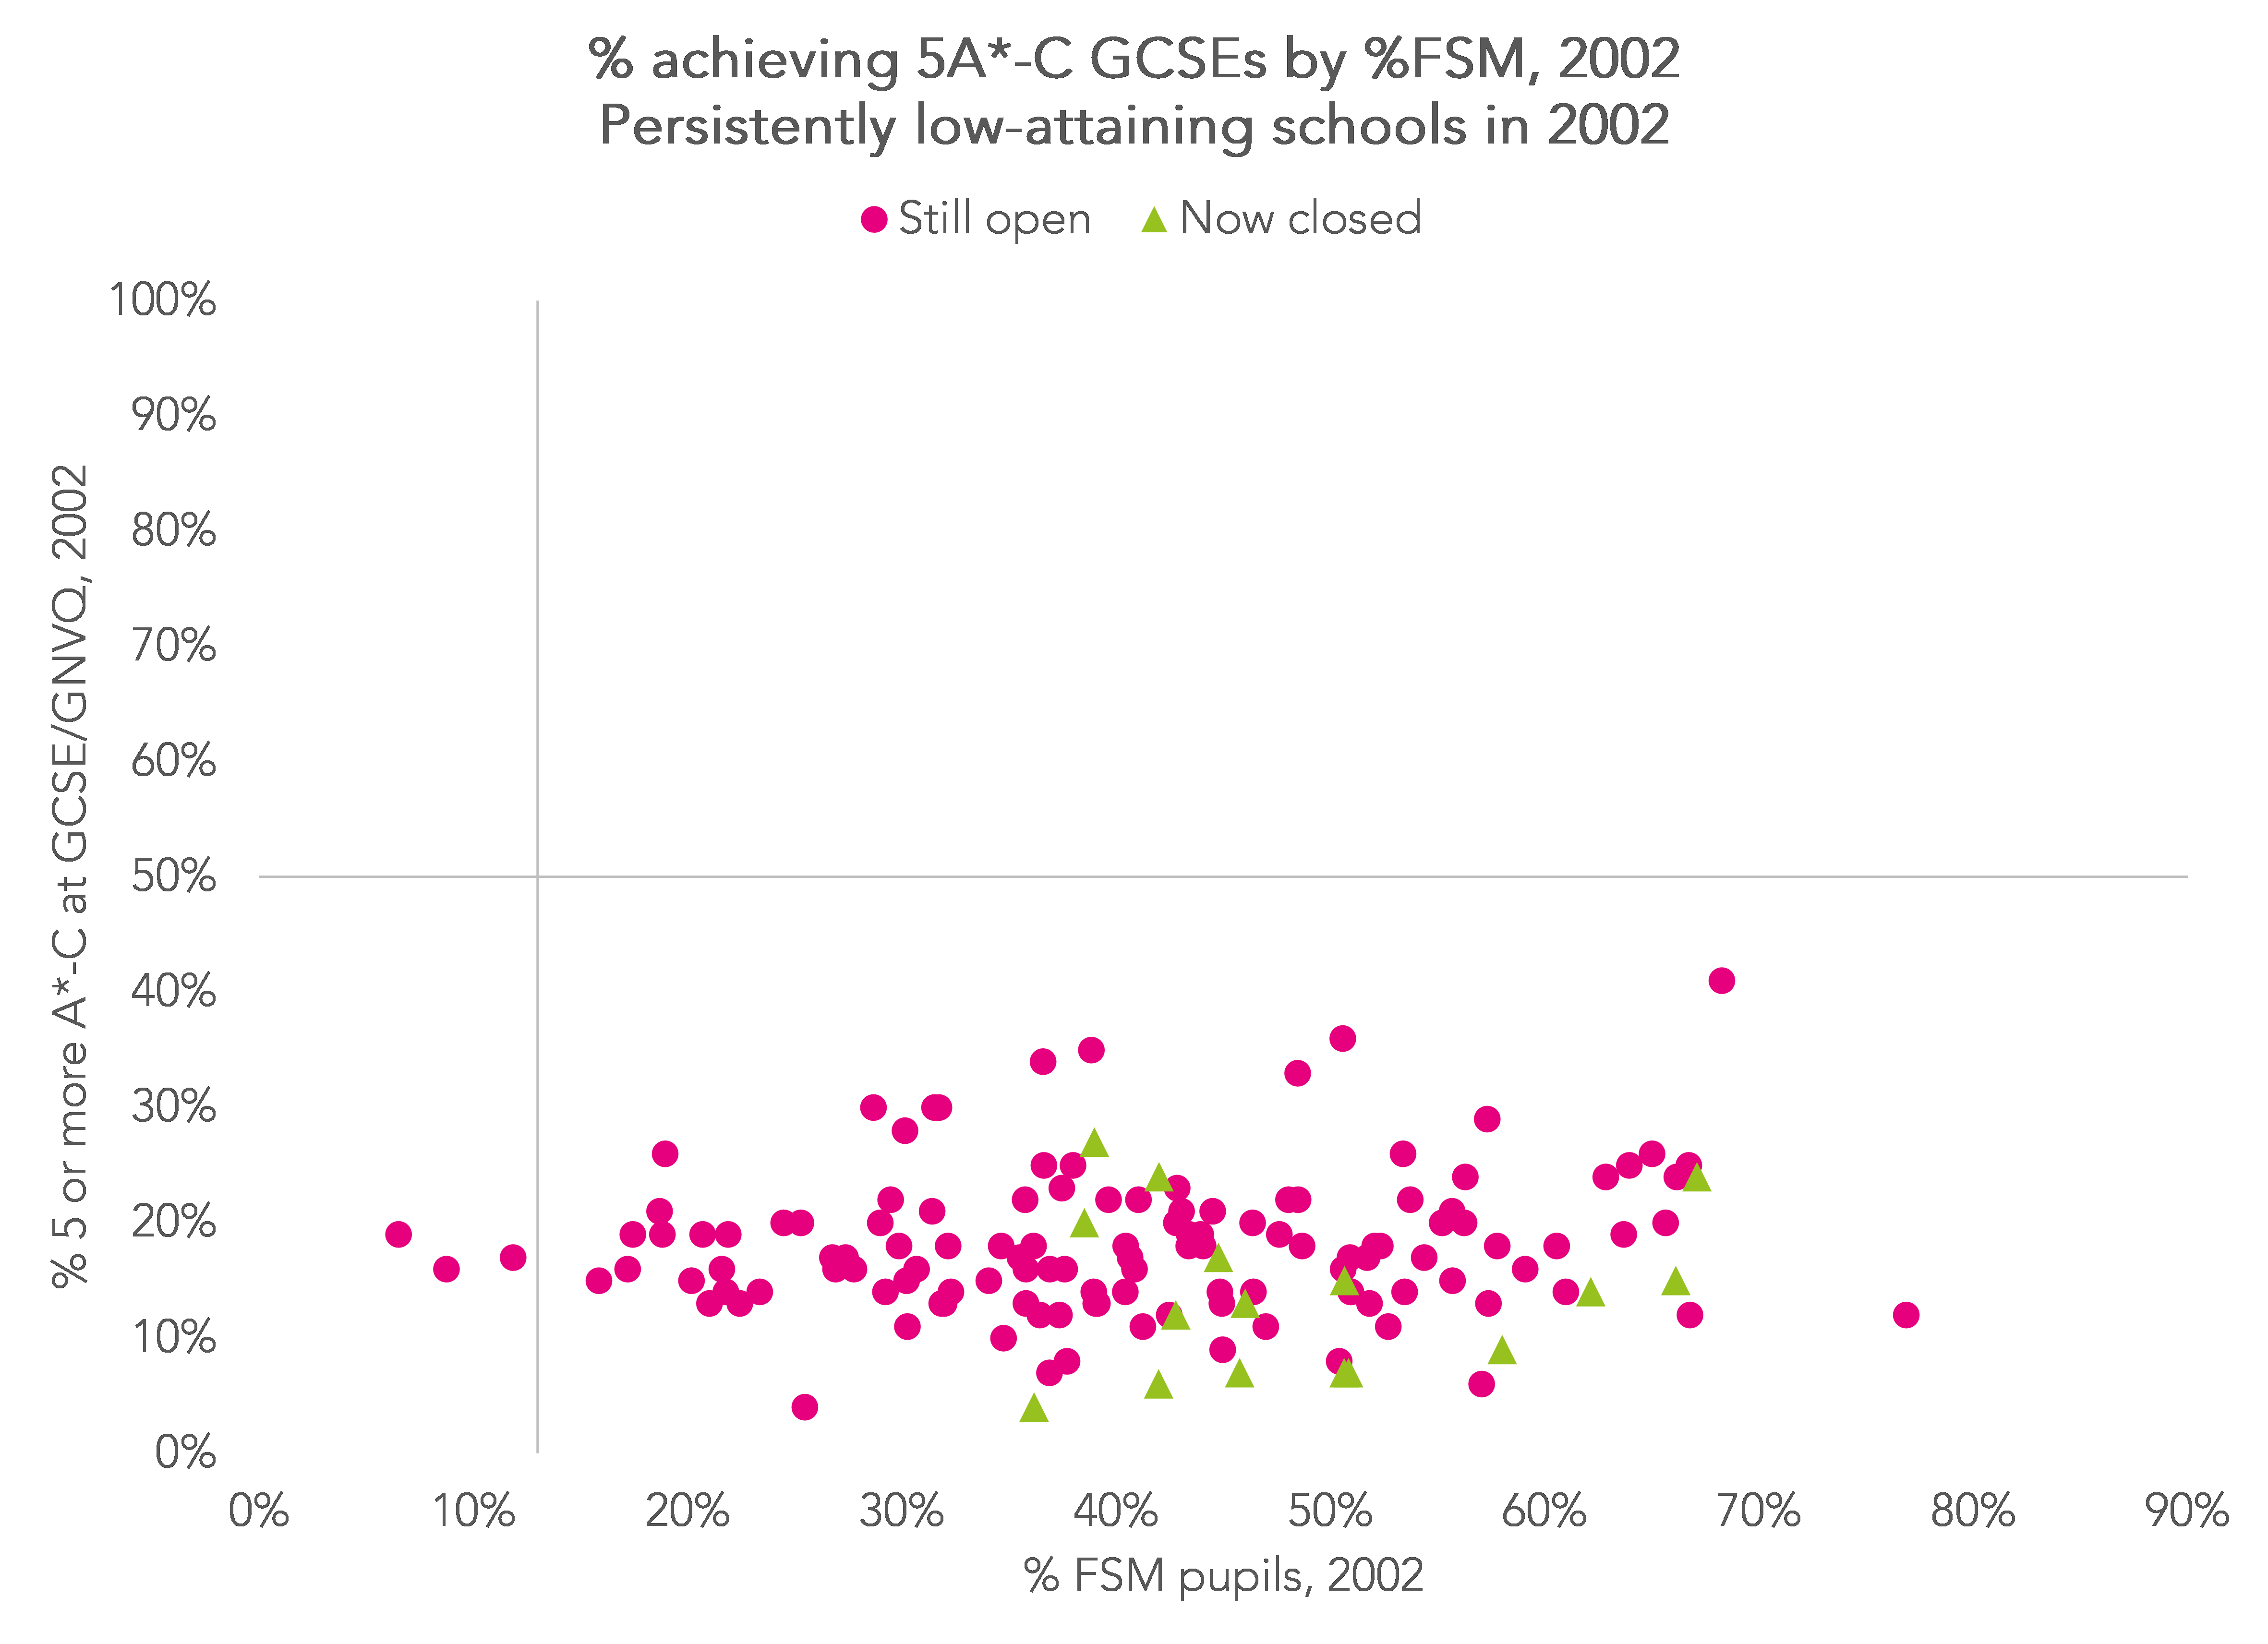
The axes are centred around national averages (50% five A*-C and 13% FSM eligibility). All our schools are plotted below the national average for attainment and most are plotted above the national average for FSM eligibility. Some of our schools achieved more than 20% five A*-C in 2002 but would have fallen below this figure in each of the previous three years.
16 of the schools have closed outright since 2002. These are plotted as green triangles.
What types of schools are they?
The remainder are open in some form although may have undergone many changes including merging with other schools or closing and reopening as an academy (or both). Indeed, five of the schools would reopen as academies in 2003/04[2].
To begin with, let’s look at what types of schools they were and how they are now (or at least the type they were in August 2023).
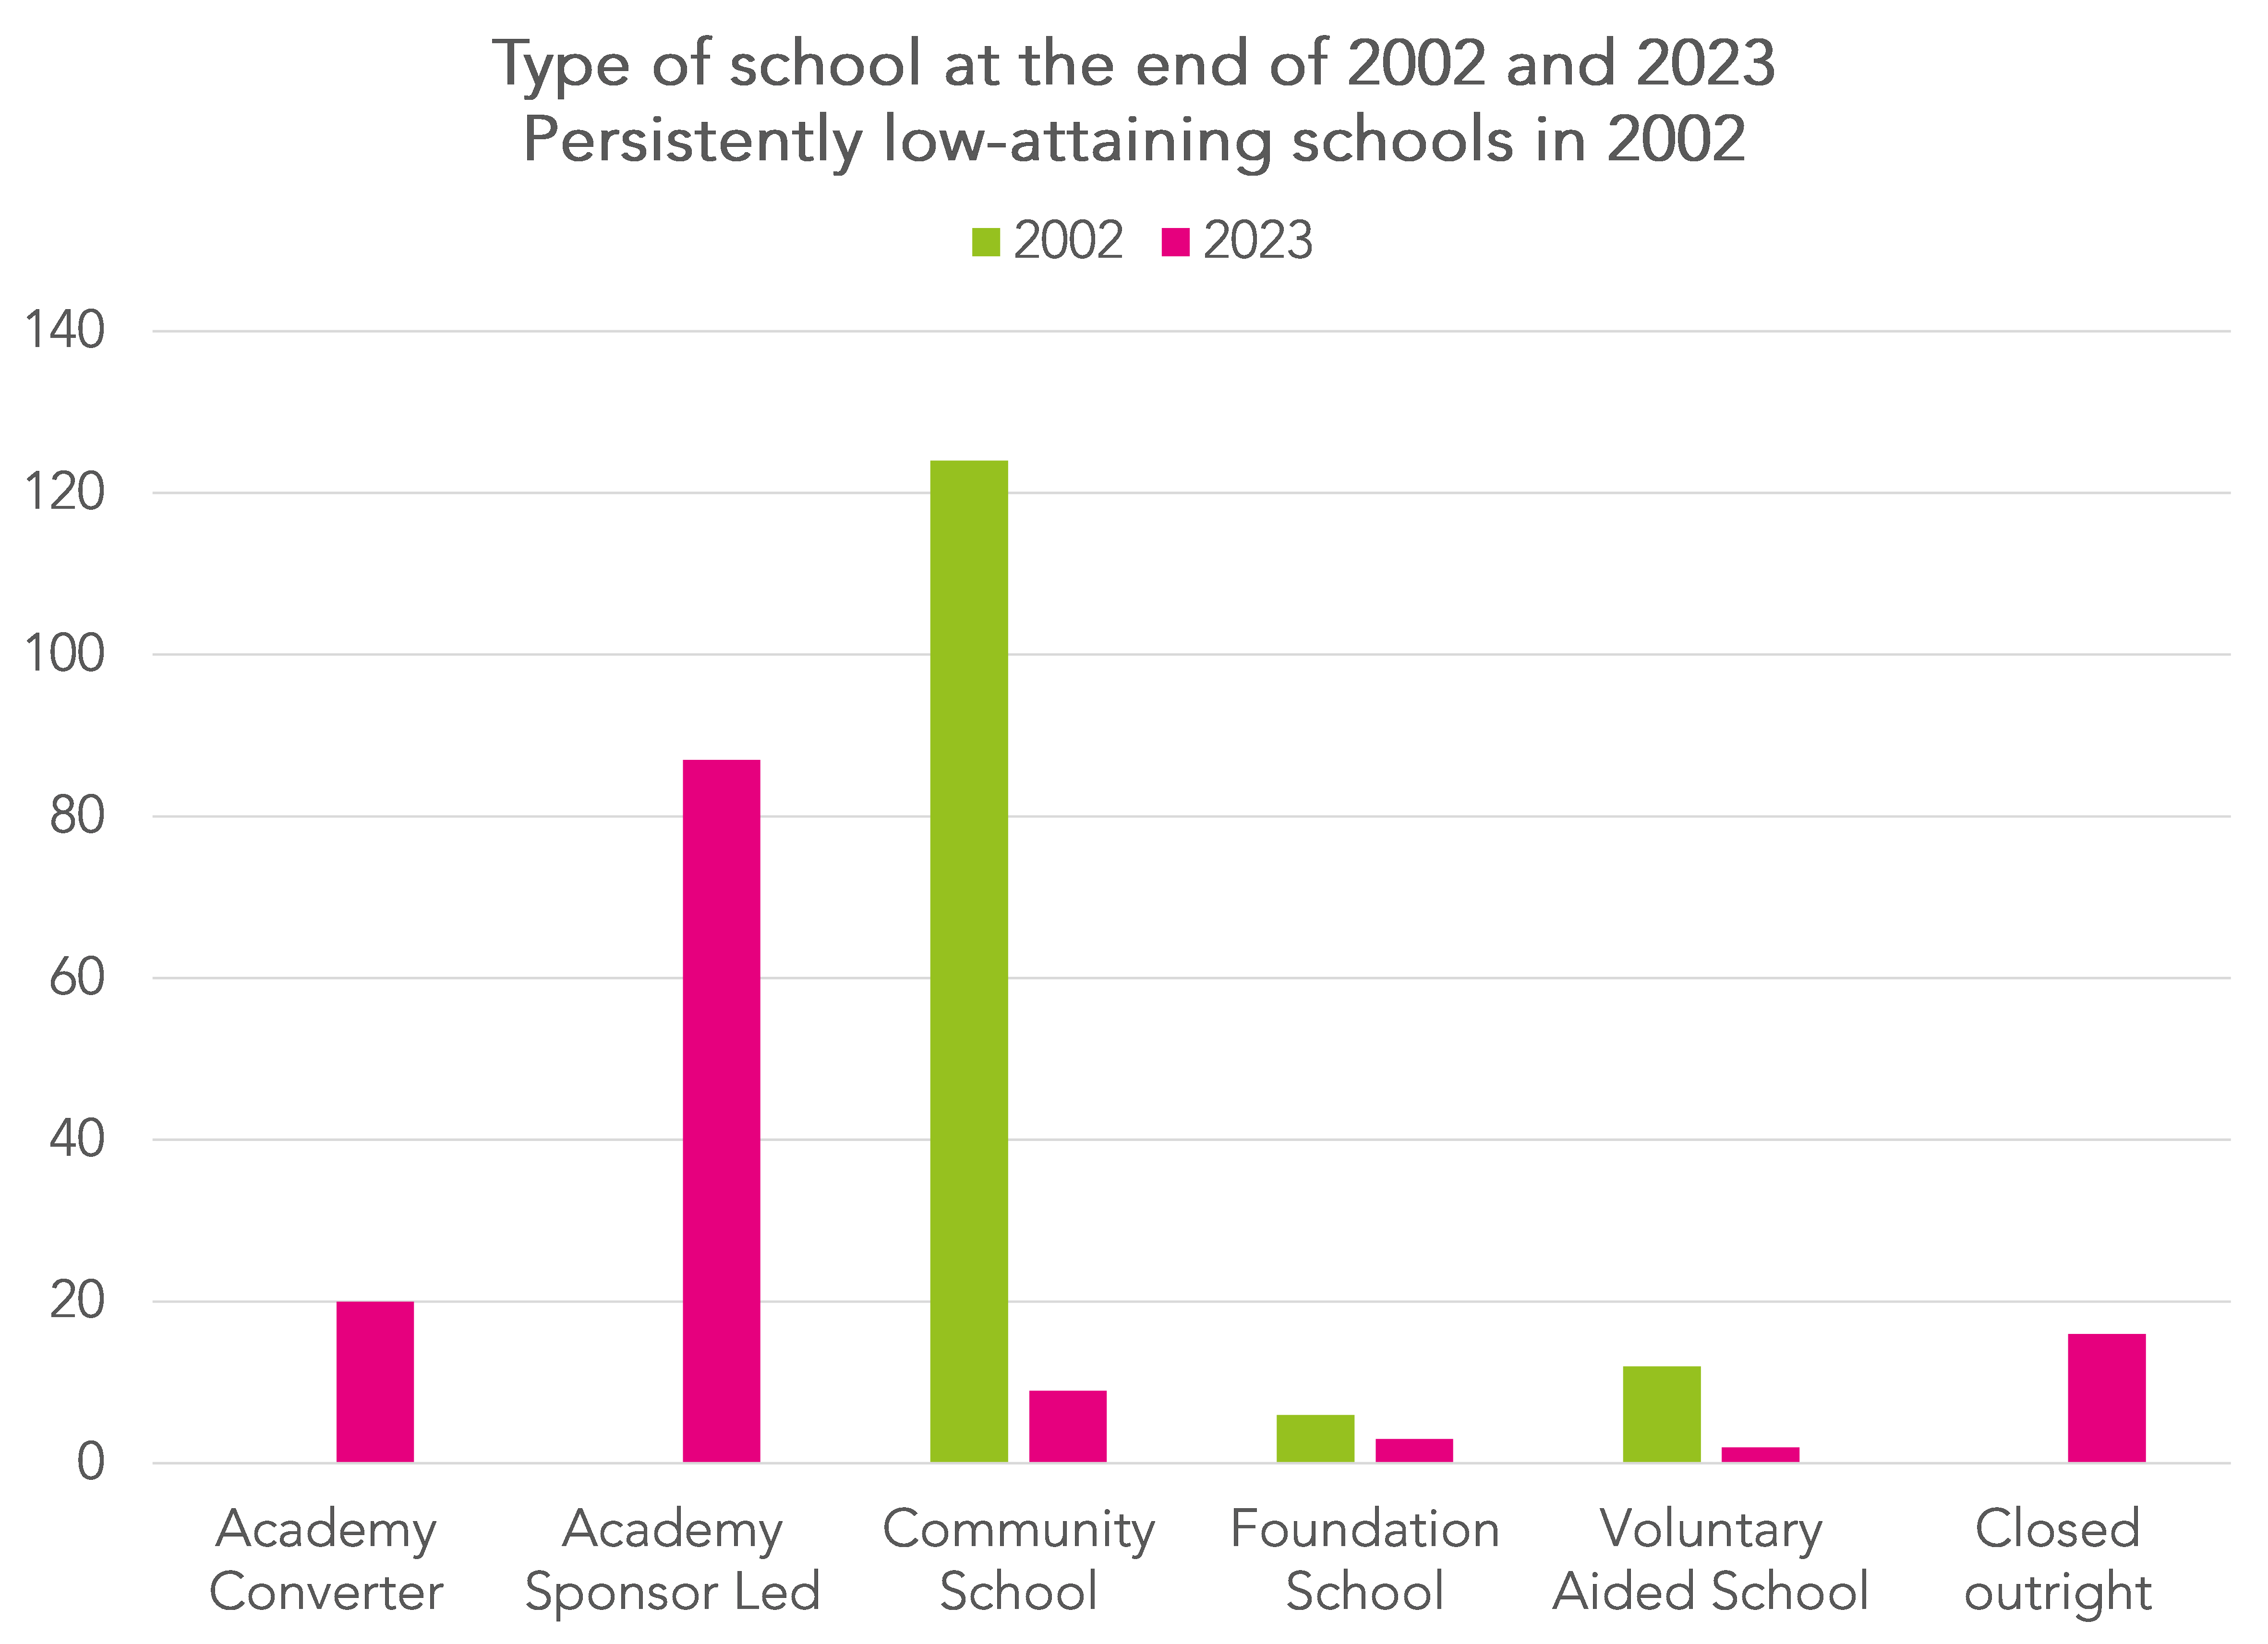
The vast majority were community schools maintained by local authorities in 2002. Although some remain, most are now sponsored academies.
The chart below shows the year when each of the 142 schools made way for an academy. In total, 113 did so.
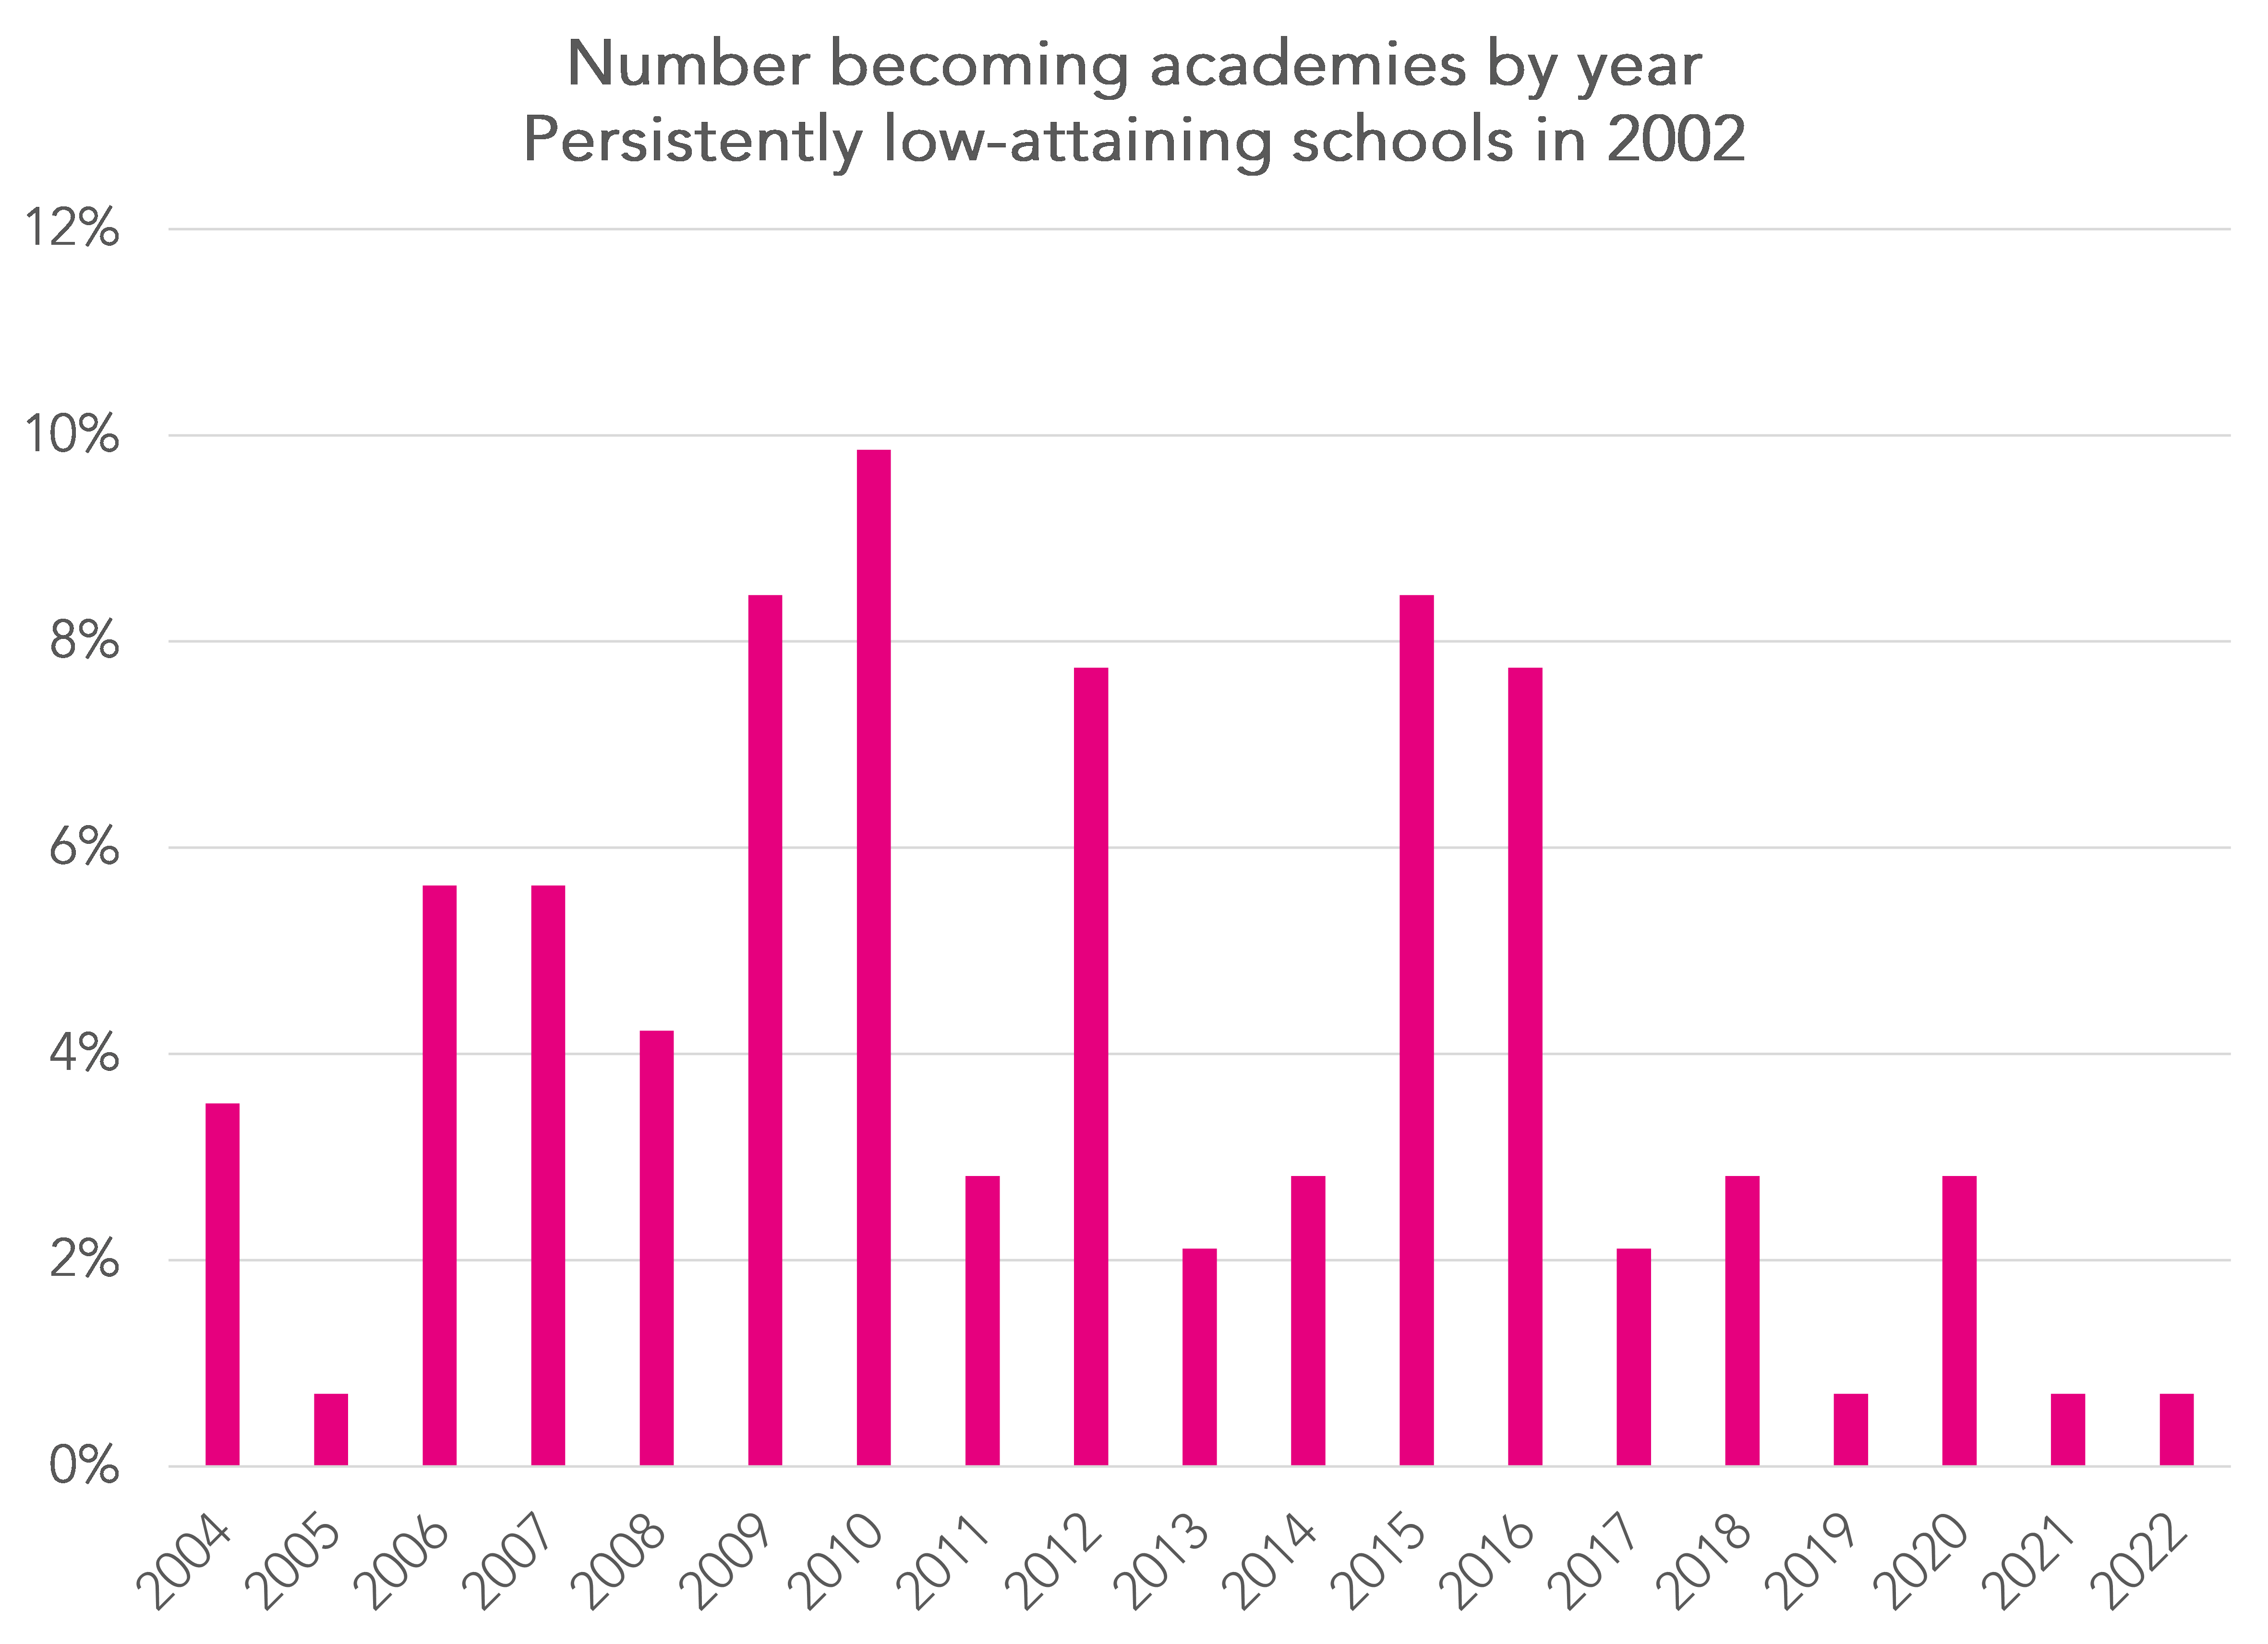
Half of the 142 schools had become academies by the end of 2012/13.
Attainment in 2023
Now let’s have a look at attainment at the 126 schools that have remained open in some form.
The five A*-C measure is no longer published. The nearest proxy we have is the percentage of pupils achieving 9-4 in both GCSE English and GCSE maths. The national average was 65%.
We plot this against Year 11 disadvantage using the percentage of pupils eligible for free school meals in the last 6 years. The national average was 26%.
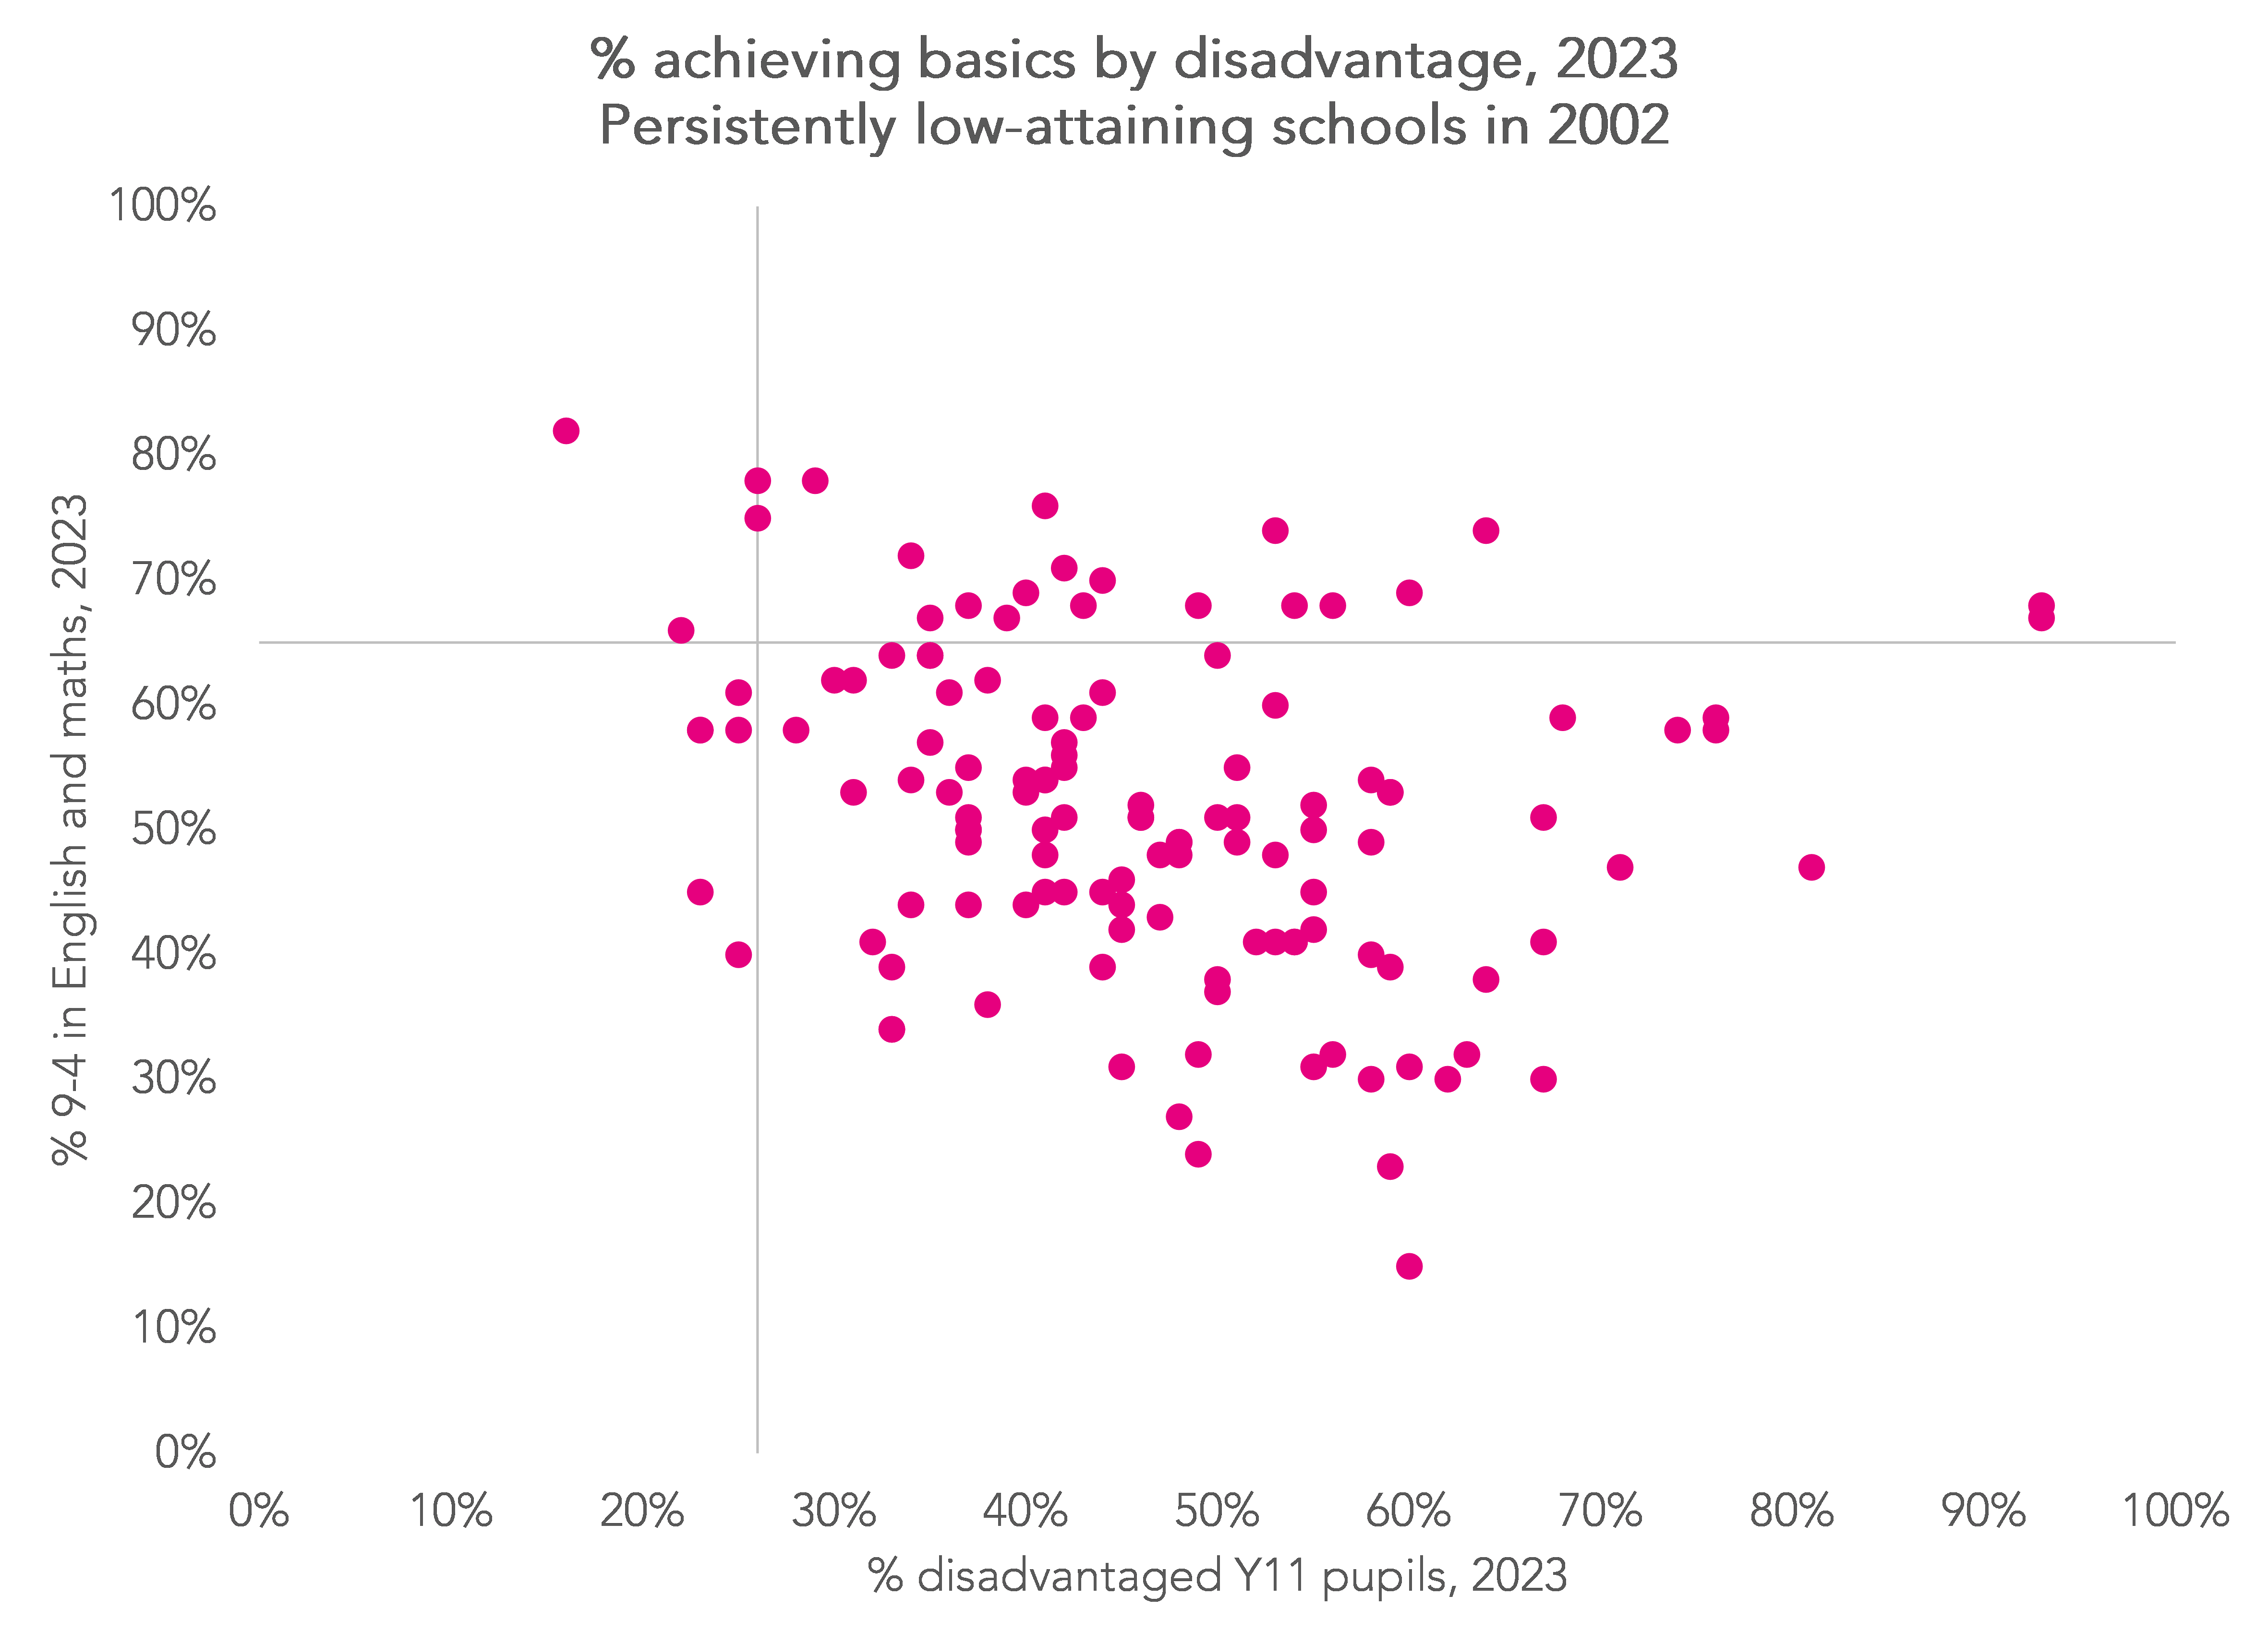
Most of the schools still have below-average levels of attainment and above average levels of disadvantage.
The attainment rate fell below 20% at just one school. However, given that the national average for this indicator (65%) was higher than the average of the indicator used for 2002 (50%) this should not be a surprise. 15 schools had a level of attainment below 35%.
The headline measure published in secondary Performance Tables these days is, of course, Progress 8. Let’s take a look at that for the 126 schools.
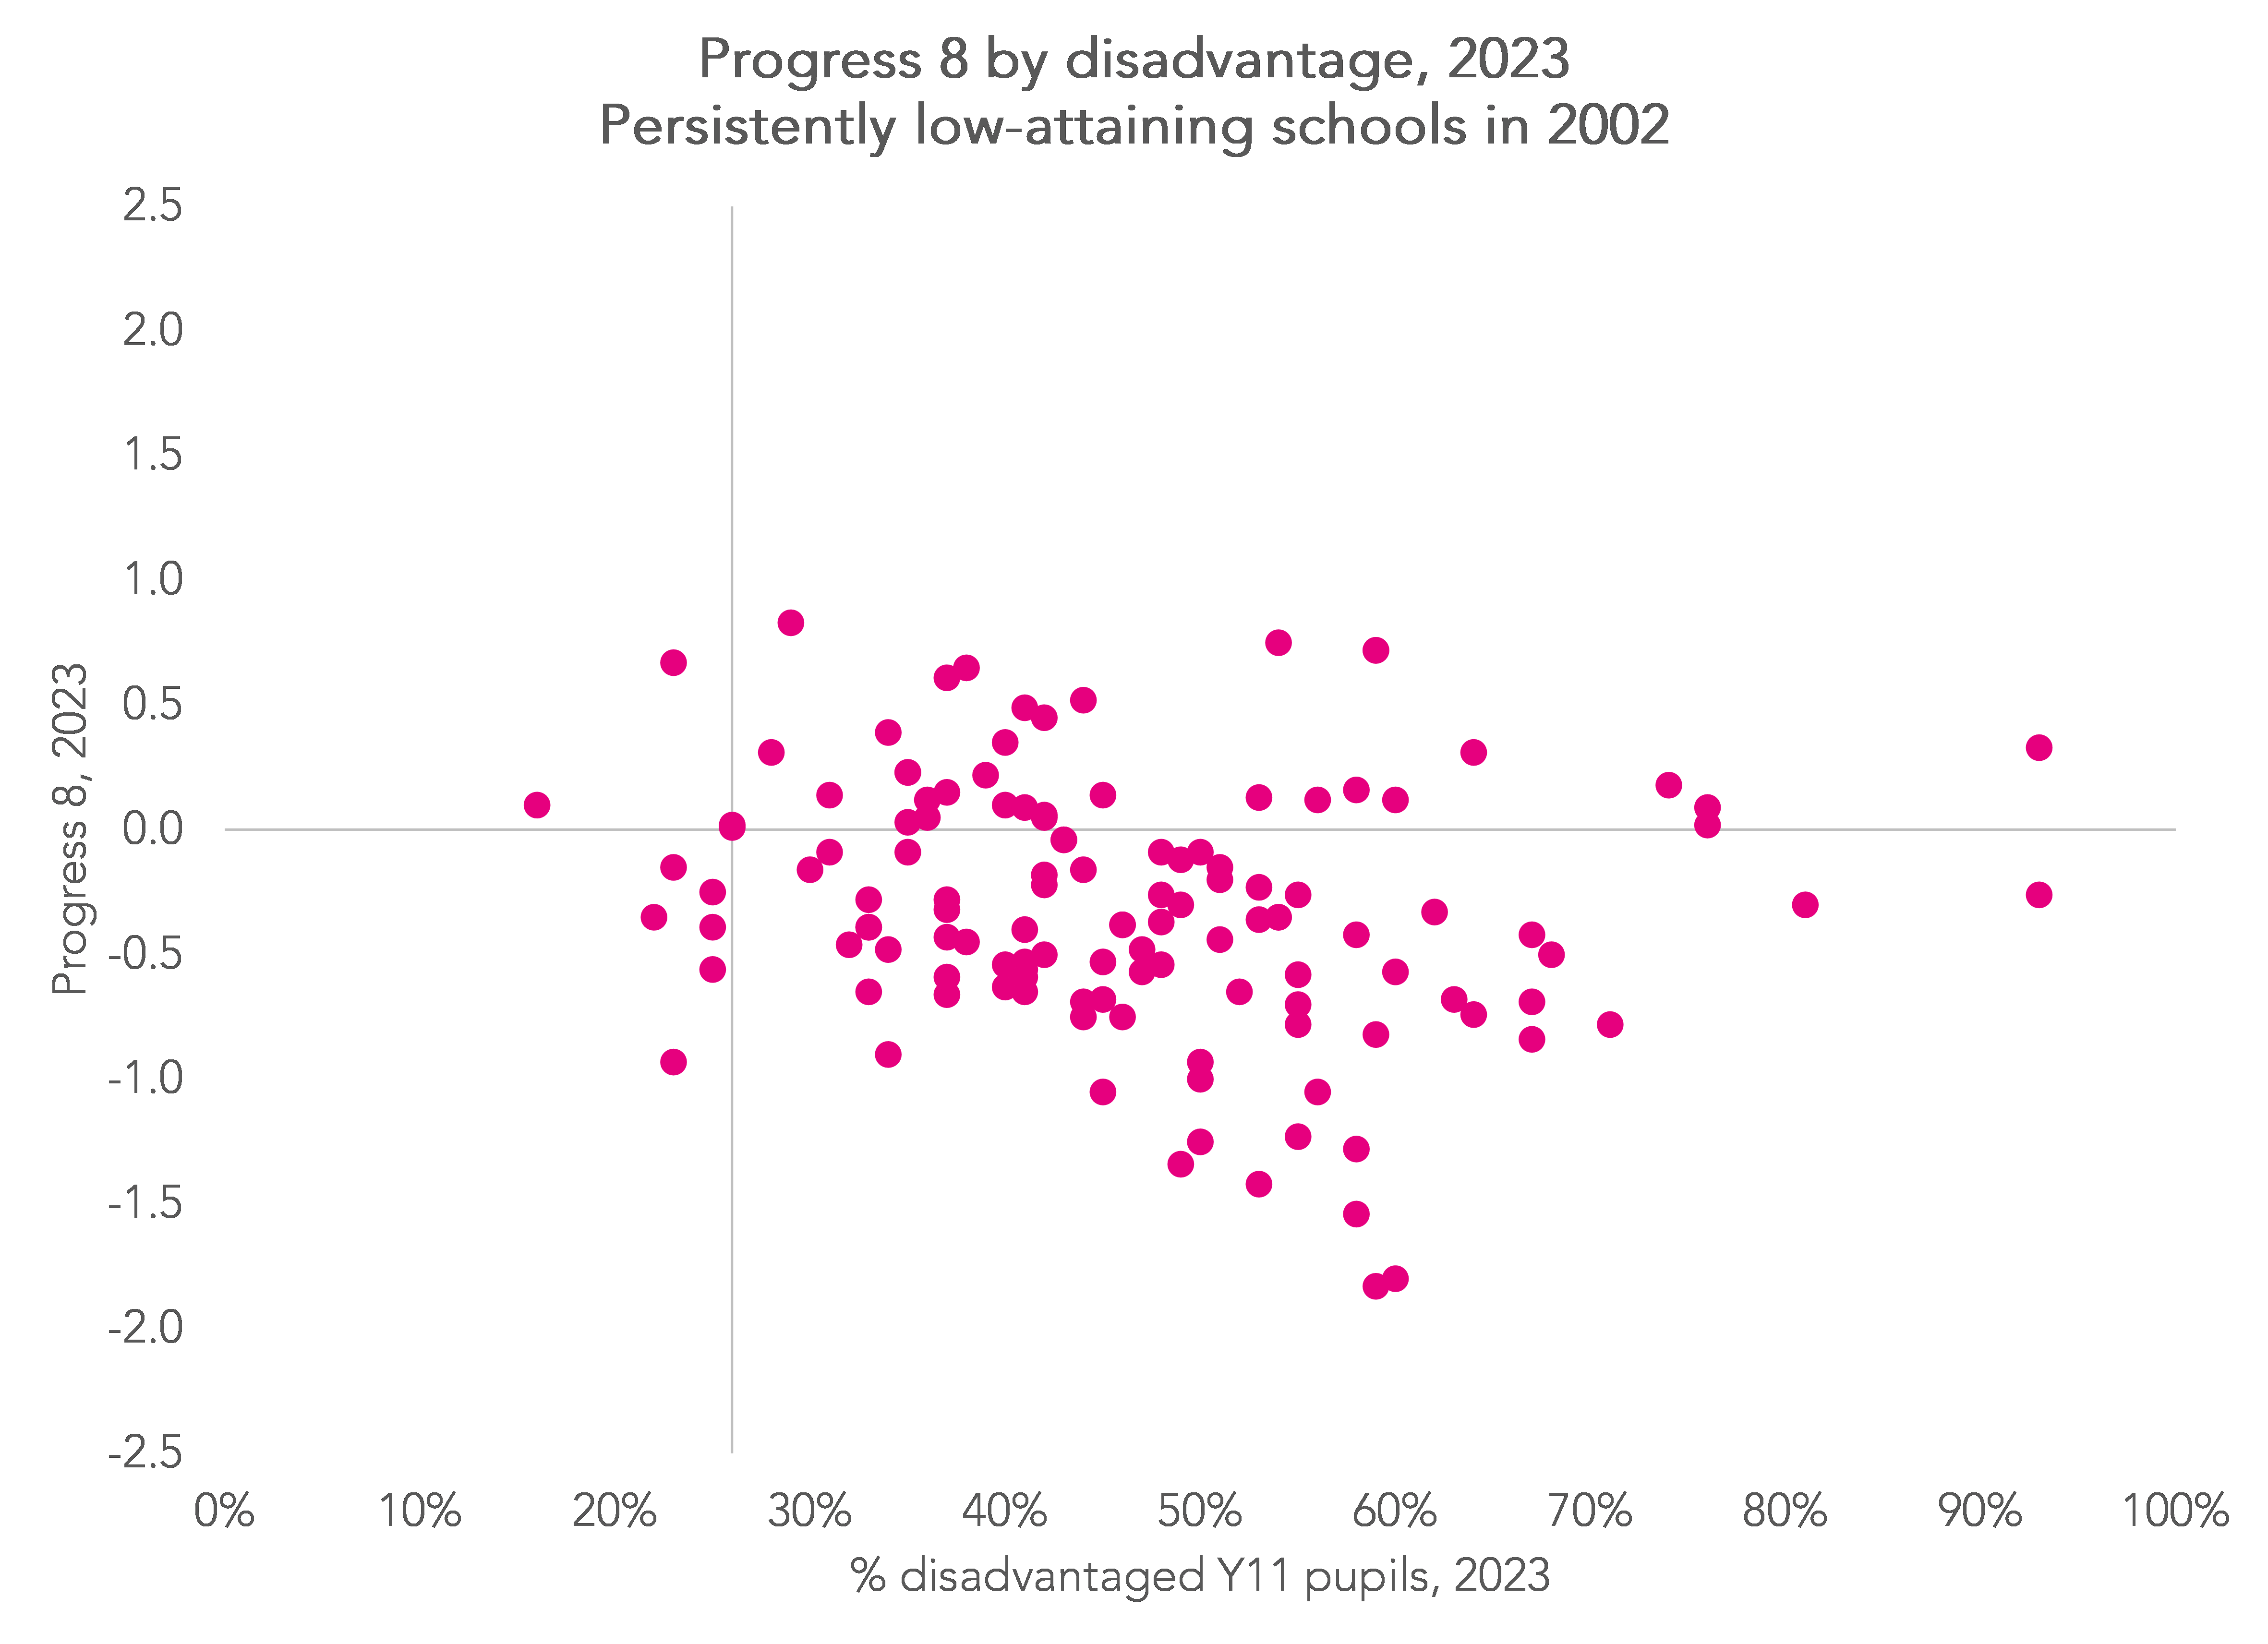
The picture is relatively mixed. 8 schools achieved a P8 score of 0.5 or higher[3] but 44 achieved a score of -0.5 or lower.
We can expand things further by charting contextualised Progress 8 scores.
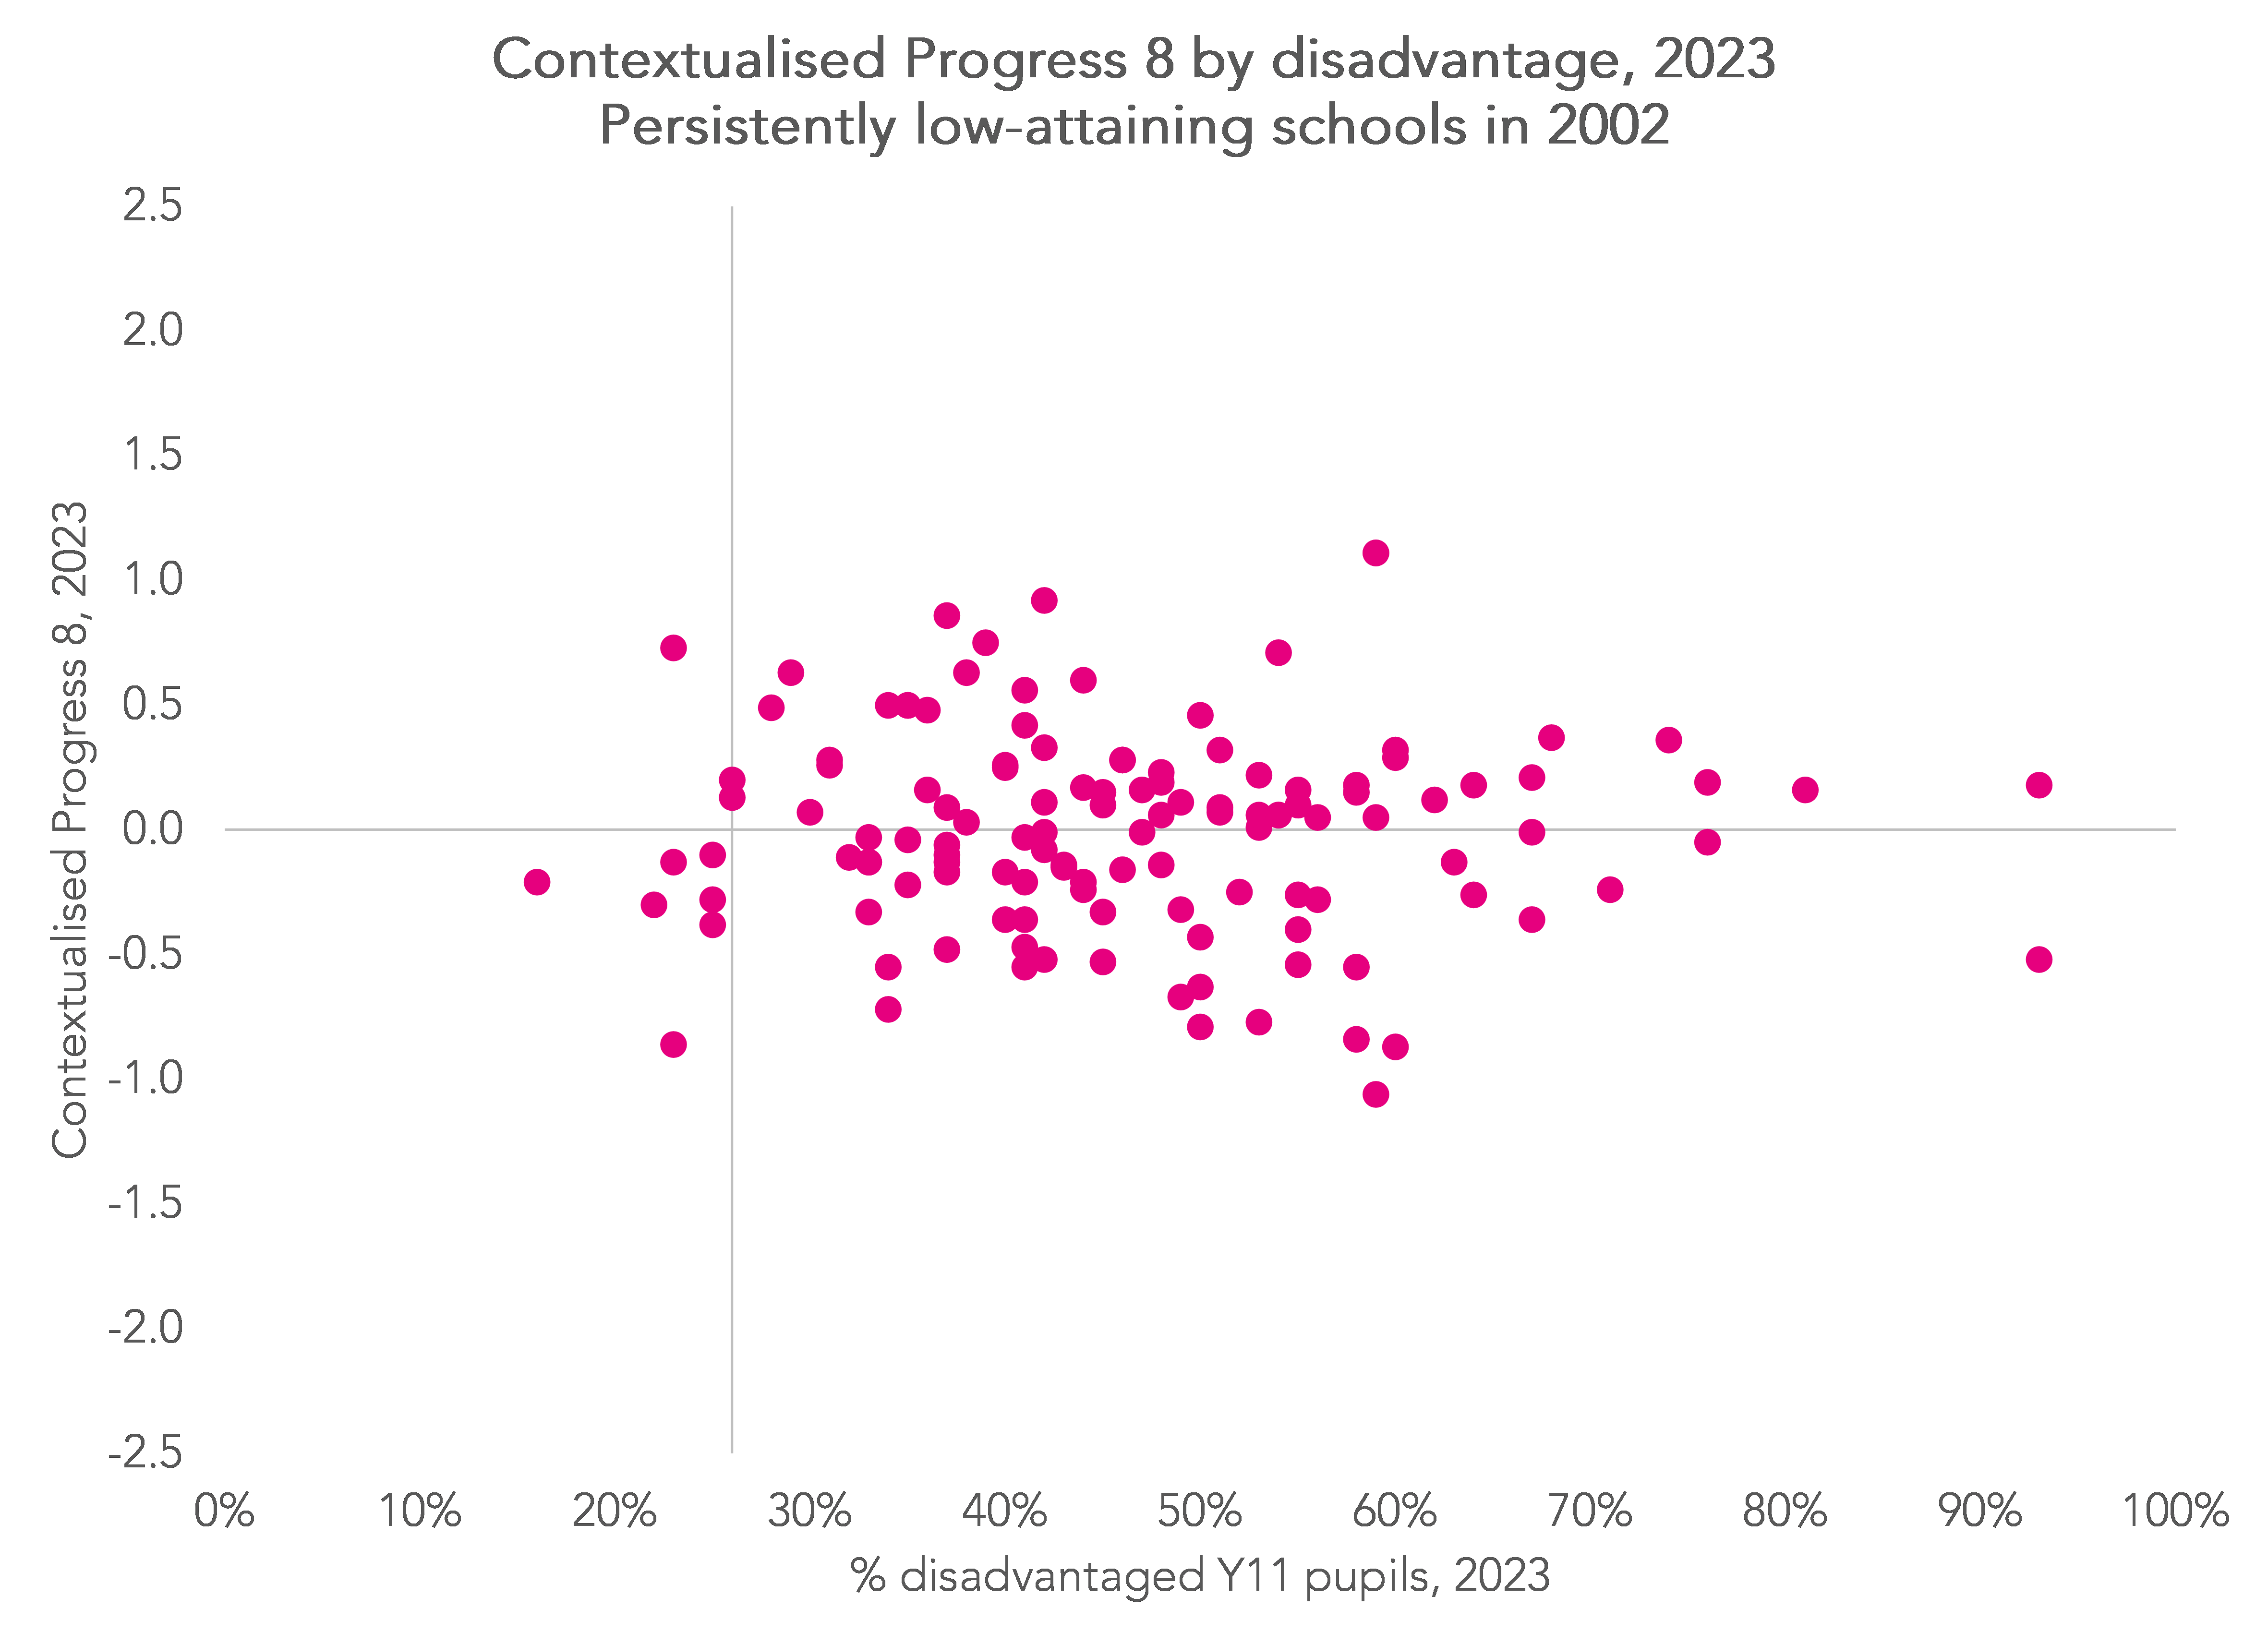
Given that we are explicitly taking into account disadvantage, the picture is correspondingly more positive. 14 schools now have a score of 0.5 or higher and just 16 have a score of -0.5 or lower.
On average, the mean contextualised P8 score of the previously low-attaining schools was exactly 0. The same as the average of all other schools.
Inspection outcomes
We observe Ofsted inspection outcomes for the 142 schools (and their successor schools, where applicable) from September 2002 to the end of August 2023.
Firstly, let’s look at overall effectiveness in schools’ latest inspections as at August 2023.
We’ve already seen that 16 of the schools closed outright, bringing down our total from 142 to 126. In fact, some of them have merged together. The 126 schools are currently 121 schools.
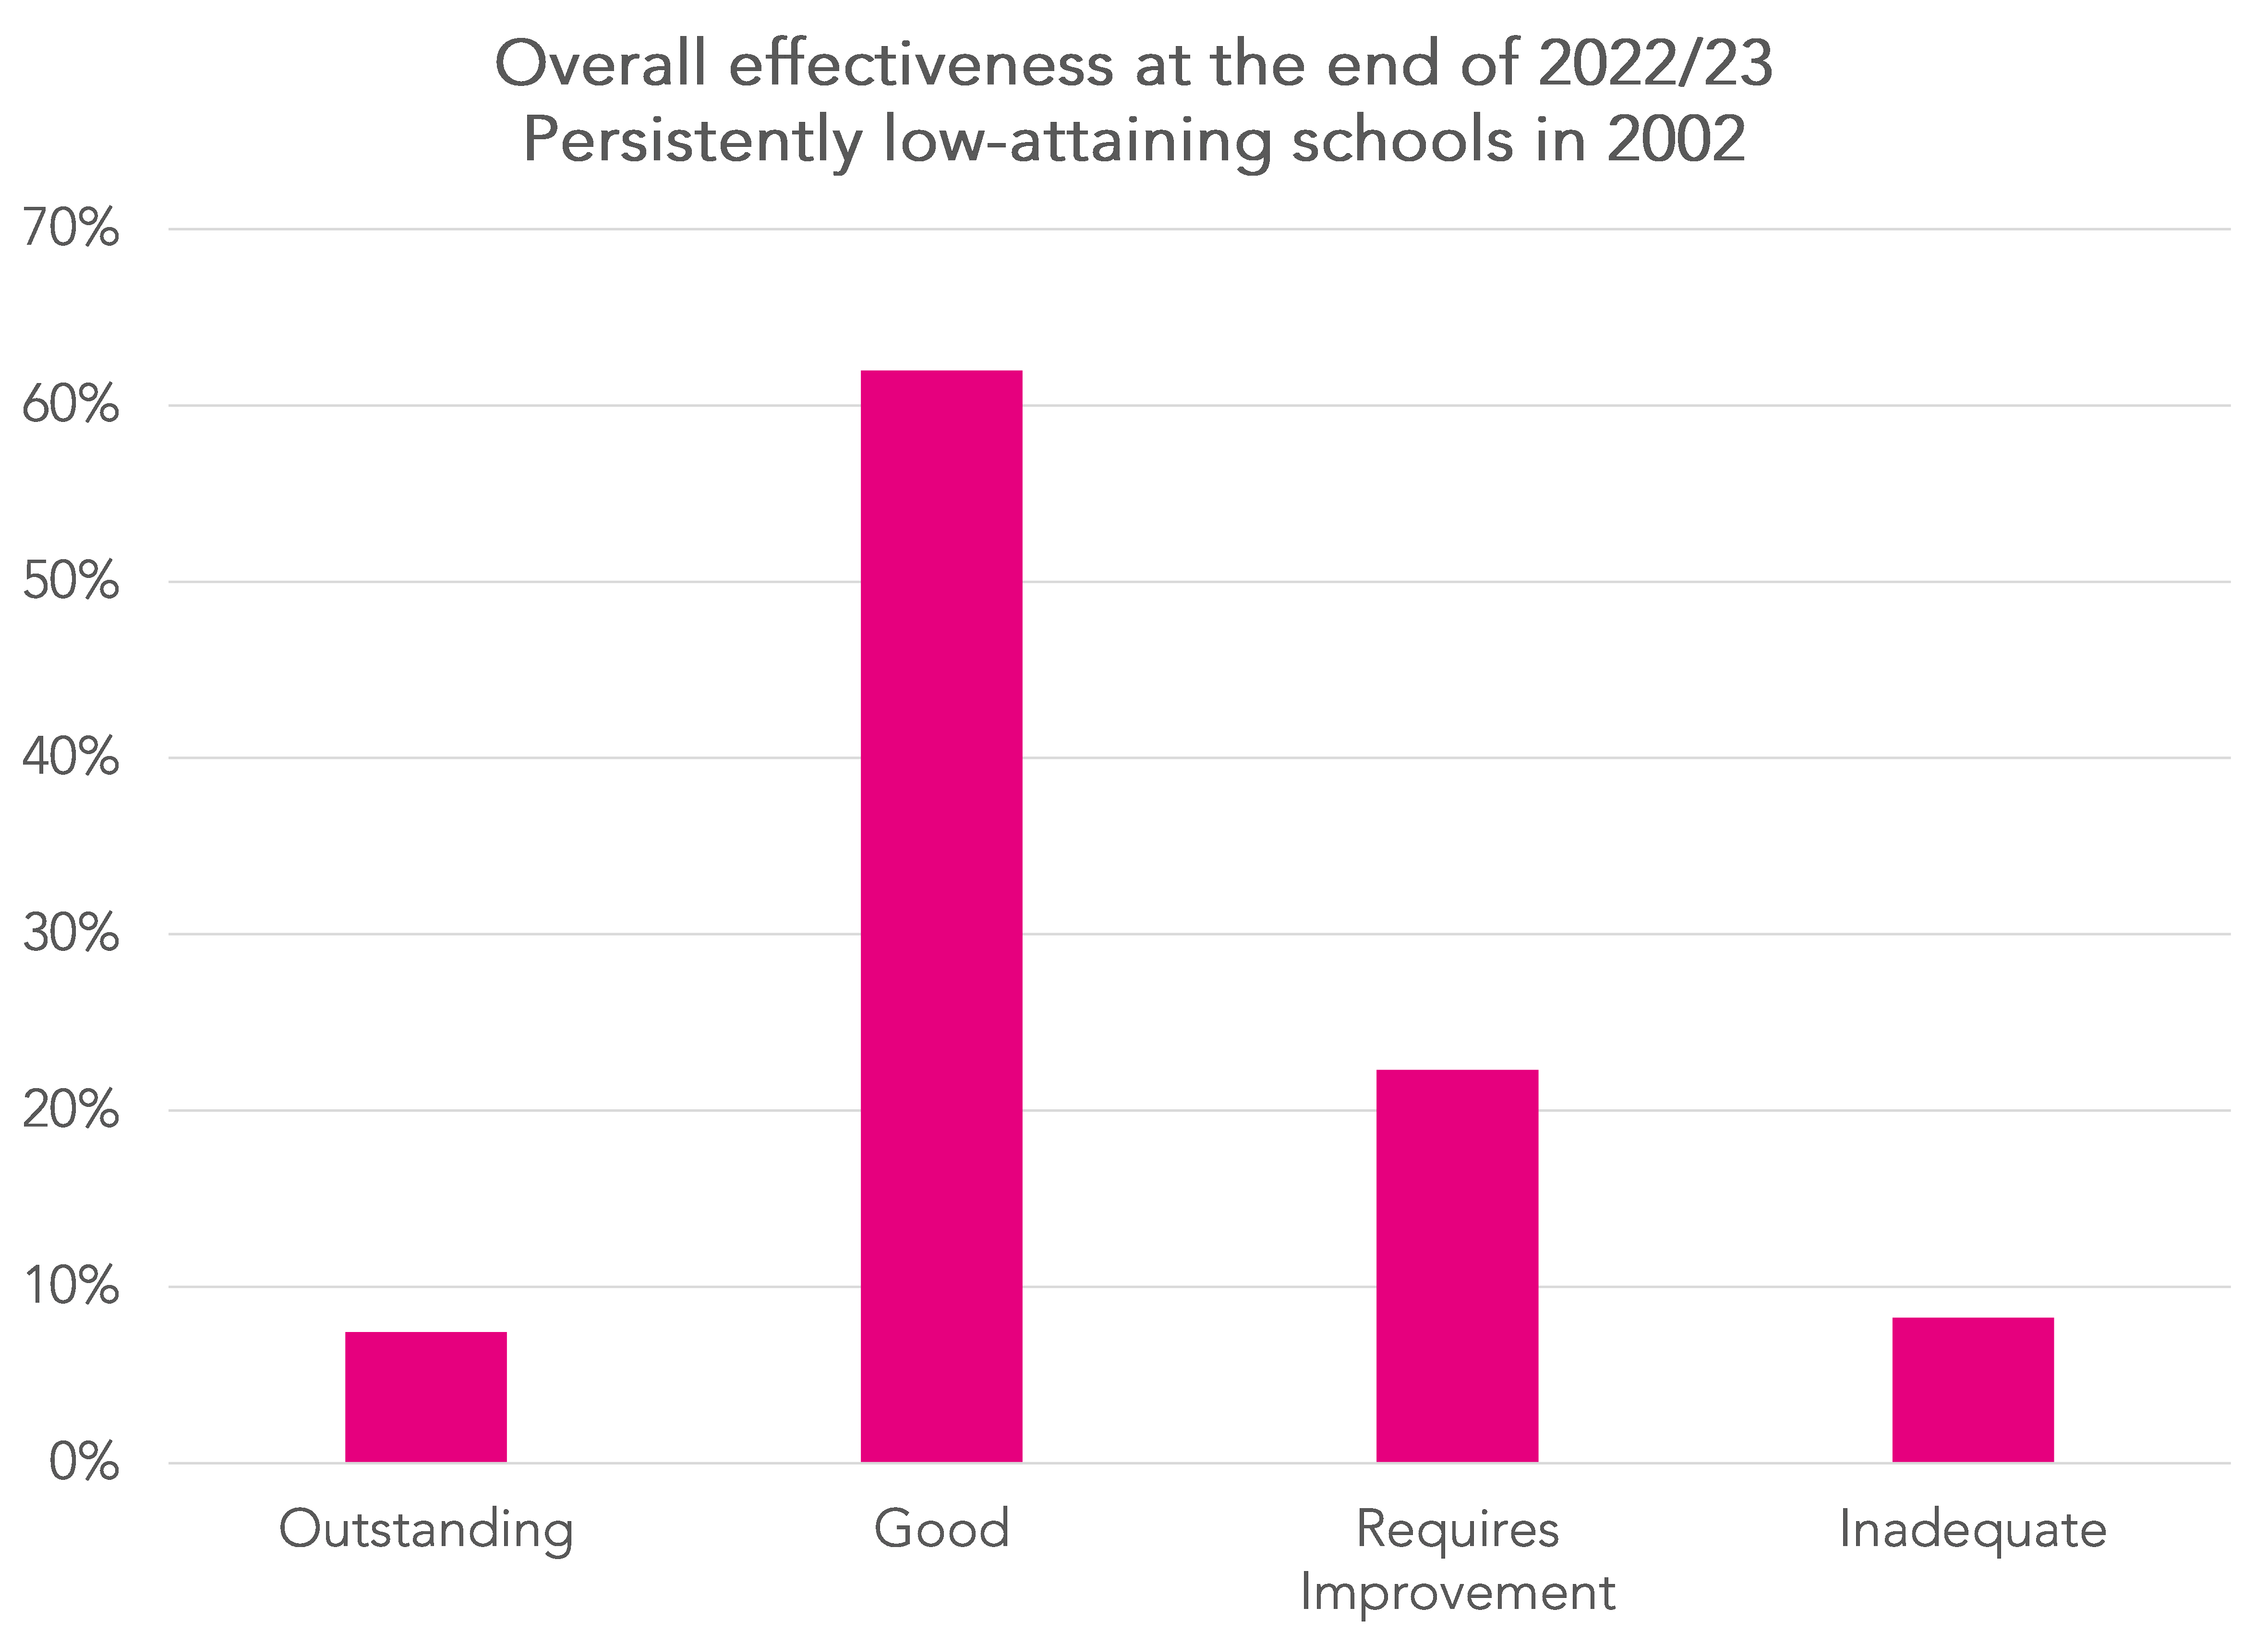
Of the 121, 9 (7%) were graded outstanding at the end of 2023, albeit 2 were last inspected 10 years ago. These were:
- Carlton Bolling, Bradford
- Cockburn School, Leeds
- Harris Academy Battersea
- Harris Academy Greenwich
- Harris Academy Morden
- Kingsdale Foundation School, Southwark
- Lilian Baylis Technology School, Lambeth
- Ormiston Venture Academy, Great Yarmouth
- St George’s Catholic School, Westminster
6 of the 9 are in London. The improvement in attainment in London’s schools is one of the most enduring unresolved mysteries in education.
37 (30%) were rated less than good. However, we can use data on overall inspection outcomes from 2002 onwards to calculate how many have never been graded good.
This is a period during which the inspection framework, and the grades awarded, have changed. Between 2002 and 2005, schools were graded on a 7-point scale. The familiar 4-grade scale was introduced in September 2005, with grade 3 changing meaning from “satisfactory” to “requires improvement” in 2012.
We return to our initial list of 142 schools and determine if, and when, each school (or one of its successors) was first graded good or better. Some of the schools may have been judged at least good before the end of 2001/02 but we don’t have that data readily available.
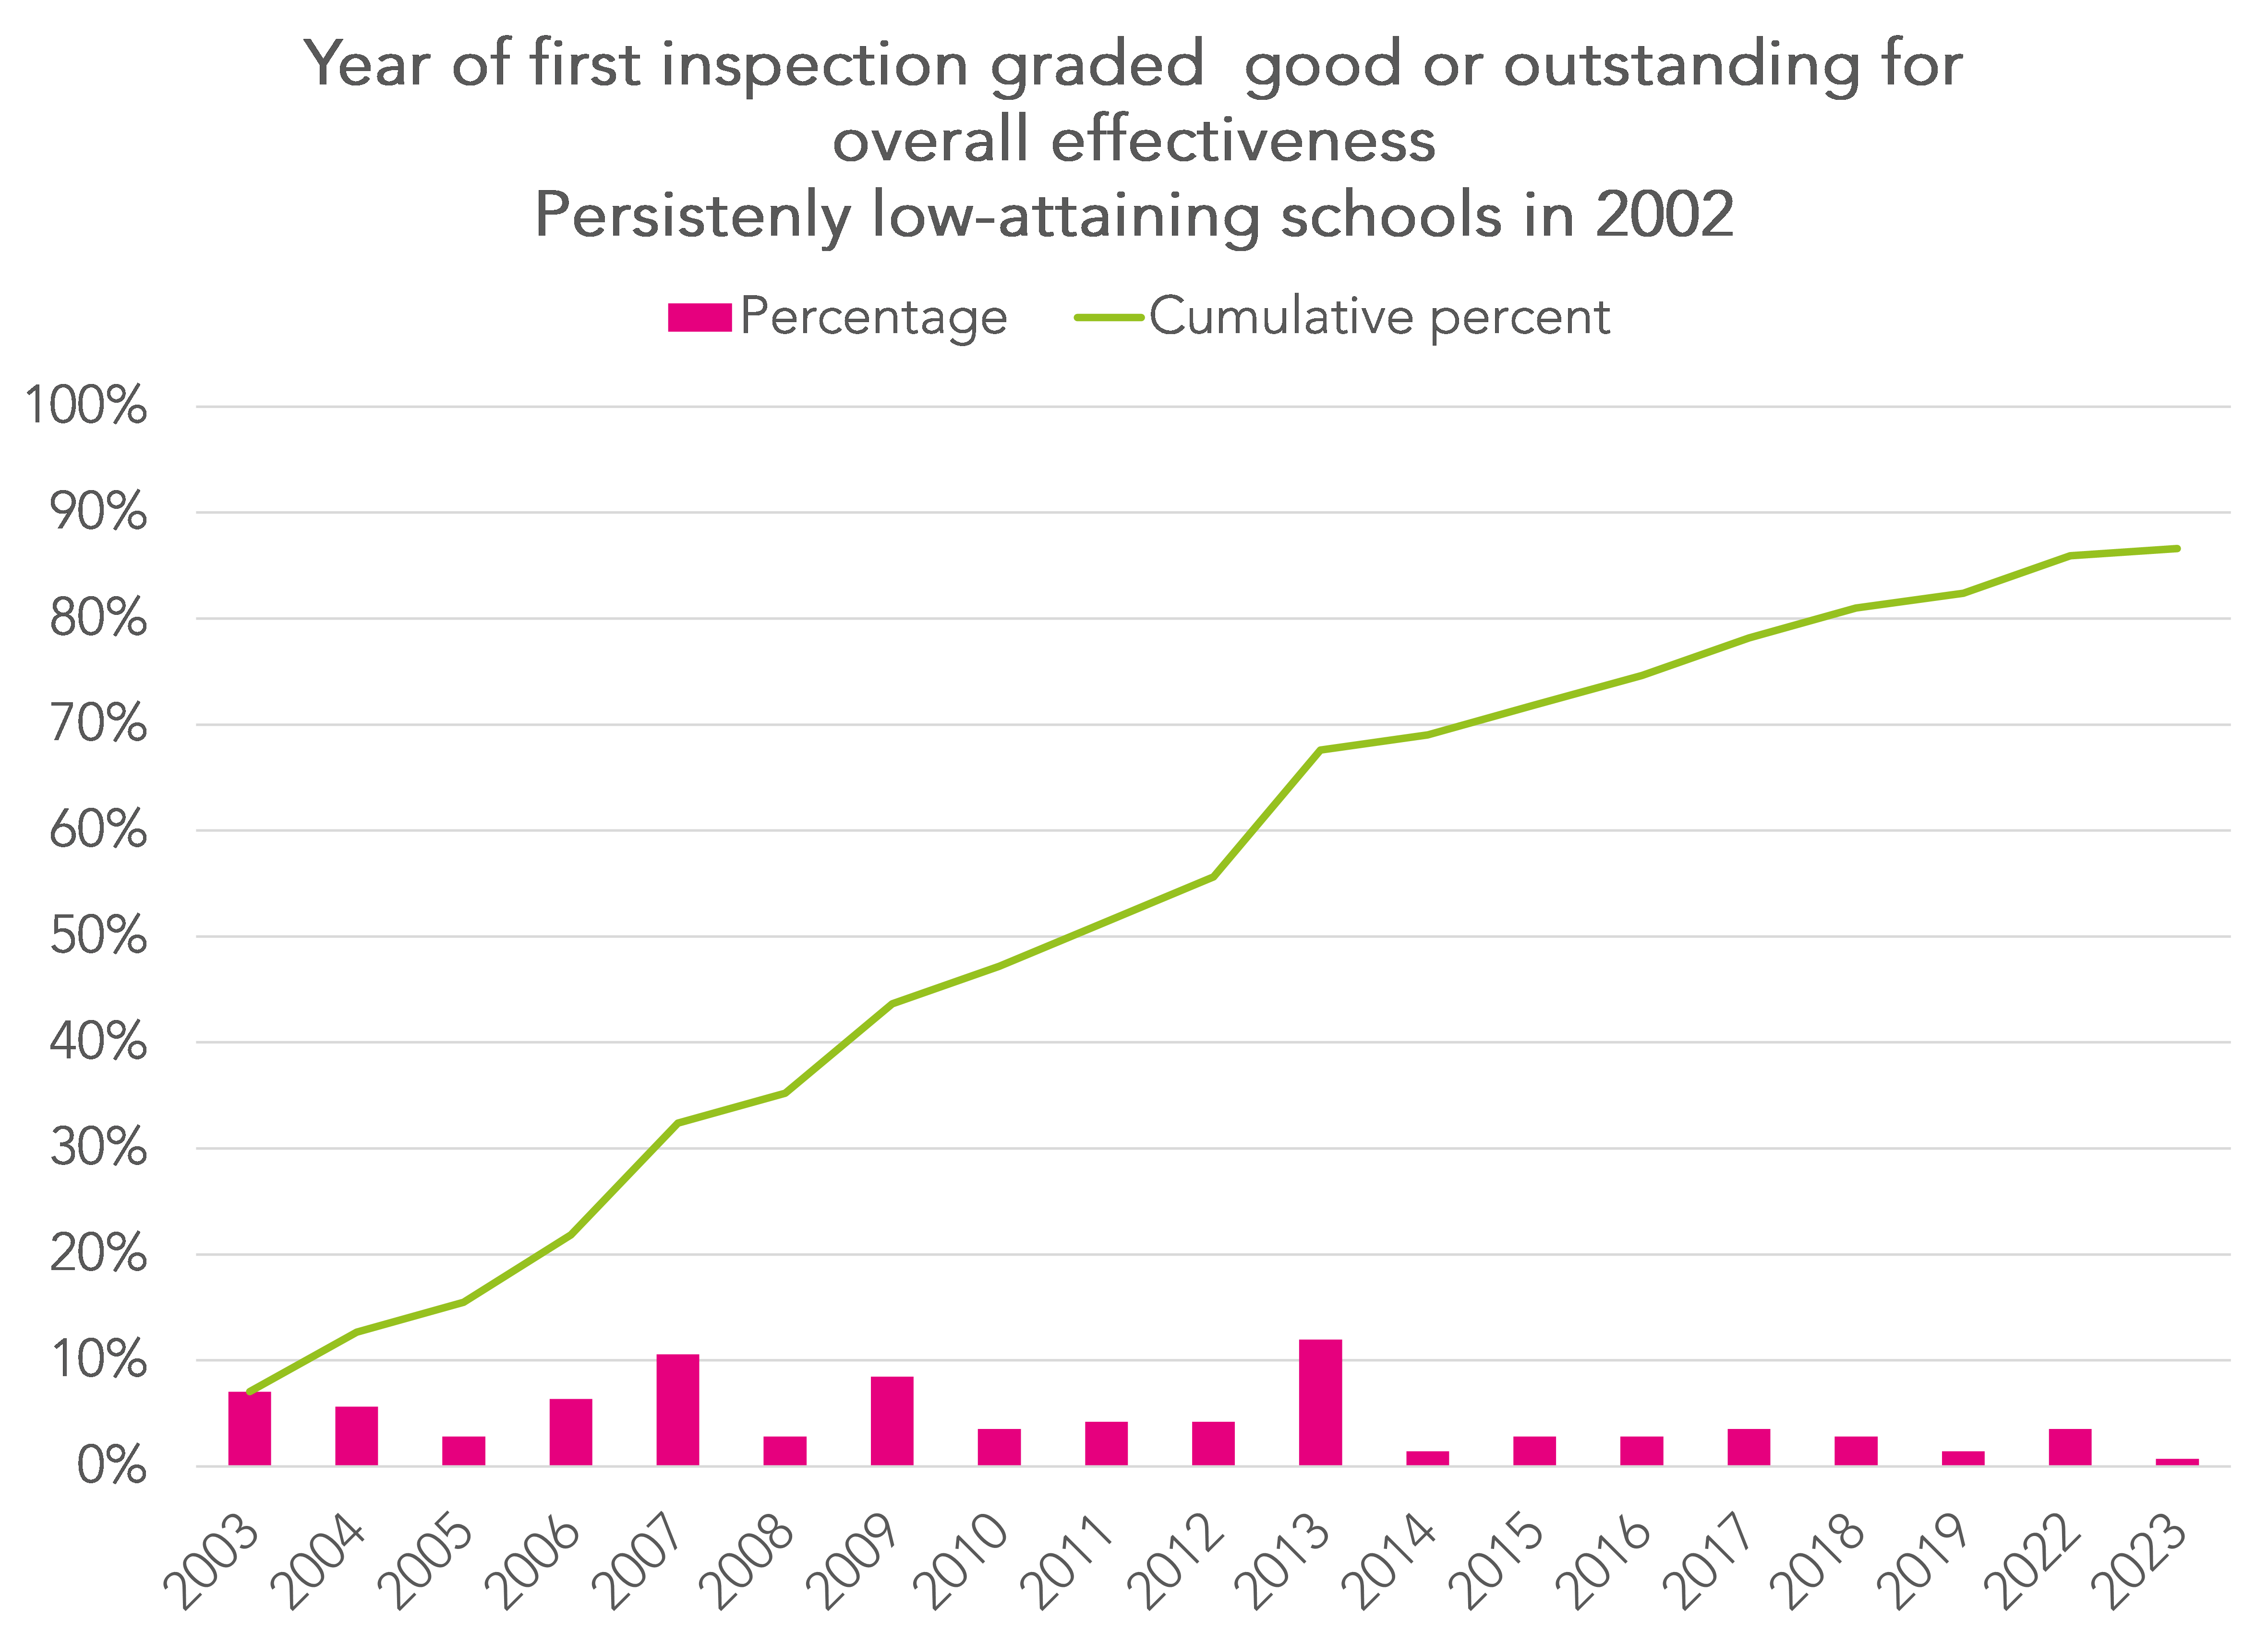
By the end of 2023, 123 (87%) had been graded good or outstanding at least once and another has since been graded good. When we looked at a slightly different period (September 2005 to March 2022) we found that 5% of secondary schools that were then open had never been graded good during that time.
Of the remaining 18, 11 closed outright without any successor. Seven remain open.
Summing up
We identified 142 schools which were persistently low-attaining at the turn of the century, at the start of the second term of office for the New Labour government.
Although 16 schools have closed outright, the remainder exist in some form, often in the shape of a successor academy. All but seven schools were graded good or outstanding at least once by Ofsted since the start of the 2002/02 school year.
Nine schools were judged outstanding at the end of 2022/23 and eight (seven taking account of mergers) achieved a Progress 8 score of +0.5 or higher.
However, most of these schools still tend to have below average levels of attainment and above average levels of disadvantage.
So although many schools have improved beyond their position (at least as far as accountability measures) at the turn of century, a small number have proved to be more intractable.
[1] City was soon dropped
[2] It was also common practice in those days for schools that closed at the end of an academic year in Performance Tables. For example, the very first academy (The Business Academy, Bexley) replaced Thamesmead Community School in 2002/03 but its predecessor was not included in Performance Tables
[3] Strictly speaking, this is seven current schools as two of our original 142 merged
Want to stay up-to-date with the latest research from FFT Education Datalab? Sign up to Datalab’s mailing list to get notifications about new blogposts, or to receive the team’s half-termly newsletter.
Leave A Comment