Weird science

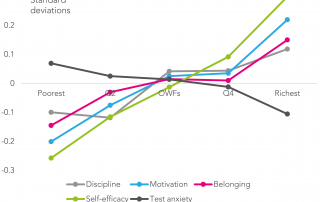
So, you are in Year 9 and it’s time to pick your options. (We'll leave aside whether funding constraints leave you with many options). Which science route are you going to take? Triple science or combined science? Will your GCSE grades be roughly the same whichever route you opt for? In this blogpost we look [...]

By |2018-09-27T17:46:17+01:0020th March 2017|Exams and assessment|

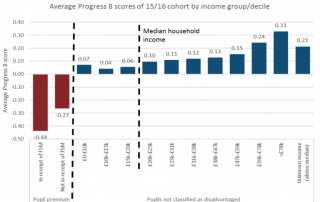
Putting Progress 8 in context

We thought we’d run out of things to say about Progress 8 but a couple of blogposts from Tom Sherrington and Jim Gordon last week made us realise that we hadn’t. Both examine, among other things, how Progress 8 scores vary by pupil and school characteristics. (Progress 8 is the headline value added measure by which [...]

By |2018-09-27T17:46:44+01:002nd March 2017|Exams and assessment, School accountability|

The equivalence of A-Levels and BTECs

New analysis This post was published in 2017. We've subsequently looked at the equivalence of A-Levels and reformed BTECs. Read our updated analysis here. * Updated 3rd April 2017 following helpful feedback from UCAS* Last week, the Higher Education Policy Institute published a report on BTECs and university admissions [PDF]. It recognised that [...]

By |2020-01-13T15:38:25+00:0028th February 2017|Exams and assessment, Post-16 provision|

Multi-academy trust league tables: What can we learn from the data?

This morning the government published multi-academy trust (MAT) league tables, building on an approach it trialled last year. At a headline level, two thirds of MATs had Progress 8 scores that were below average across the secondary schools which they run [PDF]. But what does the underlying data tell us? In this analysis we’re looking at [...]

By |2017-10-23T13:10:35+01:0019th January 2017|Exams and assessment, School accountability, Structures|

KS4 performance tables 2016: When coasting feels like paddling hard to keep your head above water

This week, 319 secondary schools have been told that they are coasting and so will become eligible for intervention. This includes a staggeringly high 22.6% of schools in the east Midlands. For those deemed to have insufficient capacity to bring about improvement this could be the start of a long road to forced academisation. And [...]

KS2 performance tables 2016: Primary schools in the North East are pulling away from the pack

A decade ago, the proportion of 11-year-olds reaching expected standards did not vary much across the regions - except for a little place with an unfixable education system called Inner London. The lines in blue on the chart below show that most regions had just over 70% of pupils meeting the expected standard at that [...]

By |2016-12-15T13:08:34+00:0015th December 2016|Exams and assessment, School accountability|

KS2 performance tables 2016: Do we need value added at Key Stage 2?

Value added data, calculated by a number of different methods over the years, has been a feature of school performance tables since 2003. In principle, the idea is sound. Comparisons of schools’ raw attainment measures often say more about schools’ intakes than they do about the quality of teaching and learning. So if the state [...]

KS2 performance tables 2016: What can we tell about the new floor standards?

Final Key Stage 2 data has been published this morning, with 665 primary schools identified as being below the floor standards, compared to 676 last year. In line with the move to scaled scores, the way floor standards are calculated changed this year. Schools were judged as being below the floor standard if they failed [...]

By |2018-09-27T17:51:43+01:0015th December 2016|Exams and assessment, School accountability|
Go to Top