The impact of early rollout of Universal Credit on free school meals eligibility
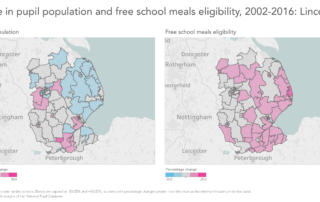
An example of how eligibility for free school meals changes in response to changes in benefits policy.

An example of how eligibility for free school meals changes in response to changes in benefits policy.

Looking at inspections since the introduction of Progress 8.
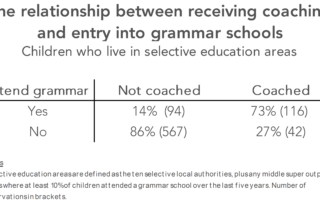
Before the 2017 general election, it seemed like grammar schools were about to make a widespread return to England. Although this didn’t happen after the Tories lost their parliamentary majority, the new Secretary of State for Education has backed plans to allow existing grammar schools to expand. This renewed interest in expanding selective education has [...]
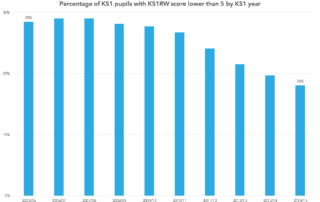
This is the first of two posts in a series of blogposts looking at the relationship between Key Stage 1 attainment and Key Stage 4 outcomes. The second post can be found here. There are many ways of defining success at Key Stage 4. One aspect is whether pupils have attained appropriate literacy and numeracy [...]
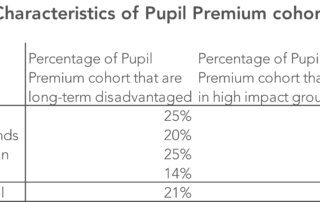
This is part six in a series of blogposts exploring long-term disadvantage. Other posts in the series can be found here. In previous blogposts in this series we have shown that the impact of disadvantage on attainment and progress varies according to the percentage of their time in school that a pupil has been eligible for [...]
This is part five in a series of blogposts exploring long-term disadvantage. Other posts in the series can be found here. We looked recently at the Progress 8 scores of long-term disadvantaged pupils – those who are eligible for free school meals (FSM) for 90% or more of their time in schools – and concluded that: [...]
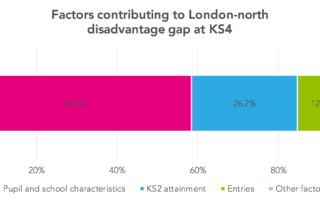
This is part three in a series of blogposts exploring long-term disadvantage. Other posts in the series can be found here. Some of you might remember the 1996 TV series in which Christopher Ecclestone plays Nicky Hutchinson. As an impatient politician he argues that “Tomorrow is too late”. The Northern Powerhouse Partnership (NPP) has today issued [...]
Most of the time our work involves using the National Pupil Database to examine particular aspects of the education system. However, it can also throw up interesting insights into the state of the nation more generally. Last year, we wrote about how the percentage of pupils eligible for and claiming free school meals (FSM) had [...]
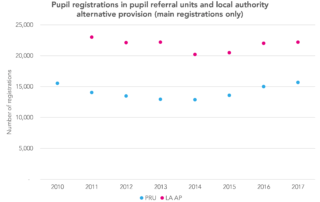
Latest DfE statistics show that there were almost 16,000 pupils on-roll at pupil referral units, and another 22,000 in other local authority alternative provision in January 2017 [XLS, table 1b]. These are pupils whose education is paid for by the state but who do not have places at state-funded mainstream or special schools. The different [...]