Long-term disadvantage, part four: If Carlsberg made schools…and also designed funding formulae?
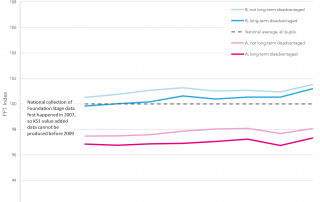
This is part four in a series of blogposts exploring long-term disadvantage. Other posts in the series can be found here. At the start of the summer we showed that there are substantial differences in the attainment and progress of pupils who have been disadvantaged at some stage. The main findings of these earlier posts were [...]