The return of national assessments in Key Stage 1, including Year 1 phonics, has again shone a light on the attainment of summer-born pupils relative to their autumn-born peers (LINK).
For example, 57% of August born pupils achieved the expected standard in reading at the end of Key Stage 1 in 2022 compared to 76% of September born pupils.
These differences look especially stark when looking at threshold measures, such as meeting the Year 1 phonics standard or a good level of development in the Early Years Foundation Stage [1].
However, if you look at the full range of outcomes achieved, you see that although age is correlated with attainment, it is not always that strongly correlated. We looked at this in an analysis of 2019 Key Stage 1 test results.
There are other age effects in schooling. In this blogpost, we will look at two others: the incidence of special educational needs and disabilities (SEND) and the incidence of permanent exclusions and suspensions.
Special Educational Needs and Disabilities
In a previous blogpost, we tracked a single cohort of pupils in state-funded schools from Reception in 2014/15 to Year 7 in 2021/22 and showed how the percentage identified as having SEND changed over time.
We return to that cohort to examine how this percentage changes with respect to term of birth.
First of all, we show the percentage of pupils enrolled in state schools classified as having SEND each year. We include those whose needs are met by an EHC plan or by School Support.
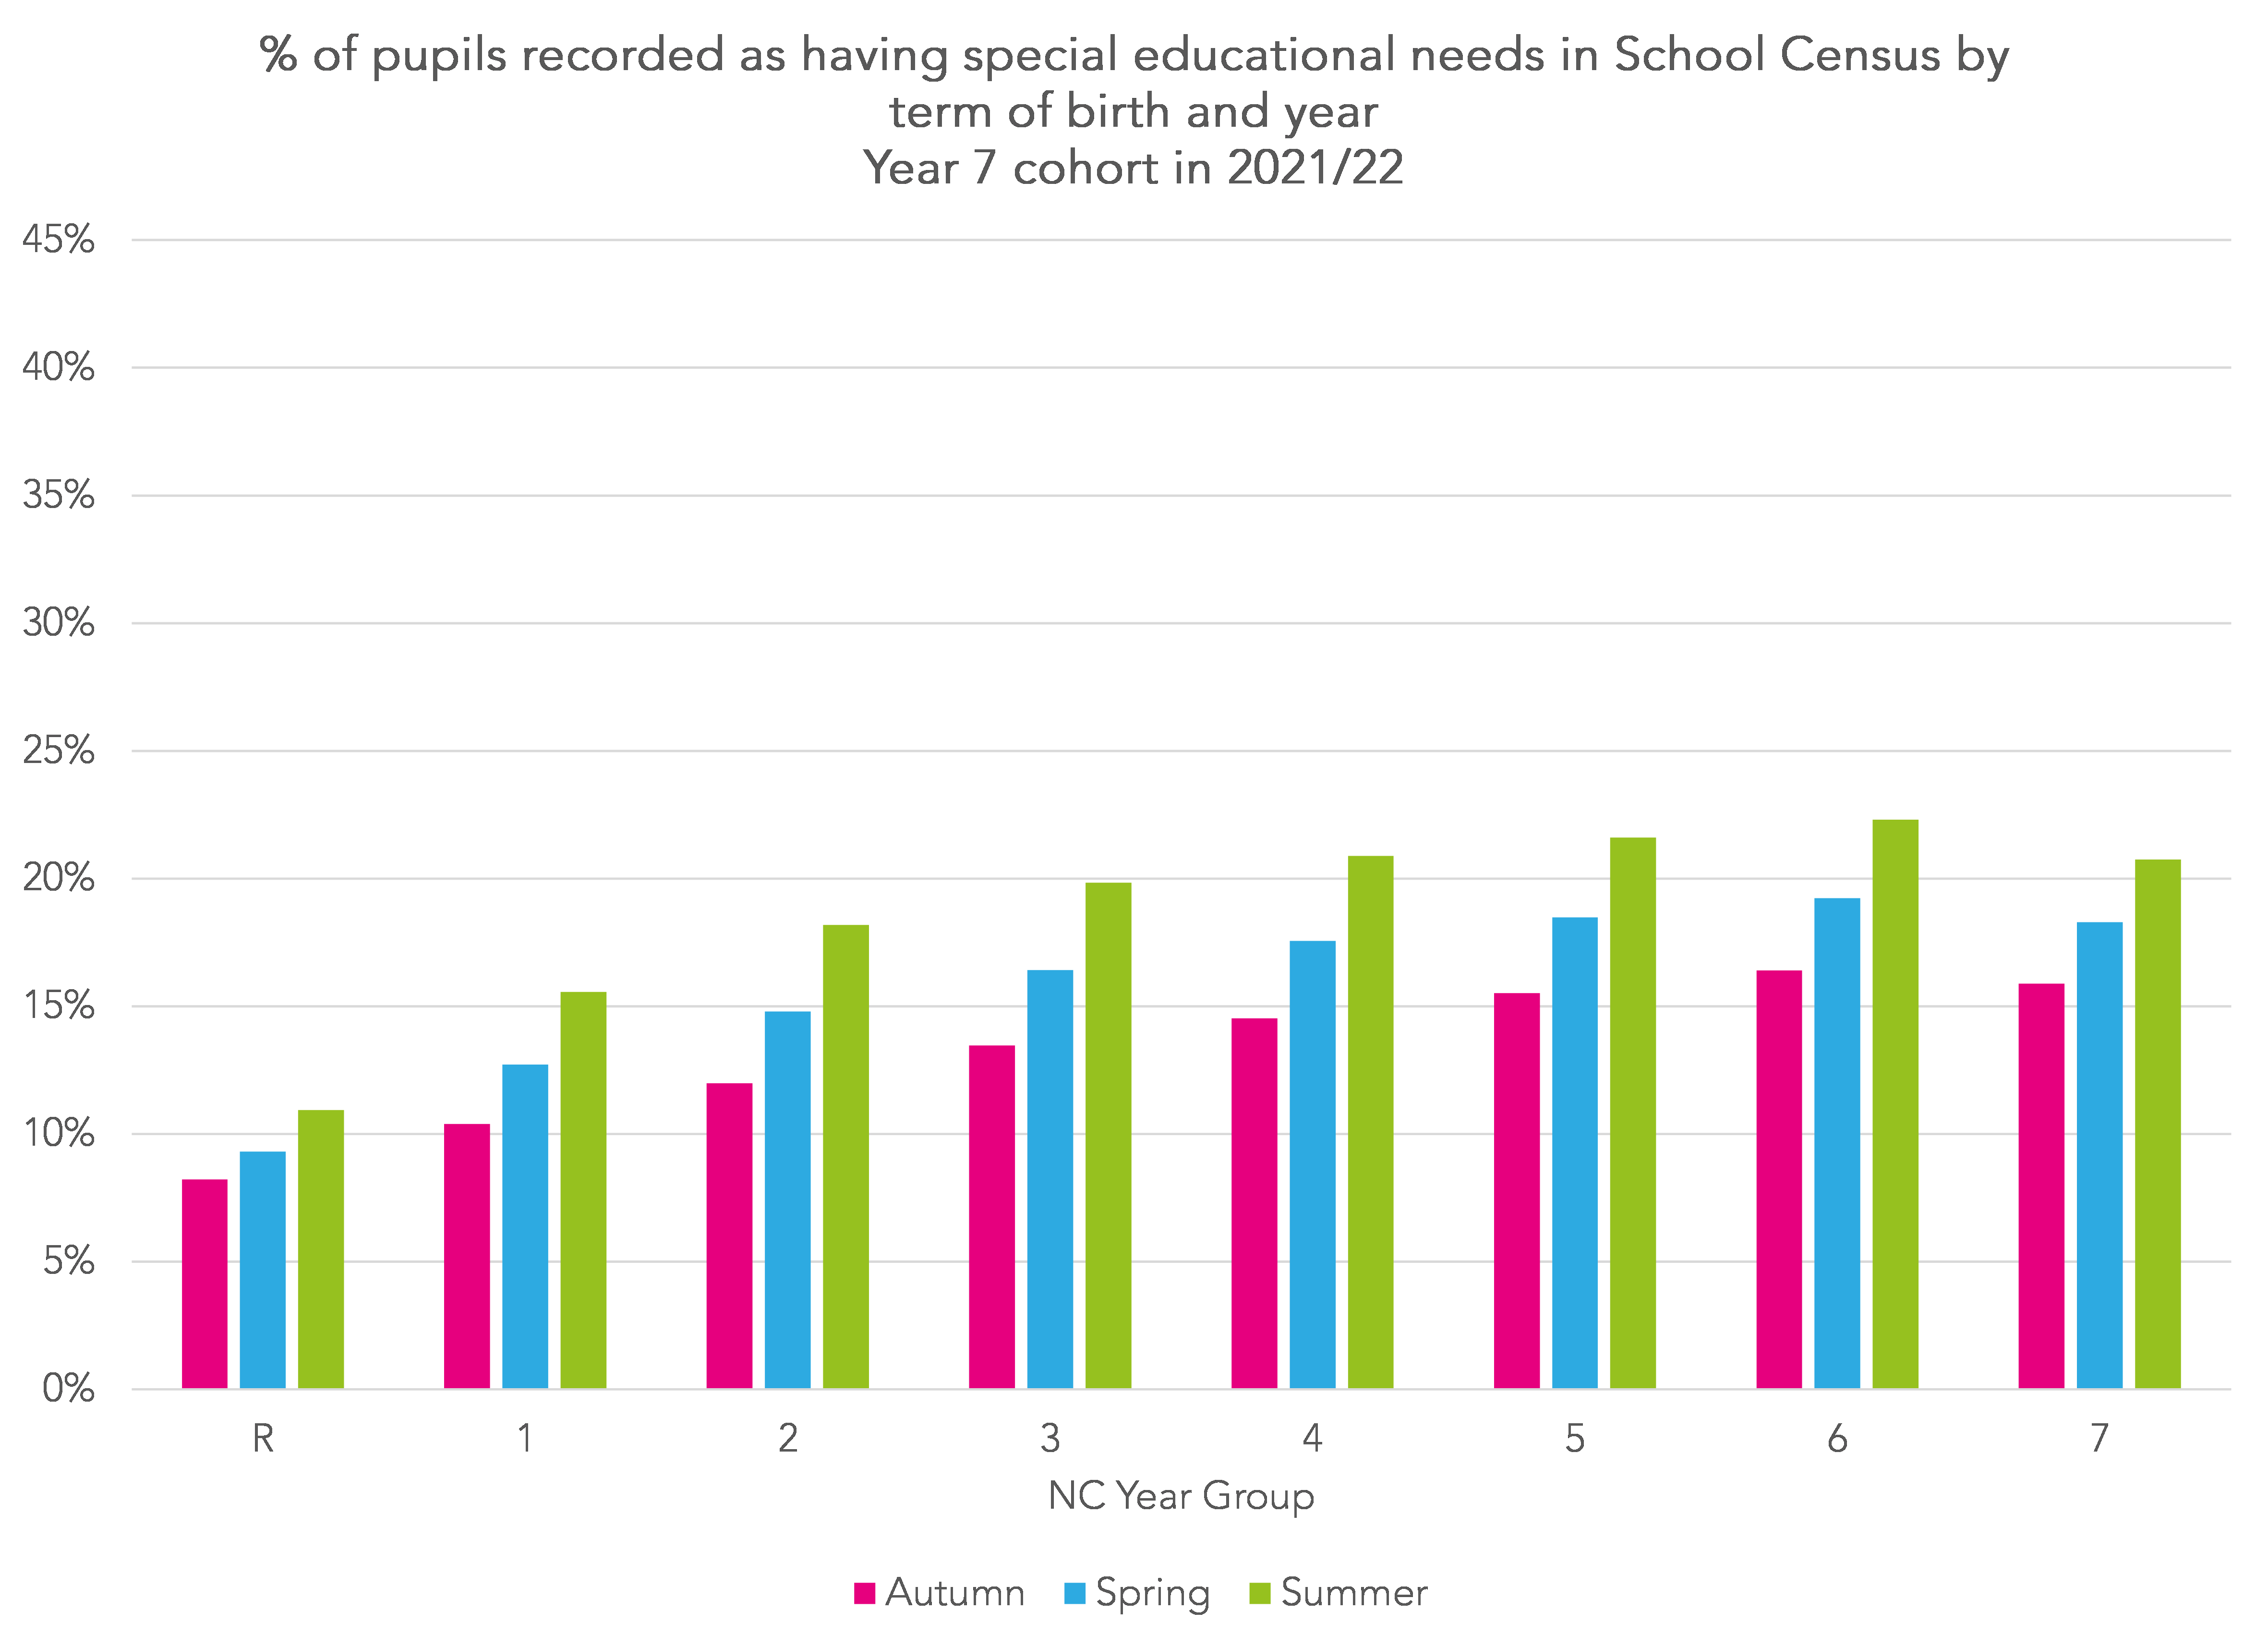
In Year 7, 21% of Summer born pupils are identified as having SEND. This compares to 16% of Autumn born pupils.
If instead we show the percentage of pupils who have ever been identified as having SEND by the end of each year then the bars grow longer.

By the end of Year 7, 34% of summer born pupils were identified at some point in School Census as having special educational needs. This compares to 25% of Autumn born pupils.
We also see large differences between boys and girls.

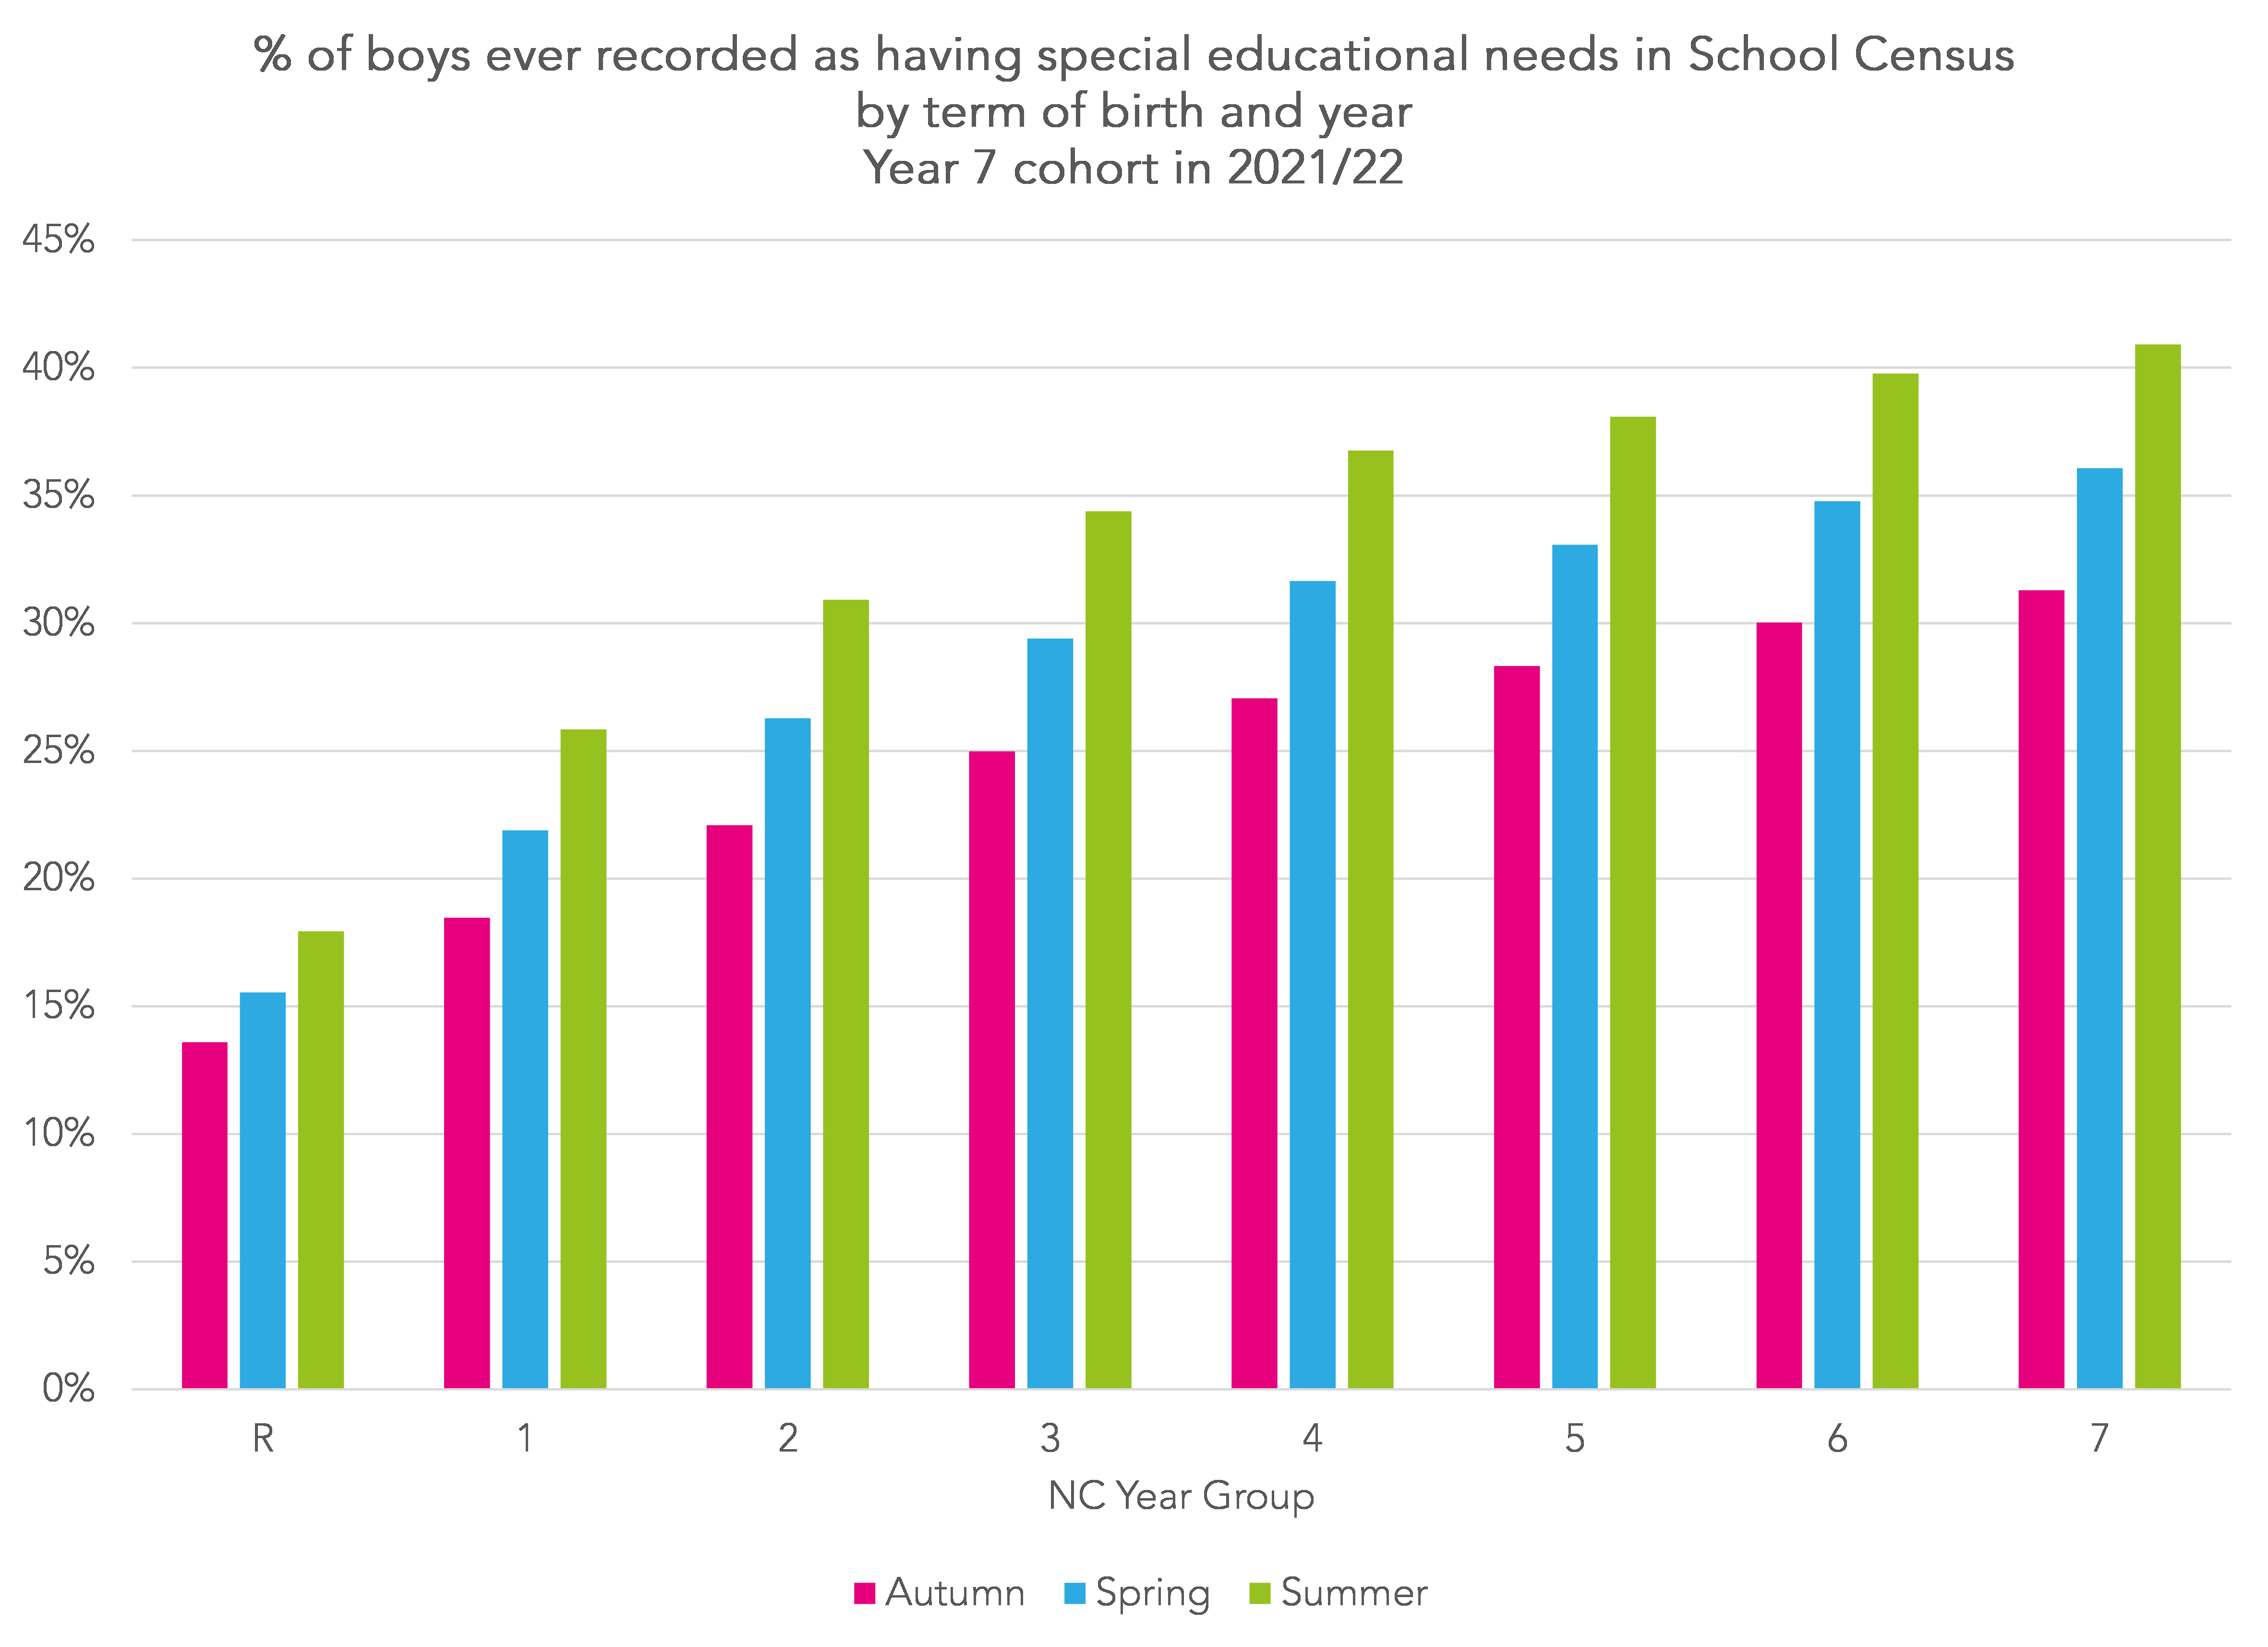
41% of summer born boys had been identified as having SEND at some point before the end of Year 7. This compares to 31% of Autumn born boys and 18% of Autumn born girls.
Perhaps these differences in incidence rates are unsurprising given the role of attainment data in identifying SEND.
A more detailed analysis of month of birth and SEND identification can be found in a working paper by Tammy Campbell.
Permanent exclusions and suspensions
To analyse the relationship between term of birth and exclusions (and suspensions) we pool exclusion and enrolment data for the three academic years 2019, 2020 and 2021.
The exclusion rate is the total number of exclusions divided by the total number of pupils on roll in state-funded schools. The enrolment data counts all pupils on roll in at least one termly School Census.
The suspension rate is the total number of pupils who experienced at least one suspension divided by the total number of pupils on roll.
We calculate rates for each year separately and then calculate a three-year average.
First, let’s look at the rate of permanent exclusions.
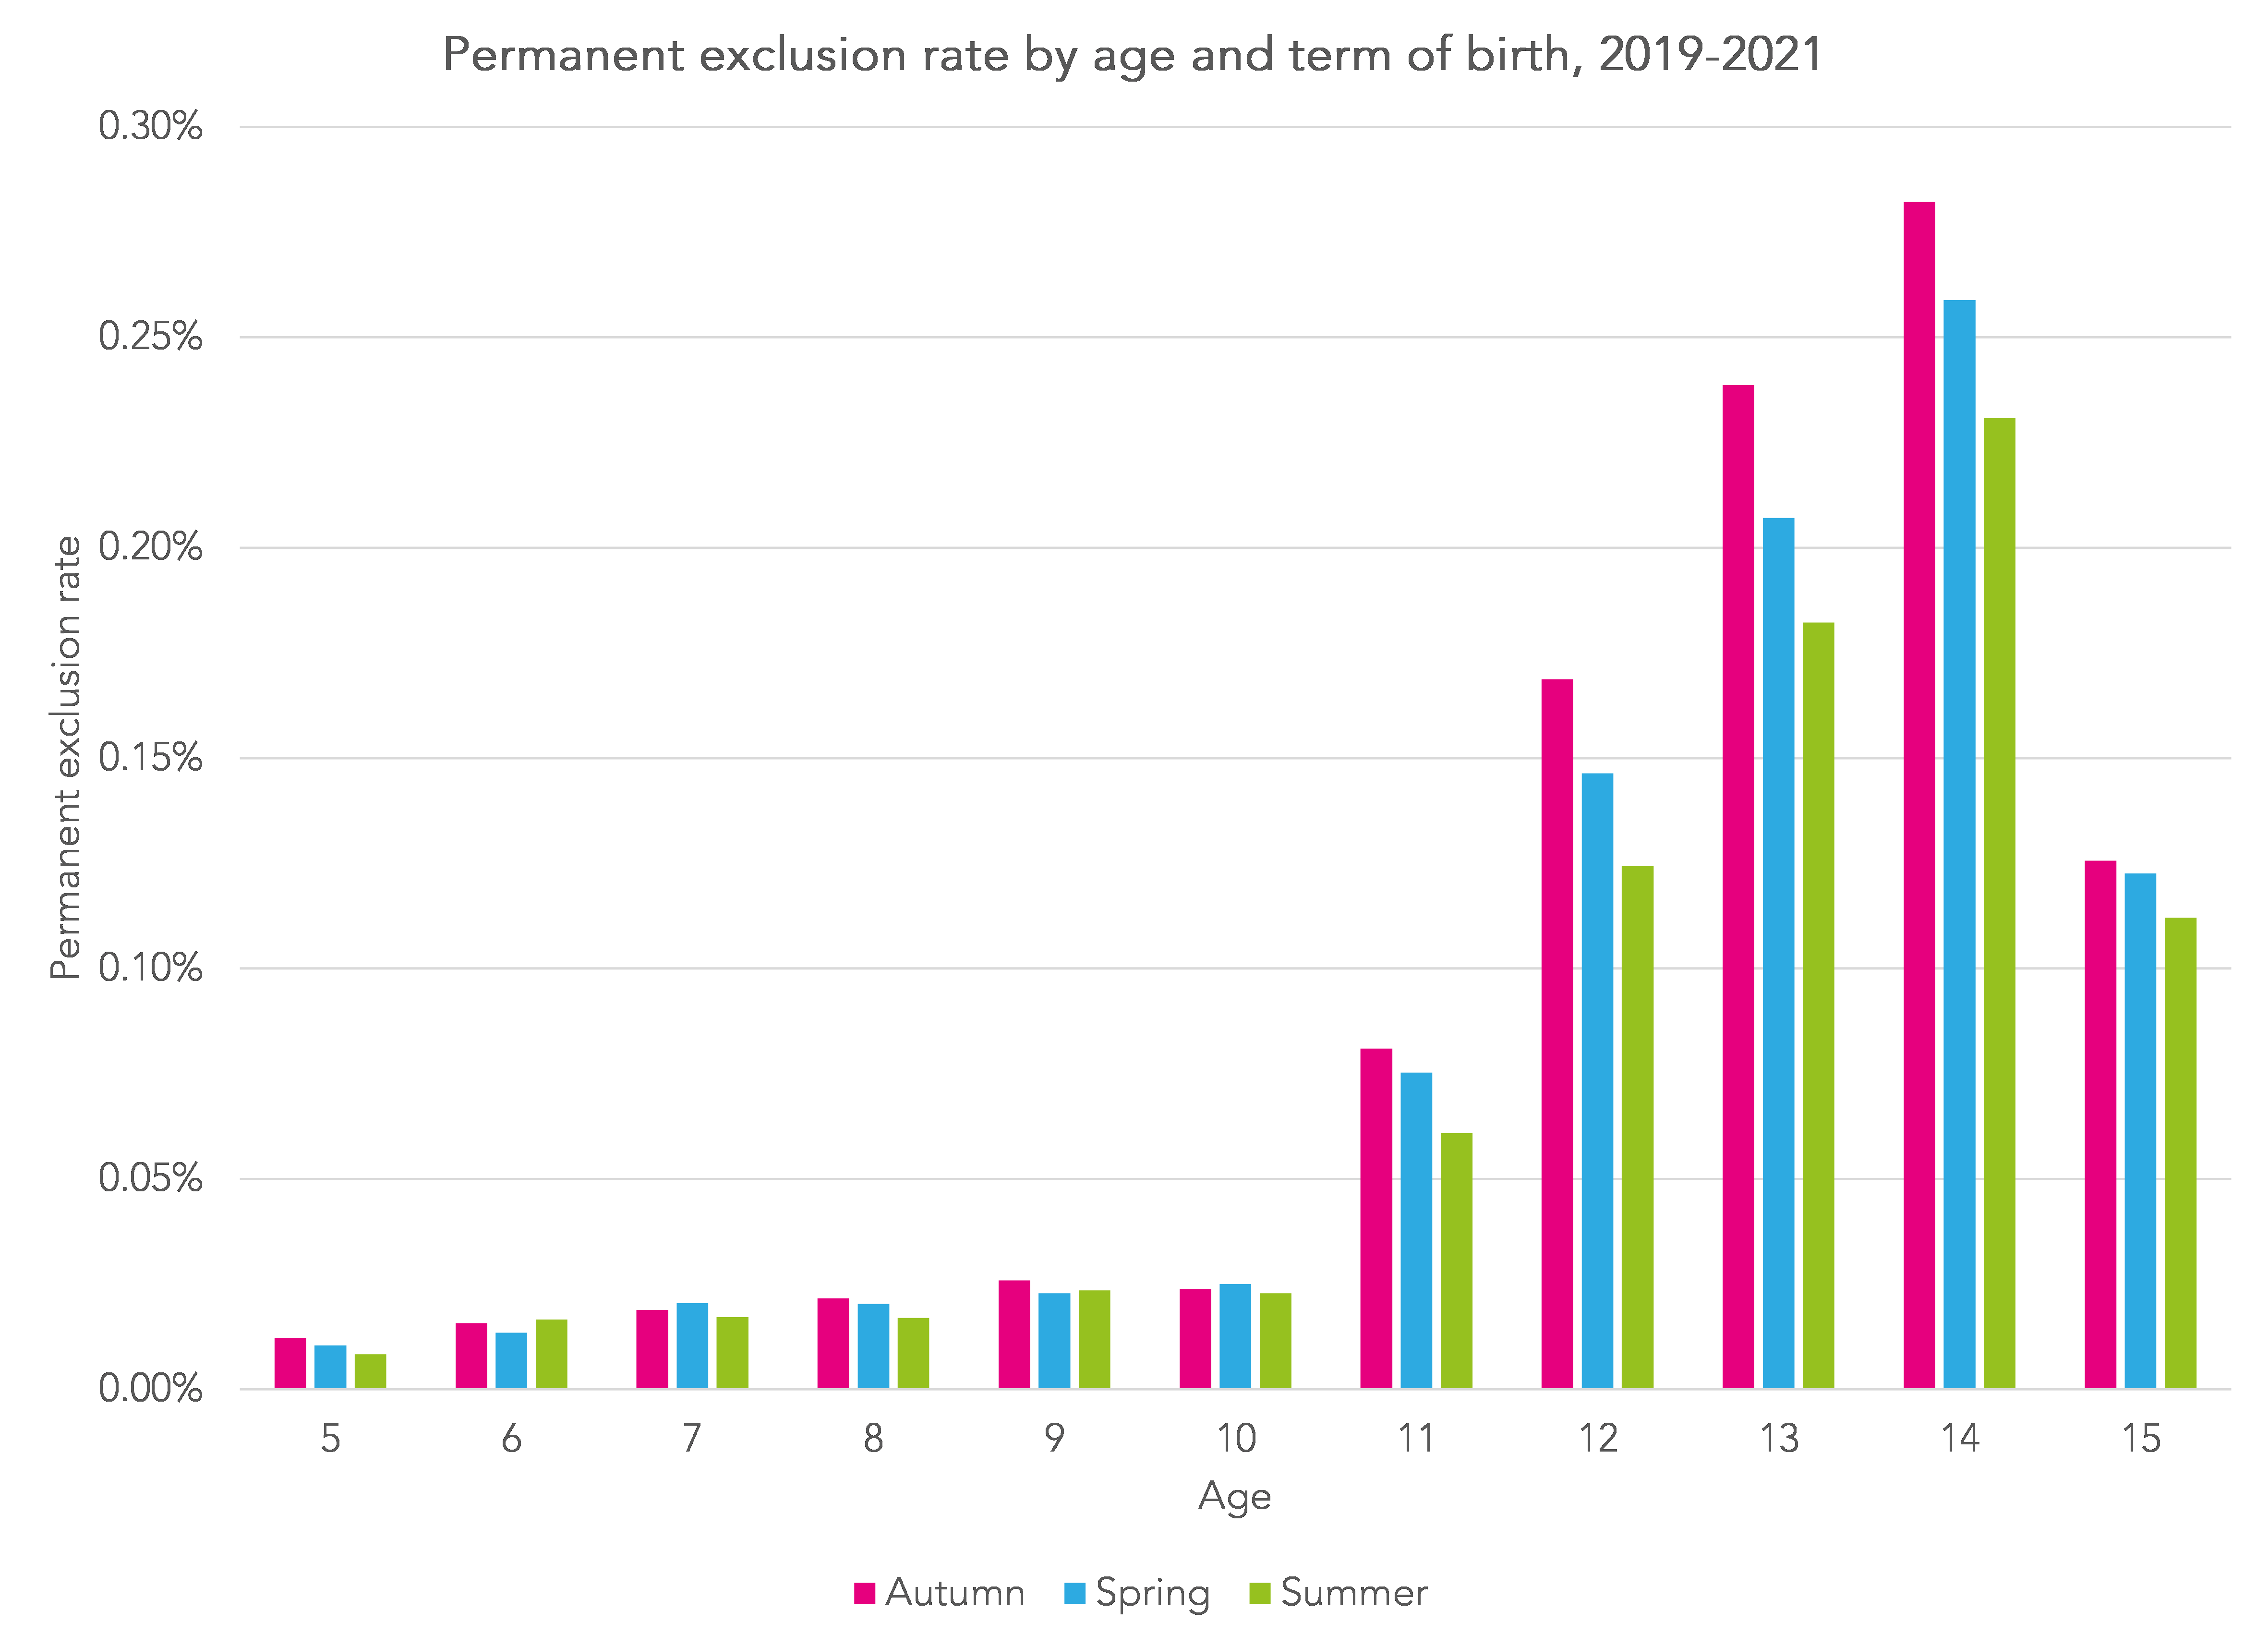
Here we see, particularly in the early secondary years (11-13), summer born pupils were slightly less likely to be permanently excluded than their autumn born peers.
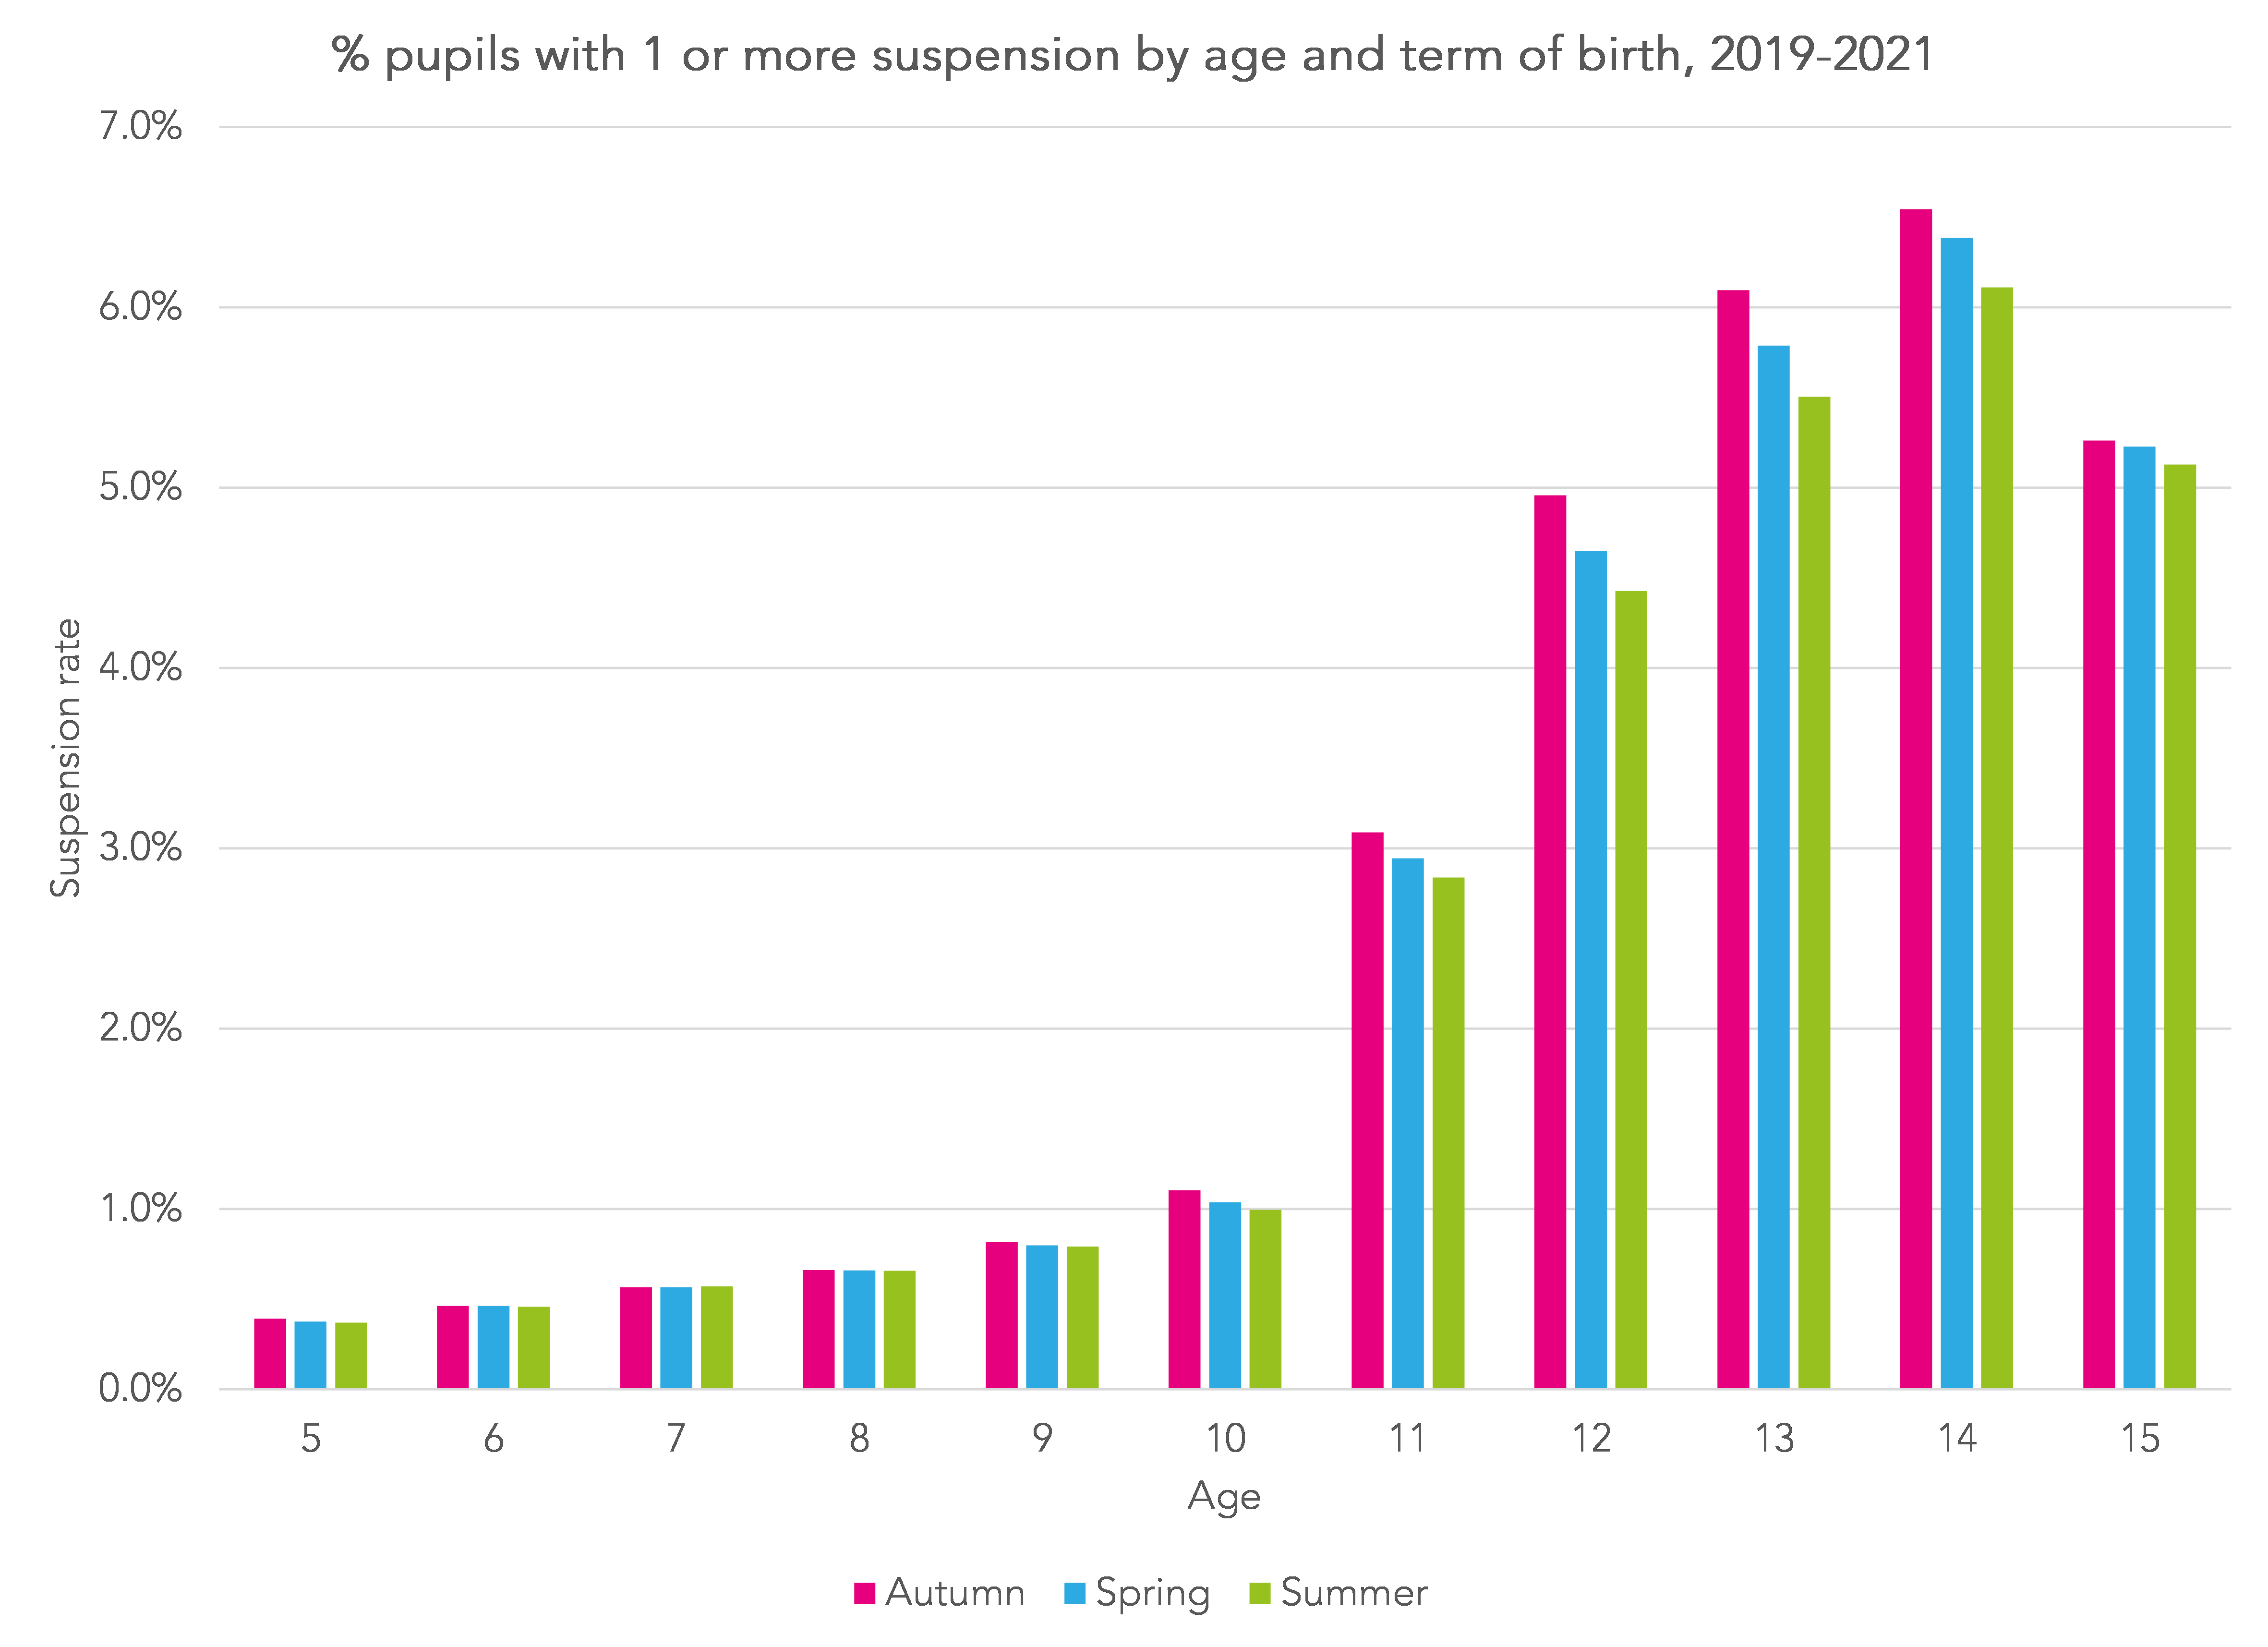
This pattern is also repeated, perhaps not so markedly, with suspensions.
Summing Up
Summer born pupils tend to be lower attaining early on in their school career. However, gaps narrow over time as they begin to catch up.
Possibly due (at least in part) to being less likely to achieve expected standards earlier in their school careers, summer born pupils are disproportionately more likely to be identified as having special educational needs and disabilities. This could perhaps be ameliorated by producing age-standardised scores alongside unadjusted scores where feasible.
But summer born pupils don’t always tend to end up worse off. Their rate of permanent exclusion and suspension is lower than that for other pupils.
- For more on the relative age effect and EYFSP attainment, see this paper by Tammy Campbell (£).
Want to stay up-to-date with the latest research from FFT Education Datalab? Sign up to Datalab’s mailing list to get notifications about new blogposts, or to receive the team’s half-termly newsletter.


Thanks for this Dave, fascinating – especially the surprise ending about exclusions. Once I manage to download Tammy’s paper (“unsafe” according to my browser) I’m sure I’ll have the answer to my pondering about reason-codes for SEN in summer born pupils. (SLCN, MLD I’m betting as the exclusion data doesn’t suggest BESD. although I’m prepared to be further surprised).
I’m also wondering if enrollments in special schools follow similar patterns or if this is more about SEN in mainstream, but perhaps the original working paper will oblige.
Delighted to have such a clear introduction to the topic!
Hi Chris. Far too kind- thank you! And thanks also for the suggestion- I think a follow-up post about SEN types by term of birth and special school enrolments would be worthwhile.