




Regular readers will know that we’ve been using attendance data to monitor the rate of exclusions and suspensions in schools in advance of official statistics from the Department of Education.
This is largely because of the time lag in the official statistics. Official data for the 2025/26 academic year will be published in July 2027. In other words, they lag a year behind.
Back in September, we looked at exclusions and suspensions in the Autumn Term of the 2025/26 academic year.
This showed that the suspension rate in secondary schools was continuing to fall. We noted in our analysis for the 2024/25 academic year the first signs of a decline in this rate following several years of increases following the pandemic. This was subsequently confirmed in official statistics.
Now with data for the full academic year 2025/26 available, we look at whether this is still the case.
Data
Pupils who are permanently excluded or suspended but who remain on the school roll are marked as code E in registers for up to five days. From the sixth (consecutive) day, alternative provision is supposed to be arranged.
Using attendance data for 2024/25 and 2025/26 supplied by 9,000 schools subscribing to FFT attendance tracker, we can summarise rates of absence due to exclusion and suspension for both years.
What we cannot do is distinguish between spells that are due to suspension and spells that are due to exclusion (or more accurately, spells that will result in due course in permanent exclusion).
Comparing our method to published statistics
As usual, we begin by comparing our figures with published official statistics.
The figures we produce are equivalent to the sum of the permanent exclusion rate and the suspension rate, in other words the total number of exclusions and suspensions divided by the total number of pupils. Given that suspensions tend to outnumber permanent exclusions by a rate of approximately 20 to 1 then our figures are mainly of suspensions.
We show our calculated figures for the full academic year 2024/25 alongside the published DfE figures in the chart below. This is the most recent term for which official statistics are available.
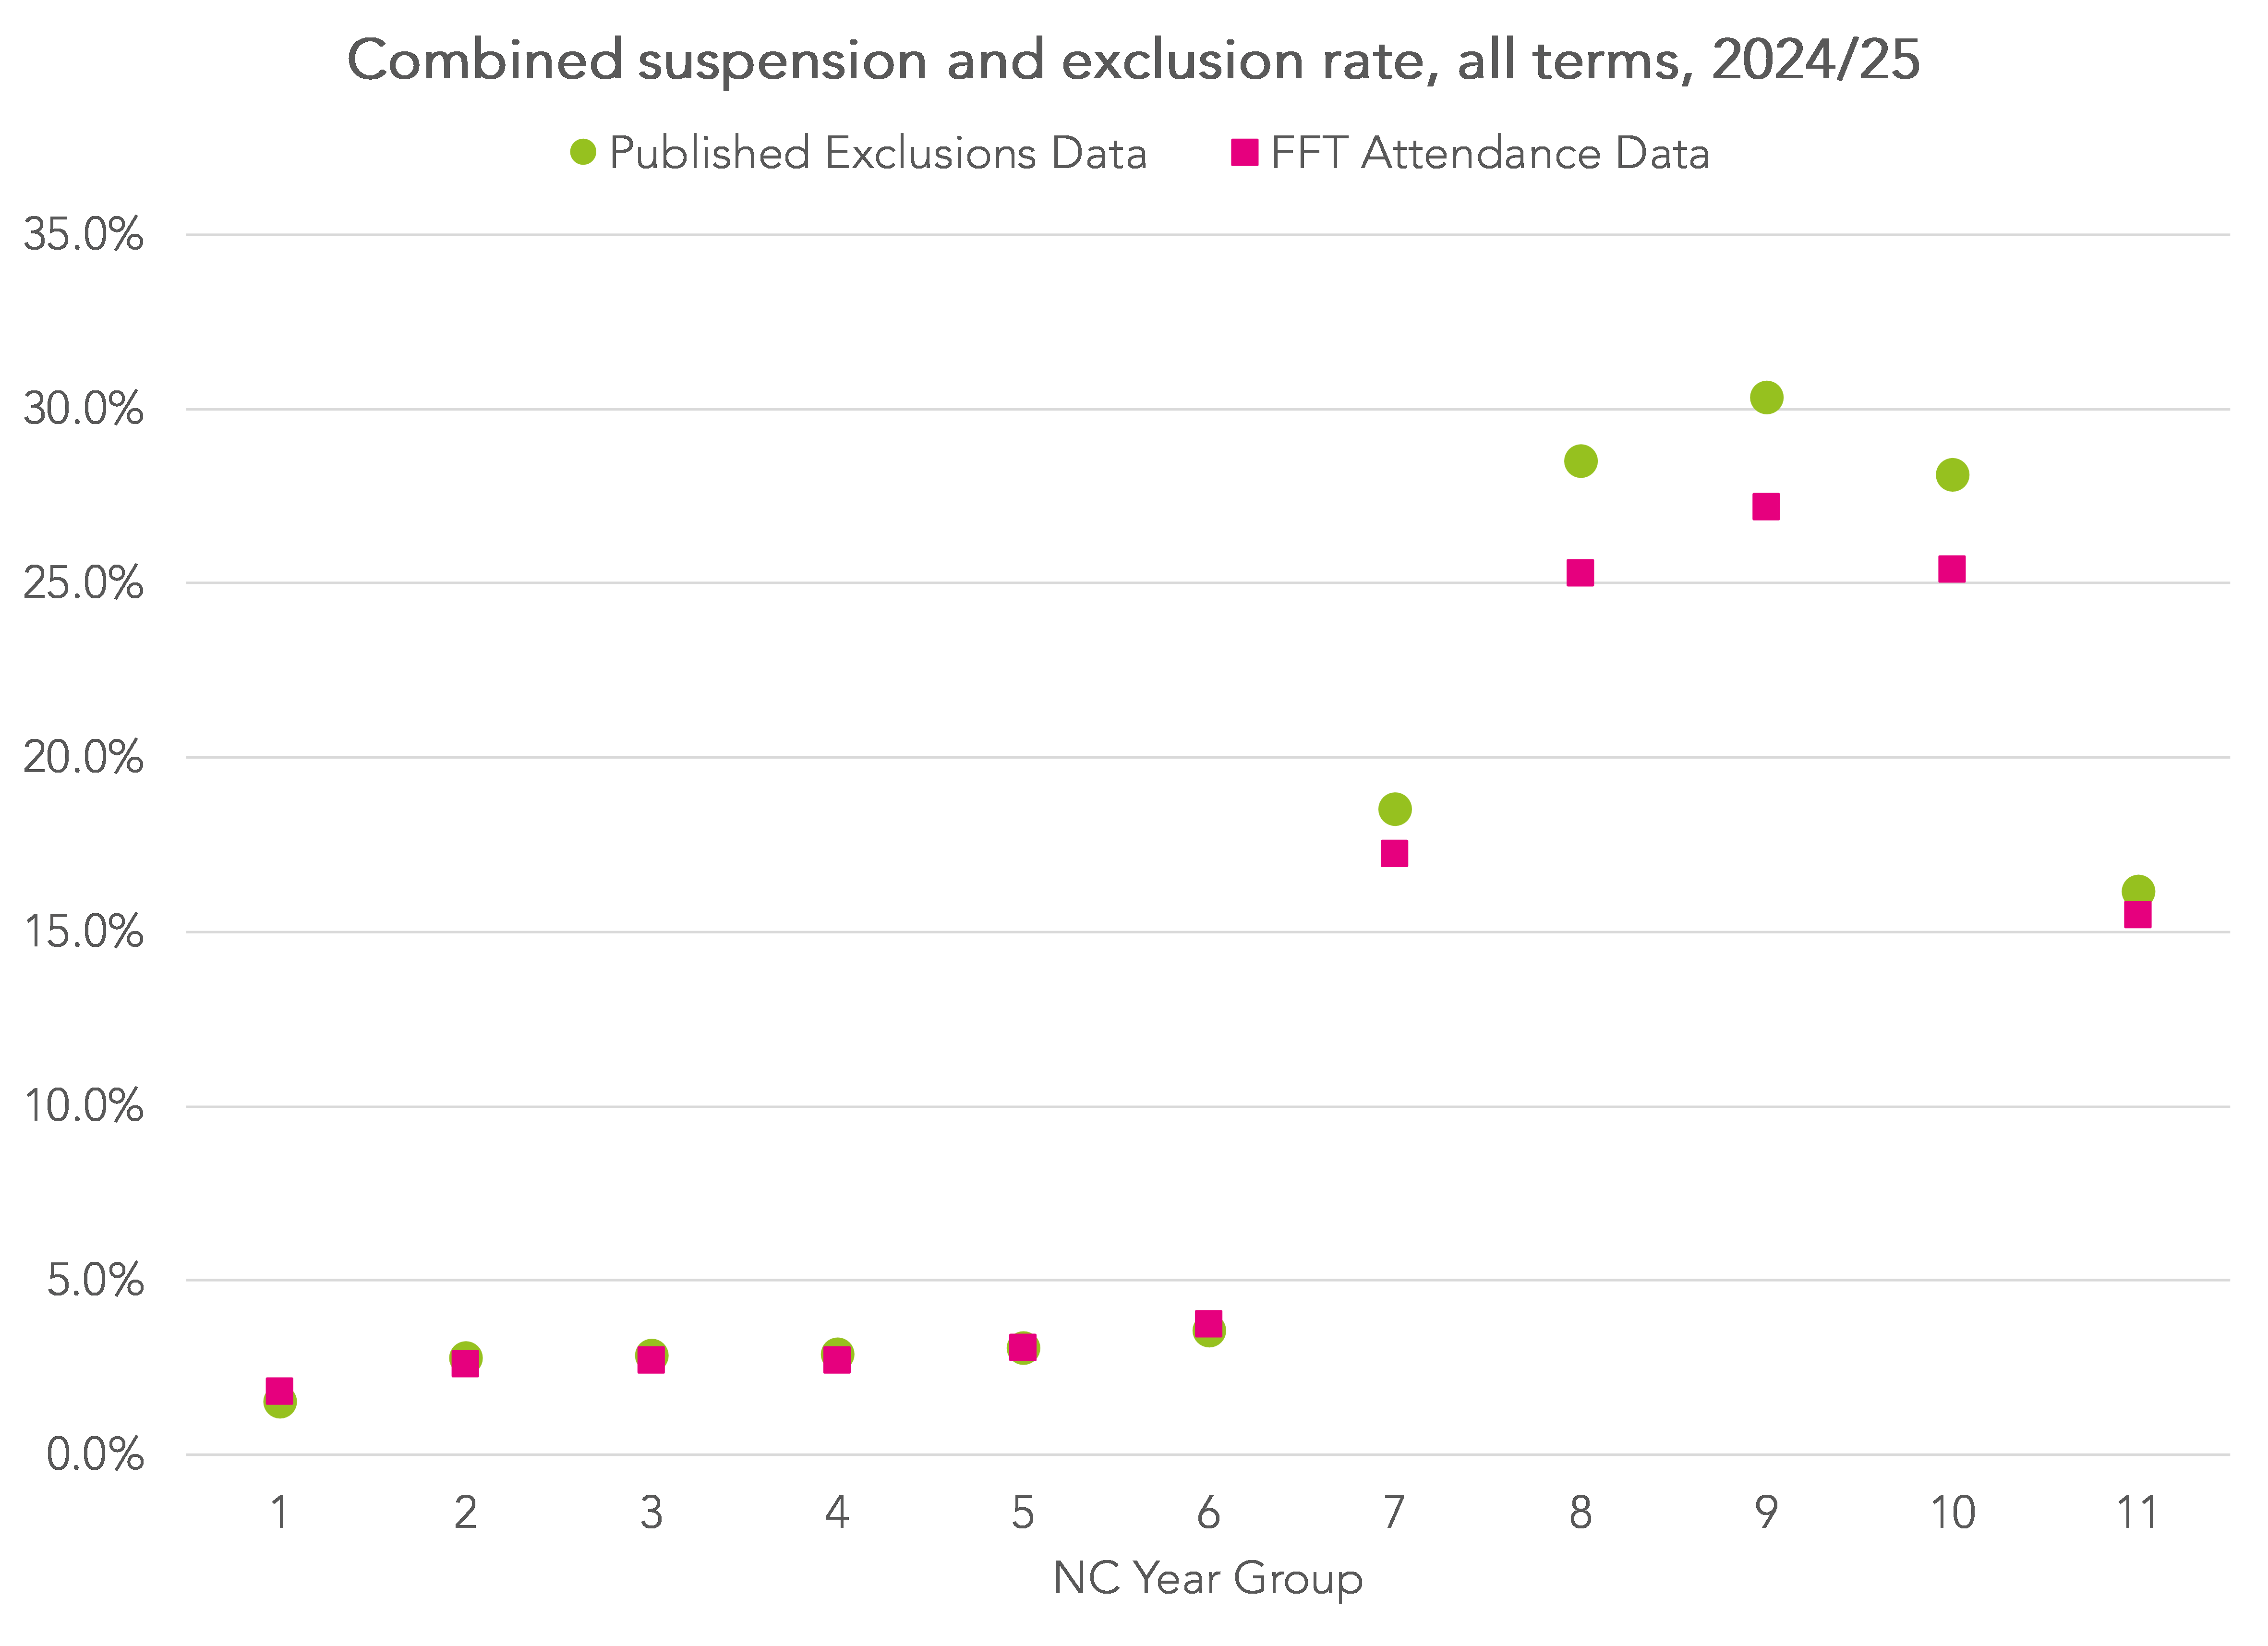
This pattern is typical when we do this sort of analysis. Our figures are fairly close to DfE figures but, if anything, are a bit lower, particularly for Years 8 to 10, the year groups with the highest rates. There may be various reasons for this. For example, If a pupil returns from suspension and is suspended again the same day we would count that as one suspension rather than two.
Consequently, our figures for 2025/26 might be slightly under-estimated.
Suspensions in 2025/26
Repeating our methodology for all terms in academic years 2024/25 and 2025/26, we see a further fall in the rate of suspensions and exclusions across secondary year groups (7 to 11).
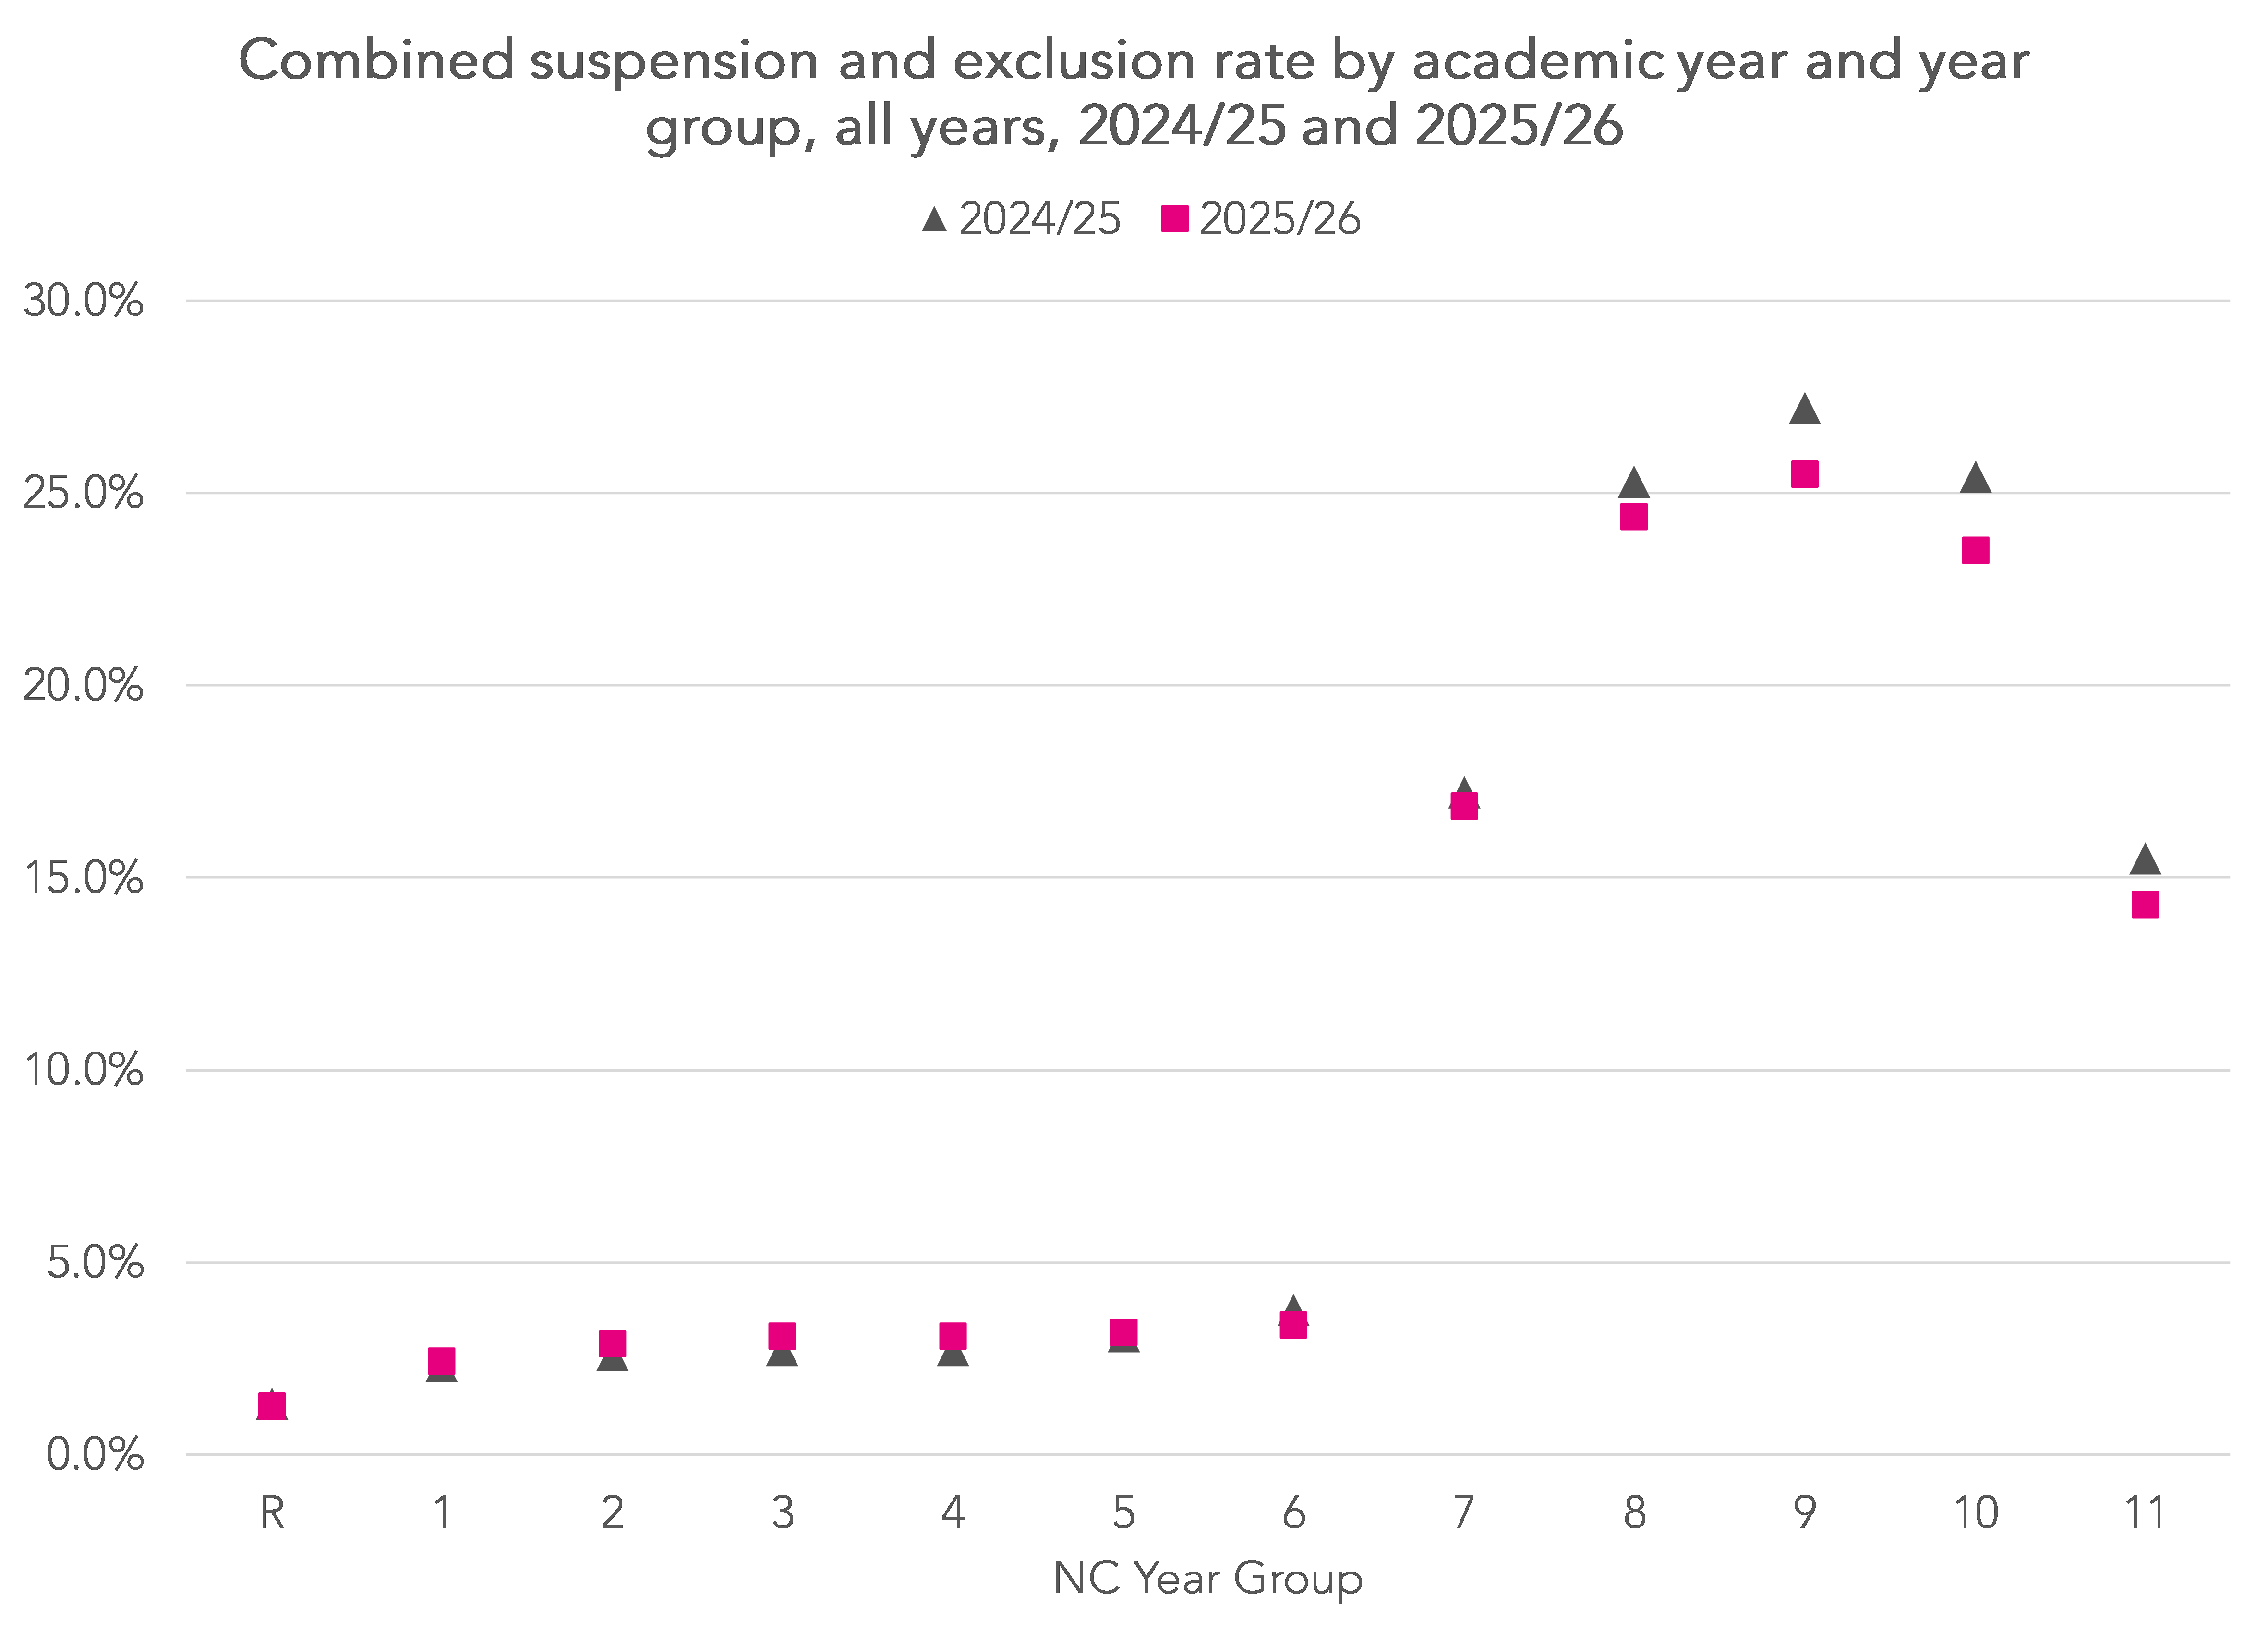
Among the primary year groups, we see a small increase in the combined exclusion and suspension rate of around 0.3 percentage points (pps) for Years 1 to 4.
Among secondary year groups, we see decreases for all year groups, particularly those with the highest rates, Years 9 and 10. Rates fell by 1.7 pps for Year 9 and 1.9 pps for Year 10.
The combined rate is the number of suspensions and exclusions divided by the number of pupils so a rate of 20% does not mean that 20% of pupils have been suspended or excluded. Some pupils will be suspended or excluded more than once.
But we can also summarise the percentage of pupils who are suspended or excluded at least once.
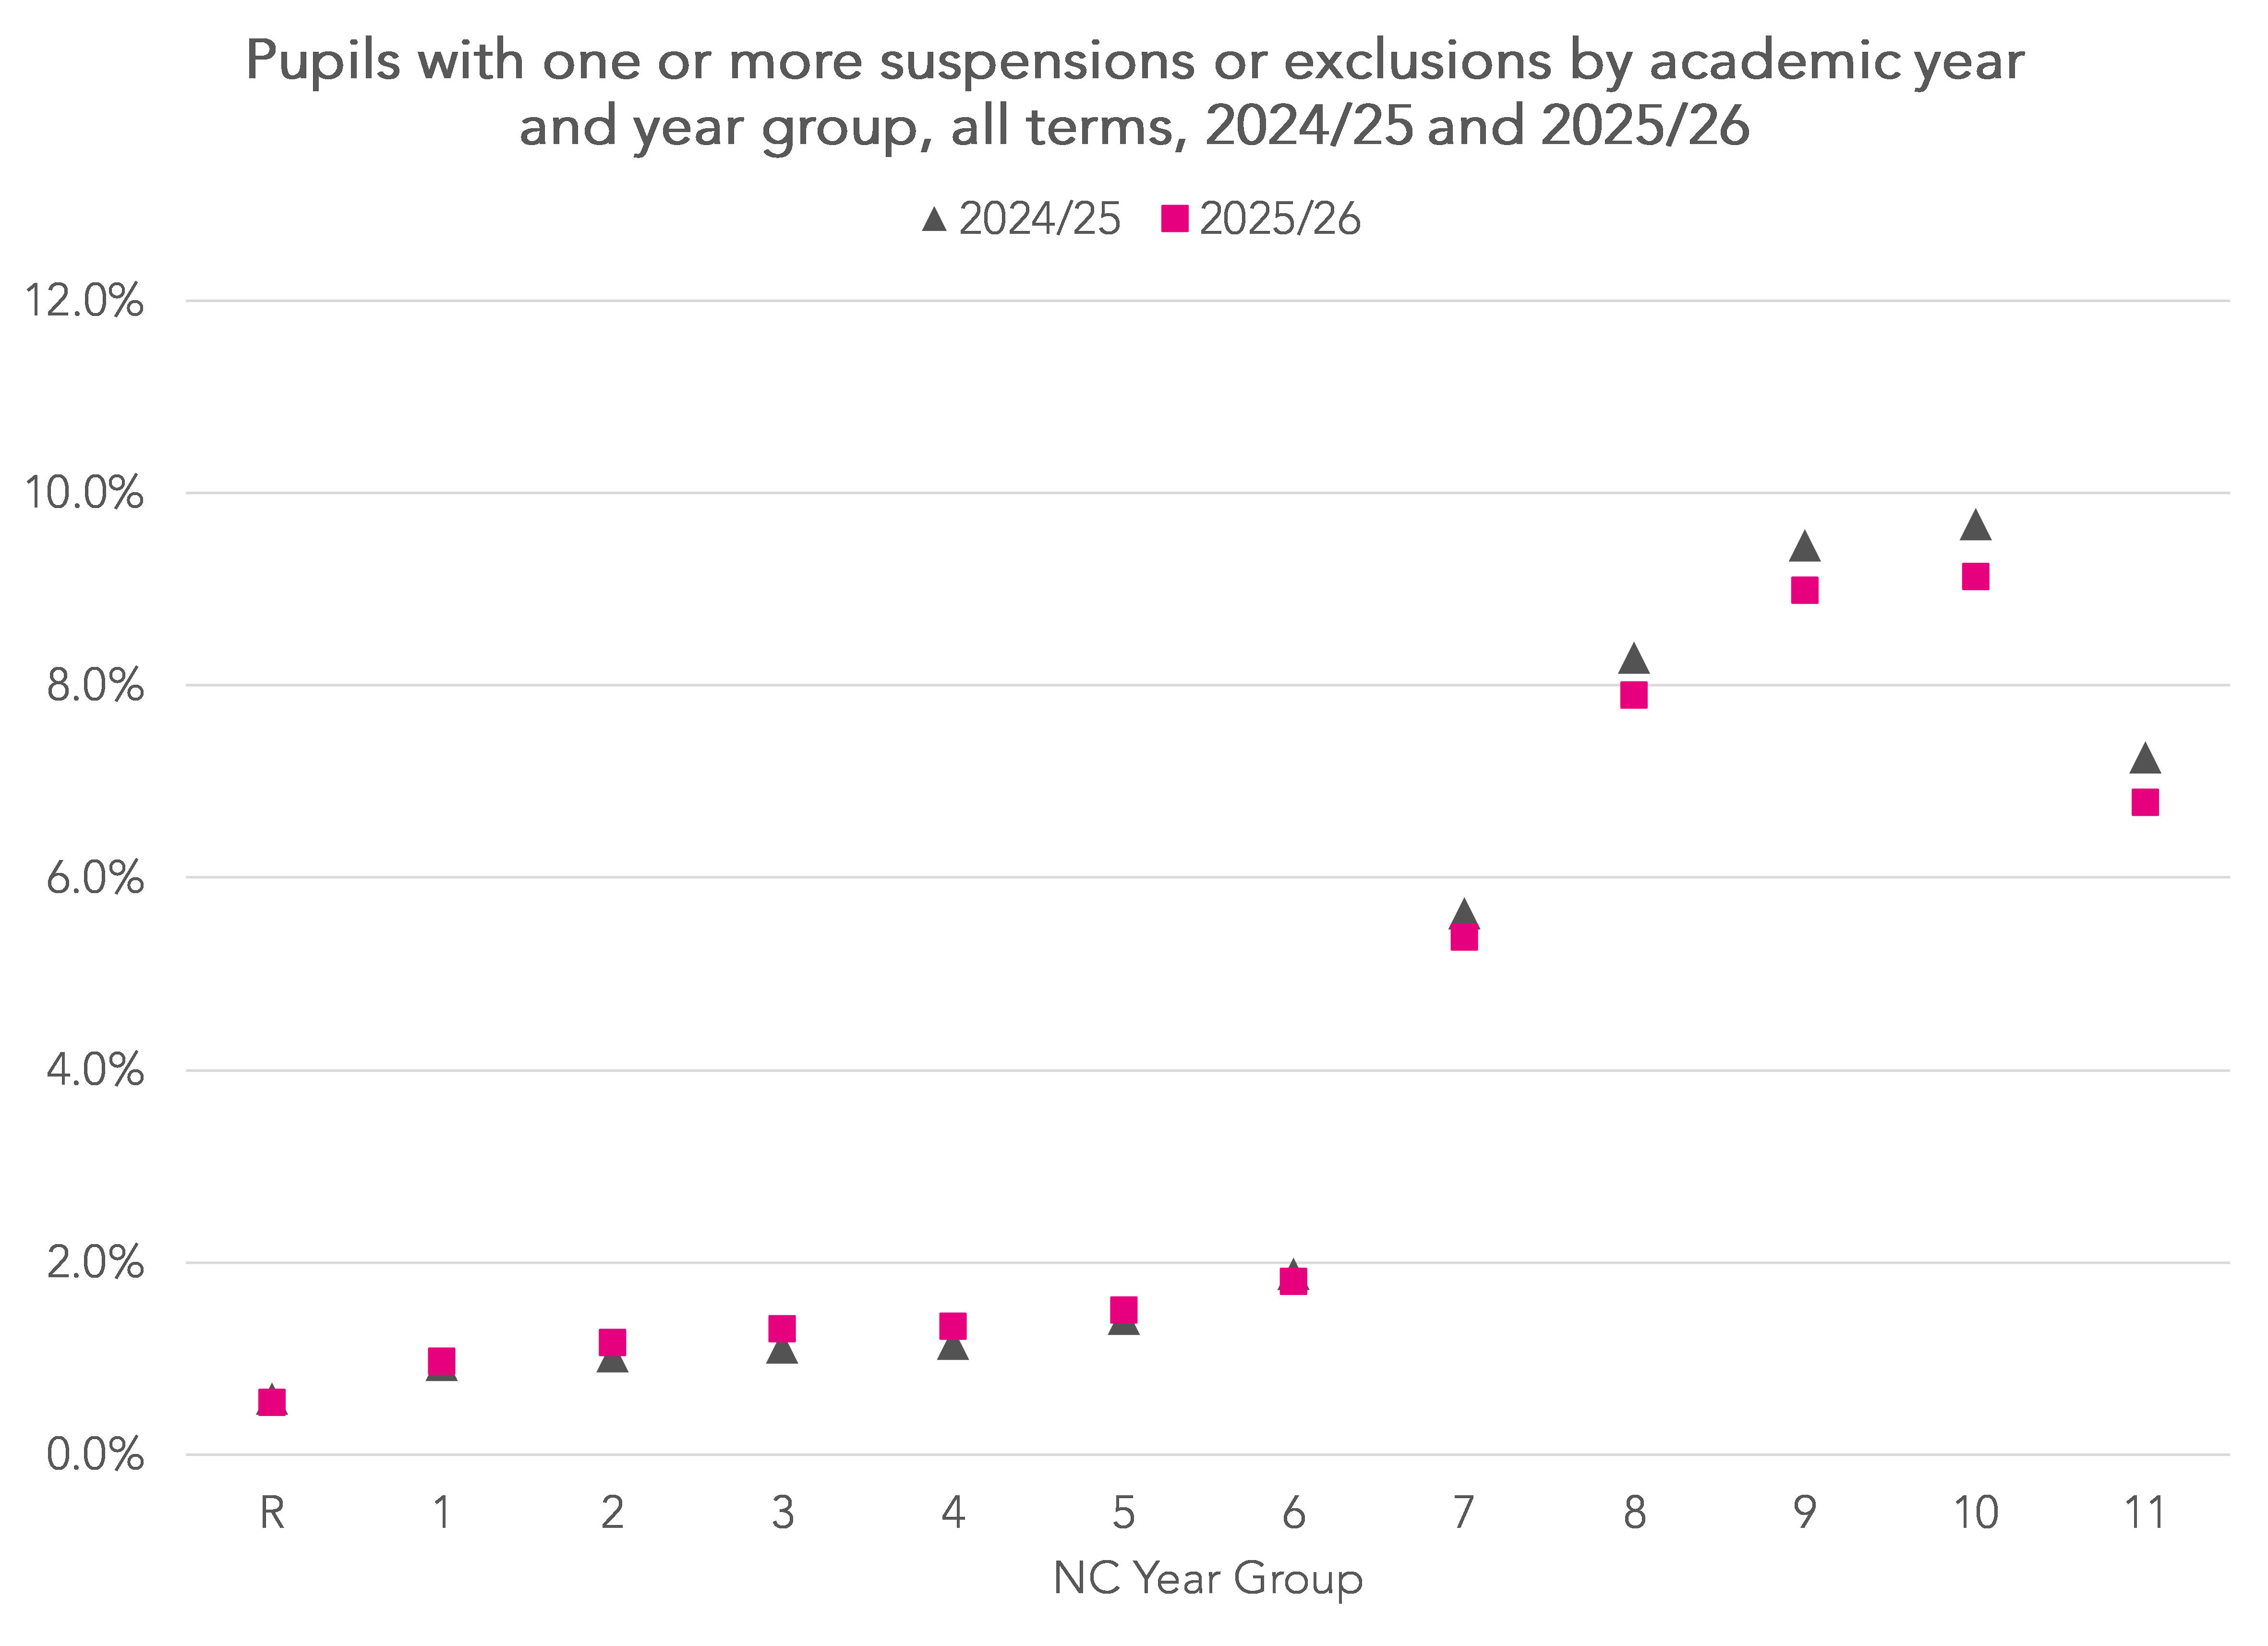
For most year groups, 2025/26 rates were lower than those for 2024/25, slightly higher in primary (years 1 to 5) and slightly lower in secondary.
Disadvantaged pupils
We continue to see stark differences in the percentage of disadvantaged pupils suspended or excluded at least once compared to their peers.
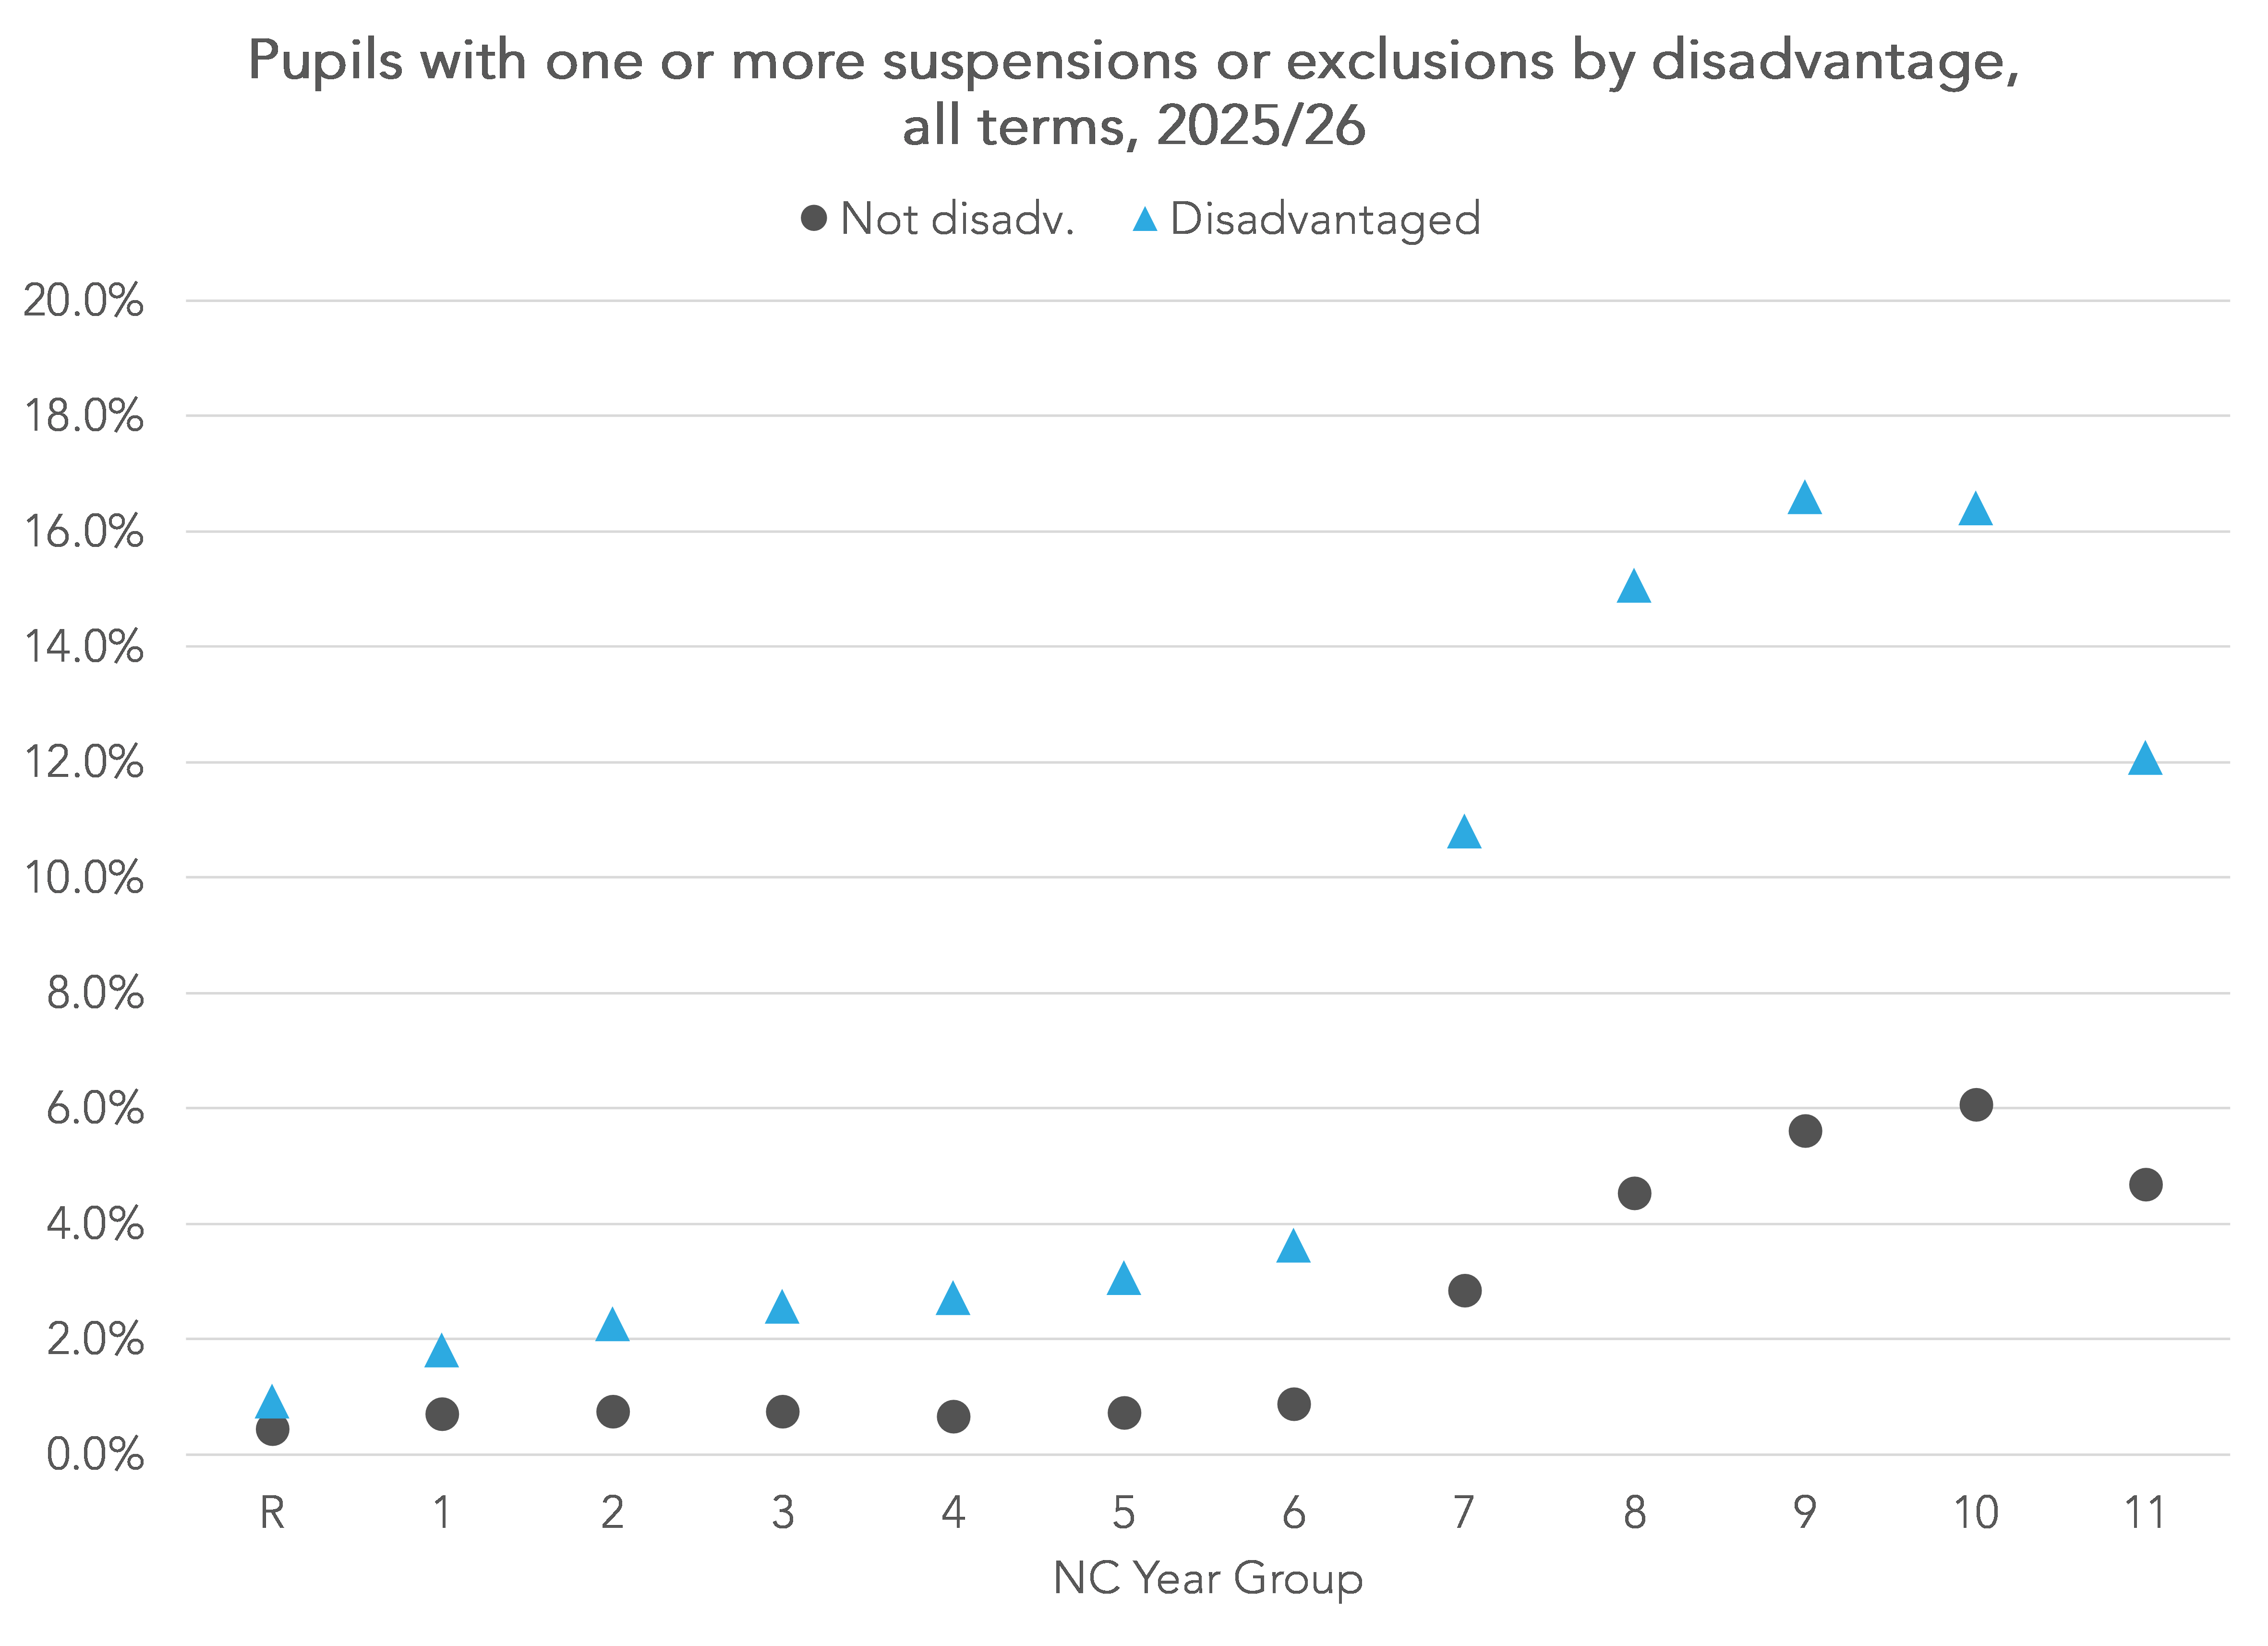
More than 15% of disadvantaged pupils in Years 8, 9 and 10 (around one in six) were suspended or excluded at least once in 2025/26. However, this is a small improvement on figures for last year (see the final chart here).
Disadvantage, along with a previous history of social care and a previous history of suspension are the biggest risk factors of exclusion.
Summing up
Published DfE statistics show that the suspension rate fell in 2024/25, having increased each year since the pandemic.
Data for the 2025/26 academic year suggests that the rate of suspensions is continuing to fall.
But it remains the case though that disadvantaged pupils are disproportionately (far) more likely than other pupils to experience exclusion or suspension.
Want to stay up-to-date with the latest research from FFT Education Datalab? Sign up to Datalab’s mailing list to get notifications about new blogposts, or to receive the team’s half-termly newsletter.
Leave A Comment