Long-term outcomes: Does it make a difference if your school has a sixth form?
Comparing the higher education, employment and earnings outcomes of those who attend schools with sixth forms with those who don’t.

Comparing the higher education, employment and earnings outcomes of those who attend schools with sixth forms with those who don’t.
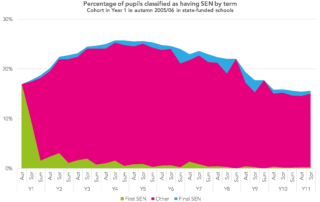
Over 40% of pupils in recent cohorts were classified as having special educational needs at some point.
Comparing the education, employment and earnings outcomes of those who took BTECs and those who took A-Levels.

Explaining how these three things fit together.

A look at the long-term outcomes for those who took BTEC and OCR applied science instead of science GCSEs.
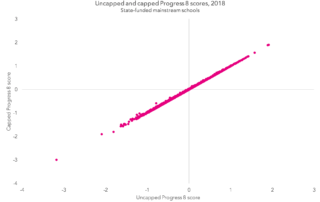
The effects of the removal of ECDL and the capping of extreme negative P8 scores

How are schools’ results affected as Pupil Premium statuses change?
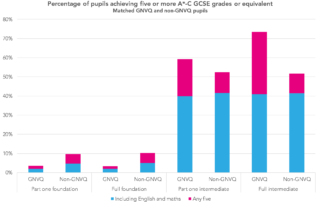
At their height, tens of thousands of pupils entered the qualifications each year.

An example of how eligibility for free school meals changes in response to changes in benefits policy.