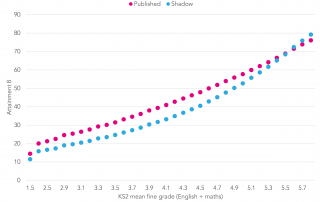
What PISA tells us about pupils from ordinary working families

Last week, we heard a lot from the government about their interest in children from ‘ordinary working families’. (For our initial take on the topic, see here and here.) In its new consultation document, the Department for Education has provided information on the GCSE grades and progress of these children – defined as those not [...]

By |2017-10-23T13:02:25+01:0020th April 2017|Admissions, Exams and assessment, Pupil demographics|

‘Ordinary working families’ won’t get access to grammar schools – and government data confirms as much

The new government consultation on ‘ordinary working families’ is being used as the latest piece of arsenal to shore up support for grammar schools among the general public (the majority of whose children will, of course, get to attend secondary moderns). From it they conclude that the children of ordinary working families stand a good [...]

By |2017-10-23T13:16:23+01:0012th April 2017|Admissions, Pupil demographics|

What does PISA 2015 tell us about deprivation and highly able children?

There’s long been interest in socio-economic inequalities in educational achievement in England. Typically, most research in this area focuses on differences in average scores. Less attention has been paid to young people at the extremes of the distribution – for instance, how achievement varies between the most able pupils from advantaged and disadvantaged socio-economic backgrounds. [...]

By |2017-10-23T13:16:15+01:009th February 2017|Pupil demographics|

‘Schools that work for everyone’ consultation – Education Datalab response

Education Datalab has today submitted its response to the government’s Schools that work for everyone consultation. The green paper consulted on: the identification of those families who are ‘just about managing’; the contribution which independent schools can make to the state sector; conditions that should be met if existing selective schools are to be allowed [...]

By |2017-10-23T13:09:49+01:0012th December 2016|Pupil demographics, Reports, Structures|

Understanding grammar schools

Since the government’s announcement that it wants to see the return of more widespread selectivity to England’s education system we have written quite extensively about grammar schools and the impact of selectivity. In this post, however, we’re going to step back a little and offer a more descriptive overview of the existing network of selective [...]

By |2018-09-27T17:57:38+01:001st December 2016|Admissions, Pupil demographics|

Apples to apples: are grammar schools really as effective as they seem?

This post was updated at 8.30 AM on 22 November. An earlier draft of the piece had originally been posted in error. What is the reasoning behind the government’s proposal for more selective schools: greater choice or better schools? Numerous studies have demonstrated that both have flawed foundations, including from the Education Policy Institute [PDF] and ourselves [PDF], [...]

Ethnic minority groups are great at passing the 11-plus

There are striking differences in the propensity of different ethnic groups to gain access to grammar schools. If we look at high achieving eleven-year-olds in the four fully selective local authorities of Kent, Medway, Buckinghamshire and Lincolnshire, just 29 per cent of the white British pupils who achieved a fine grade score of 5.0 on [...]

By |2017-10-23T13:15:53+01:007th November 2016|Admissions, Pupil demographics|

When is a comprehensive school actually a secondary modern?

The National Association of Secondary Moderns might soon be growing its membership. By how much? It is hard to say, not least because not all non-grammar schools in selective areas choose to call themselves secondary moderns (just 117 do). Also, there are schools outside selective areas that are heavily affected by the presence of a [...]

By |2017-11-06T14:22:04+00:002nd November 2016|Admissions, Pupil demographics|

Provisional KS4 data 2016: Grammar schools reporting fantastic Progress 8 scores? Not so fast…

Today’s provisional Key Stage 4 data shows a strong Progress 8 performance from grammar schools, and a negative Progress 8 score for those calling themselves secondary moderns. But the positive results of the grammars seem to more than outweigh the negative results of secondary moderns. So, should we use this data to claim that selection [...]

By |2017-10-23T12:43:53+01:0013th October 2016|Exams and assessment, School accountability, Structures|
Go to Top