Who’s Left 2018, part four: Our methodology
The fourth part of our series looking at the pupils who leave mainstream school rolls.

The fourth part of our series looking at the pupils who leave mainstream school rolls.

The third part of our series looking at the pupils who leave mainstream school rolls.

The second part of our series looking at the pupils who leave mainstream school rolls.
The first part of our series looking at the pupils who leave mainstream school rolls.
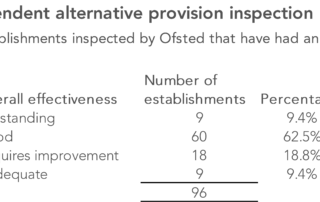
Inspection ratings for the independent alternative provision sector are some way worse than those for state alternative provision.
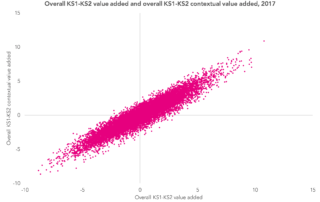
Announcing a new report for secondary schools that gives a different way of looking at value added.
Announcing a new report for primary schools that gives a different way of looking at value added.

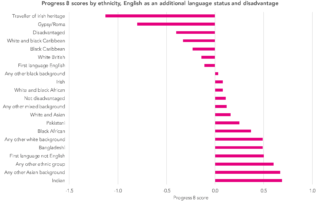
A look at how Progress 8 scores would change if they were calculated purely based on those pupils on-roll in Year 7.

This research explores Progress 8 scores by feeder primary school – including a resource allowing secondary schools to see their own data.