Difficult questions about some schools’ Key Stage 2 results
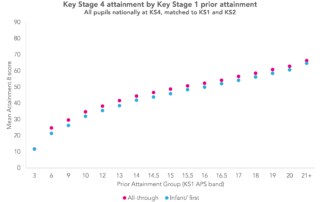
This research explores Progress 8 scores by feeder primary school – including a resource allowing secondary schools to see their own data.

This research explores Progress 8 scores by feeder primary school – including a resource allowing secondary schools to see their own data.
Is it real underperformance, or something else? The Datalab team take a look at the issue.
This is a joint blogpost from Education Datalab and The Difference. The Difference is a new training programme, creating the next generation of school leaders, upskilled in supporting pupil mental health and reducing exclusion from school. Leaders spend two years teaching in alternative provision while studying a specialist leadership course, focusing on mental health, safeguarding [...]
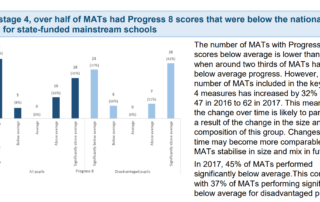
Answer: It isn’t. So why ask the question? Well, among the glut of statistics published by the Department for Education on Thursday was a statistical first release on the performance of multi-academy trusts (MATs) [PDF]. At the top of the second page was this curious chart. At first glance, this looks rather alarming. It seems to [...]
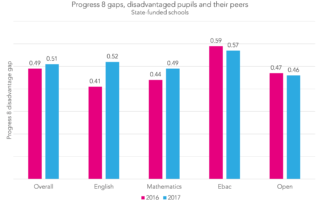
Today’s Key Stage 4 statistical release from the Department for Education shows the gap between disadvantaged pupils and others to be narrowing slightly [PDF]. This is based on the DfE's gap index, which is calculated by ranking pupils according to their English and mathematics grades and then calculating an overall index. It would appear to be [...]
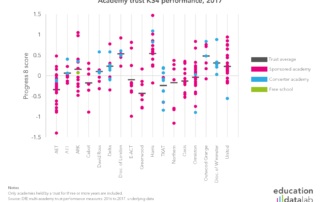
Along with Key Stage 4 and Key Stage 5 league tables, the Department for Education has this morning published multi-academy trust league tables – the second year it has published these in full. This analysis looks purely at the DfE’s Key Stage 4 MAT league tables, focusing on those trusts with more than five secondary [...]

The first table in this post was updated at 17.42 on 25 January 2018 after we noticed – of all things – that percentages in the table did not add up to 100. We very much regret the error. Key Stage 4 league tables – performance tables, to use their proper name – have been published this [...]
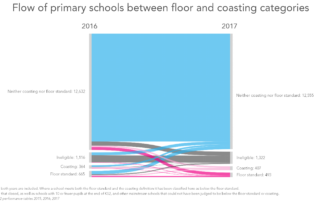
We’ve already looked at the number of schools judged to be below the floor standard, and to be coasting, based on the Key Stage 2 performance tables data published this morning. But, looking a little deeper, how stable are these classifications – how many schools that ended up in one of these groups last year [...]
Key Stage 2 league tables – performance tables, to use their proper name – have been published this morning, identifying those schools below the government’s floor standard, and those judged to be coasting. So what can we say about the schools in these two groups? And are junior schools still more likely to fall into [...]