How do qualification entry rates differ between schools and multi-academy trusts?
Including details of a new report for FFT Aspire users.
Including details of a new report for FFT Aspire users.
Exploring some of the problems with using commercial tests to measure pupil progress
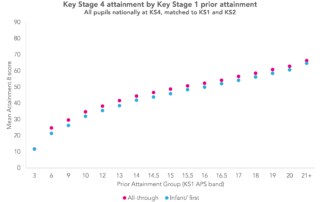
The second post in a series exploring the link between Key Stage 1 scores and Key Stage 4 results.

A look at how Progress 8 scores would change if they were calculated purely based on those pupils on-roll in Year 7.

This research explores Progress 8 scores by feeder primary school – including a resource allowing secondary schools to see their own data.
Is it real underperformance, or something else? The Datalab team take a look at the issue.
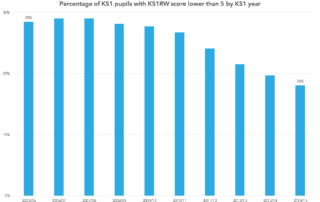
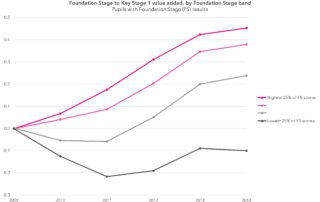
This is the first of two posts in a series of blogposts looking at the relationship between Key Stage 1 attainment and Key Stage 4 outcomes. The second post can be found here. There are many ways of defining success at Key Stage 4. One aspect is whether pupils have attained appropriate literacy and numeracy [...]
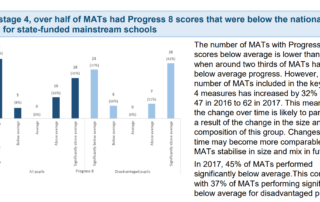
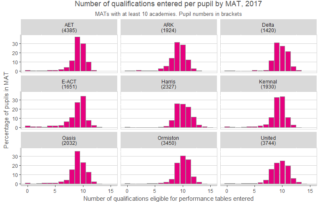
Answer: It isn’t. So why ask the question? Well, among the glut of statistics published by the Department for Education on Thursday was a statistical first release on the performance of multi-academy trusts (MATs) [PDF]. At the top of the second page was this curious chart. At first glance, this looks rather alarming. It seems to [...]
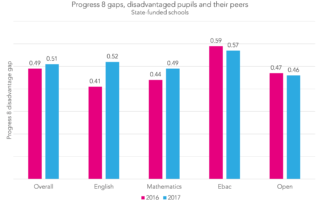
Today’s Key Stage 4 statistical release from the Department for Education shows the gap between disadvantaged pupils and others to be narrowing slightly [PDF]. This is based on the DfE's gap index, which is calculated by ranking pupils according to their English and mathematics grades and then calculating an overall index. It would appear to be [...]