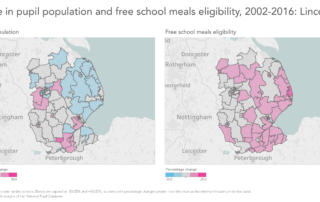
Explore England’s changing free school meals rates

Most of the time our work involves using the National Pupil Database to examine particular aspects of the education system. However, it can also throw up interesting insights into the state of the nation more generally. Last year, we wrote about how the percentage of pupils eligible for and claiming free school meals (FSM) had [...]

By |2018-09-27T17:26:02+01:0018th December 2017|Pupil demographics|

KS2 performance tables 2017: The reason schools ended up below the floor standard this year

Key Stage 2 league tables – performance tables, to use their proper name – have been published this morning, identifying those schools below the government’s floor standard, and those judged to be coasting. So what can we say about the schools in these two groups? And are junior schools still more likely to fall into [...]

KS2 performance tables 2017: Three things from this morning’s data

Today’s Key Stage 2 Statistical First Release provides further information on the 2017 Key Stage 2 results which we first wrote about here. This includes school-level data, plus data on the performance of different groups of pupils. There are some interesting differences in progress scores between ethnic groups There is much greater variation in the [...]

By |2017-12-15T15:17:14+00:0014th December 2017|Exams and assessment, School accountability|

Test reliability, and why it matters for primary school performance tables

This year’s Key Stage 2 performance tables will be published tomorrow, summarising the attainment of pupils in KS2 tests in reading, maths, and grammar, punctuation and spelling (GPS). But how reliable are these tests, and what does this mean for published performance indicators? Getting the right balance A well-designed test should give a pupil the [...]

Who are the pupils in alternative provision?

Latest DfE statistics show that there were almost 16,000 pupils on-roll at pupil referral units, and another 22,000 in other local authority alternative provision in January 2017 [XLS, table 1b]. These are pupils whose education is paid for by the state but who do not have places at state-funded mainstream or special schools. The different [...]

By |2018-09-27T17:29:18+01:0011th October 2017|Admissions, Pupil demographics, Structures|

Long-term disadvantage, part four: If Carlsberg made schools…and also designed funding formulae?

This is part four in a series of blogposts exploring long-term disadvantage. Other posts in the series can be found here. At the start of the summer we showed that there are substantial differences in the attainment and progress of pupils who have been disadvantaged at some stage. The main findings of these earlier posts were [...]

By |2018-09-27T17:32:27+01:008th September 2017|Pupil demographics, School funding|

Provisional KS2 data 2017: Five key points from today’s release

1. The percentage of pupils achieving the higher standard has increased We already knew that the percentage of pupils achieving the expected standard in reading, writing and maths increased from 53% last year to 61% this year. And today’s release of provisional Key Stage 2 data shows that the percentage reaching the higher standard increased [...]

By |2017-12-20T13:23:44+00:0031st August 2017|Exams and assessment, School accountability|
Go to Top