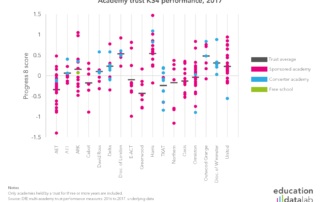
Key Stage 4 performance tables 2017: Closing the gap just got harder

Today’s Key Stage 4 statistical release from the Department for Education shows the gap between disadvantaged pupils and others to be narrowing slightly [PDF]. This is based on the DfE's gap index, which is calculated by ranking pupils according to their English and mathematics grades and then calculating an overall index. It would appear to be [...]

Multi-academy trust league tables 2017: What can we learn from the data? Including a lesson on why we shouldn’t take everything at face value

Along with Key Stage 4 and Key Stage 5 league tables, the Department for Education has this morning published multi-academy trust league tables – the second year it has published these in full. This analysis looks purely at the DfE’s Key Stage 4 MAT league tables, focusing on those trusts with more than five secondary [...]

By |2018-09-27T17:23:18+01:0025th January 2018|School accountability, Structures|

KS4 performance tables 2017: Everything we know about coasting schools and floor standard schools

The first table in this post was updated at 17.42 on 25 January 2018 after we noticed – of all things – that percentages in the table did not add up to 100. We very much regret the error. Key Stage 4 league tables – performance tables, to use their proper name – have been published this [...]

What is the National Pupil Database?

Many of the blogposts and reports that we produce here at Datalab are based on analysis of the Department for Education’s National Pupil Database (NPD). But what is it? What is the NPD? The NPD is a collection of data relating to education in England compiled by the Department for Education. The NPD is made [...]

By |2018-05-03T09:56:46+01:0023rd January 2018|News|

Explore England’s changing free school meals rates

Most of the time our work involves using the National Pupil Database to examine particular aspects of the education system. However, it can also throw up interesting insights into the state of the nation more generally. Last year, we wrote about how the percentage of pupils eligible for and claiming free school meals (FSM) had [...]

By |2018-09-27T17:26:02+01:0018th December 2017|Pupil demographics|

Provisional KS4 data 2017: Has your Progress 8 score improved?

I’m not normally inclined to say “I told you so” but, in this case, it might be justified. Back in 2015, when the Department for Education announced the scores for old style GCSEs in 2017, Dave Thomson and I did some calculations to look at 'what if' the DfE 2016 and 2017 scoring systems were applied [...]

Provisional KS4 data 2017: North East secondary schools fall further behind the rest of the country

Last year at the Schools NorthEast Annual Summit I was delighted to talk to primary teachers and learn how they had become a high-performing region. Today I had less happy conversation with their secondary colleagues about why they are falling behind at GCSE. As the chart below shows, the North East has always scored poorly [...]

By |2017-10-18T18:06:46+01:0012th October 2017|Exams and assessment, School accountability|

Provisional KS4 data 2017: A round-up

The EBacc continues to be ignored There was a slight fall in the percentage of pupils entered for all five subjects making up the English Baccalaureate (EBacc). Even so, the percentage entered for the science and humanities components actually increased. The fall in the headline EBacc entry rate was entirely due to a drop in [...]

Go to Top