Data, data everywhere…
How much data are schools collecting – and how much do teachers think they should be collecting?
How much data are schools collecting – and how much do teachers think they should be collecting?
How do Ofsted ratings relate to how much data a school collects?
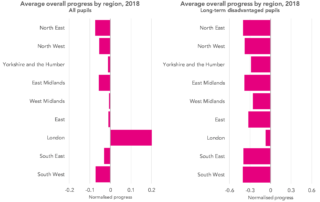
Updating research into the high performance of pupils in the capital
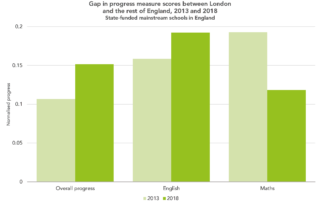
Updating research into the high performance of pupils in the capital

The second post in a new series exploring the impact that within-school variation has

The first post in a new series exploring the impact that within-school variation has
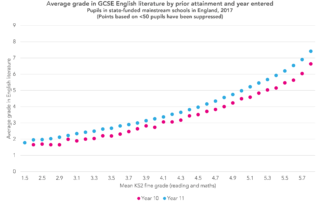
The second of two preview posts ahead of this year's GCSE results day.

A look at how Progress 8 scores would change if they were calculated purely based on those pupils on-roll in Year 7.
Is it real underperformance, or something else? The Datalab team take a look at the issue.